Analytics · Page 4
How metrics are defined, where numbers disagree, and how to read a funnel or a retention curve without fooling yourself.
This category covers the mechanics of measurement: what a visitor is, why sessions differ between tools, how to build a funnel that survives scrutiny, and how to spot bot traffic before it skews a decision. Every article uses the same sample dataset you see in the product, so you can reproduce the reasoning in your own workspace.
Articles in Analytics
304 articles · page 4 of 7
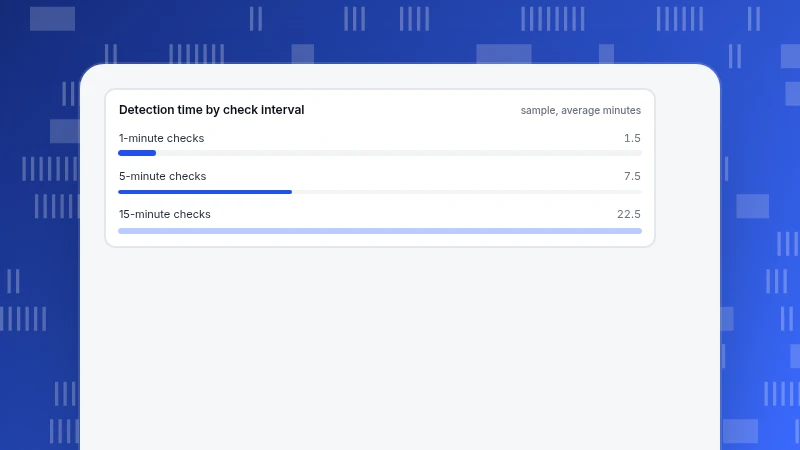
Website Monitoring: The Four Types and What to Alert On
Website monitoring covers availability, performance, errors and content, each needing its own check and alert rule. Synthetic vs real-user data, check-interval arithmetic, percentiles and thresholds set from history.
Read more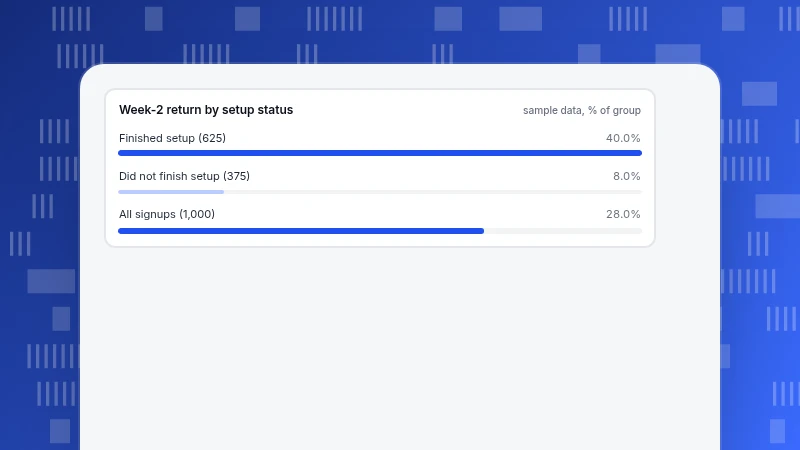
User Analytics: Who Uses Your Product, How, and How Well
User analytics answers three questions about the people using your product: who they are, how they use it and how well it works for them. Questions, prerequisites, a worked example from outcome to decision, and personal-data habits.
Read more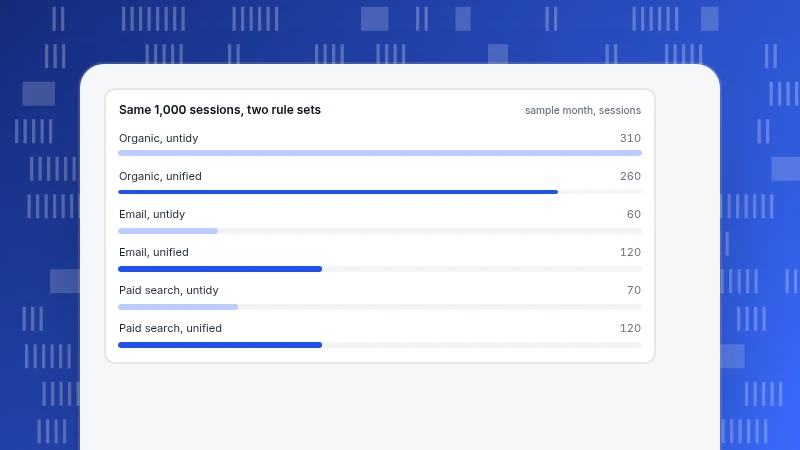
Traffic Sources: Types, and the Rules That Sort Visits Into Them
Traffic sources fall into direct, organic search, paid search, social, email and referral, but the label is assigned by rules, not by the visitor. The types, the rule order, a worked example and the mistakes that skew reports.
Read more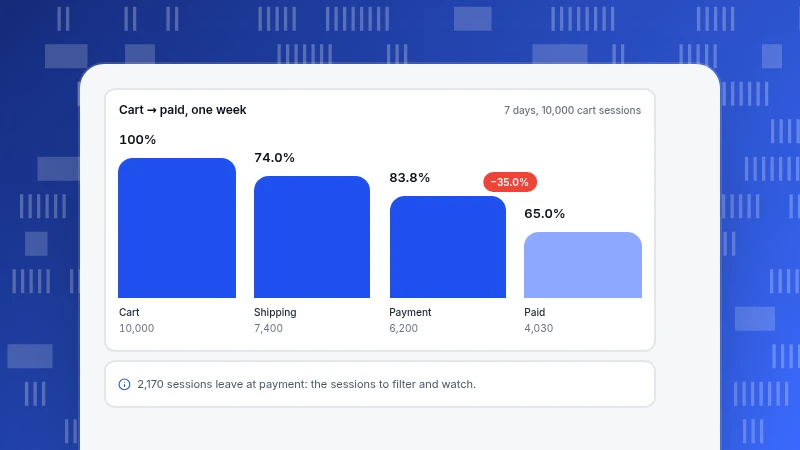
Session Replay Software: Uses, Limits and Privacy
Session replay software shows what one visitor did on a page. Learn when to use it, how many sessions to watch, what it does to privacy and how to choose, with a worked funnel example.
Read more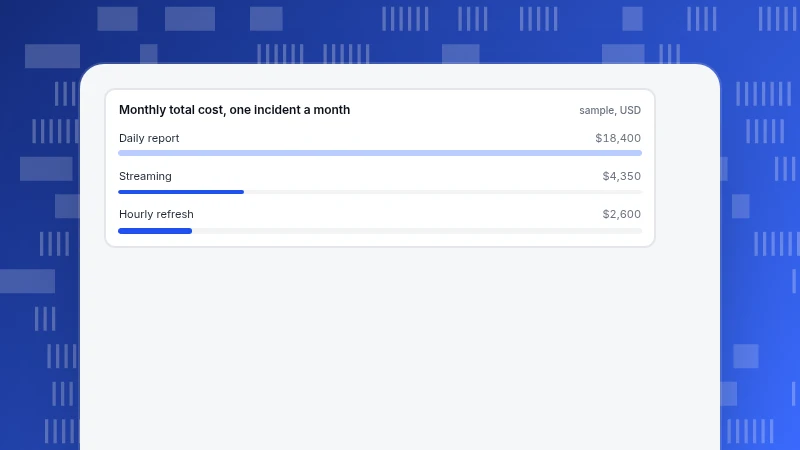
Real-Time Analytics Platforms: Do You Need One?
What real-time analytics platforms are, which decisions really need them, and how to work out break-even between daily, hourly and streaming data, with a worked cost example and vendor questions.
Read more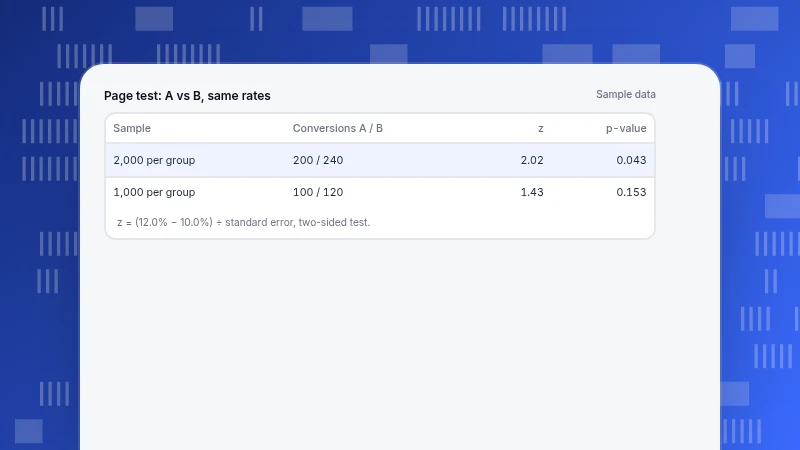
Quantitative Research Examples: Question, Sample and Test
Quantitative research examples that name the question, the sample and the test: three published designs, a survey sample-size calculation and a two-group comparison, all recomputable, plus a six-step design routine.
Read more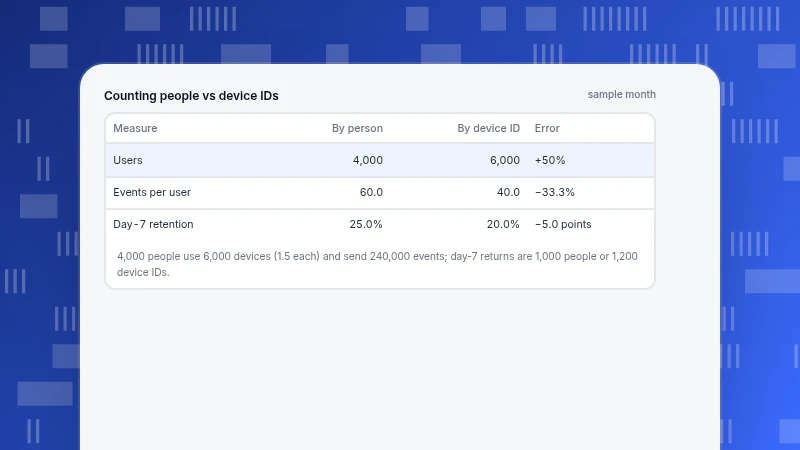
Product Analytics Platform: How to Choose One (Event Model and Identity First)
How to choose a product analytics platform: check the event model and identity first, run a two-week trial on one real flow and score candidates with weights. Includes a priced identity example and a weighted scoring worked example.
Read more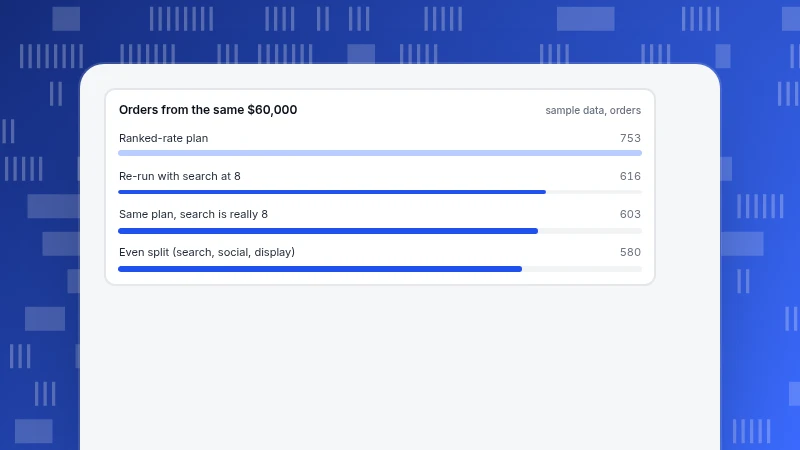
Prescriptive Analytics: What It Is, How It Works and Which Tools Fit
Prescriptive analytics recommends what to do from predictions, constraints and an objective. How it differs from descriptive, diagnostic and predictive analytics, a hand-worked budget example with a sensitivity case, and which kind of tool fits.
Read more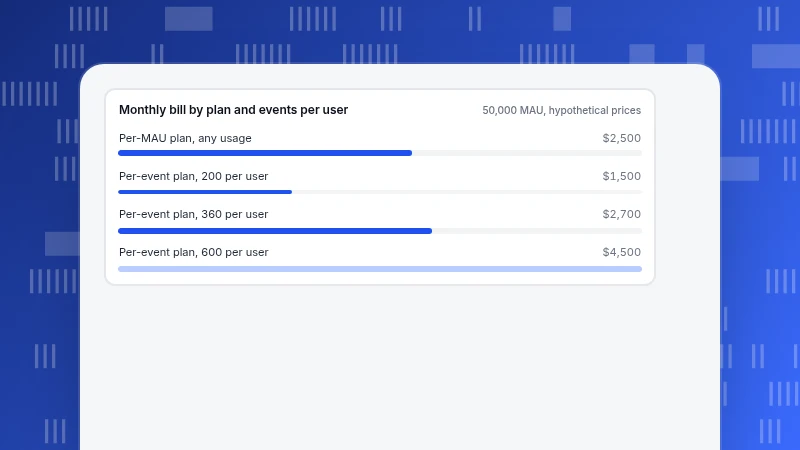
App Analytics Tools: How to Choose on Four Points, Not Feature Lists
How to choose app analytics tools: compare collection, attribution, privacy and cost. Includes a pricing break-even example, a seven-step test before you commit and a migration plan, without naming vendors.
Read more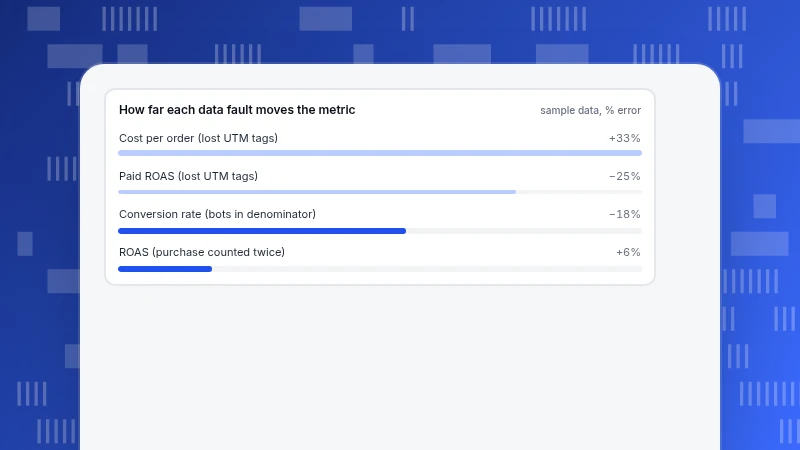
Impact of Poor Data Quality: Decisions, Cost and Trust, With a Worked Example
The impact of poor data quality lands in three places: decisions, cost and trust. Three sample data faults show how a bot-inflated denominator, a double-counted purchase and lost UTM tags turn into wrong decisions with money attached.
Read more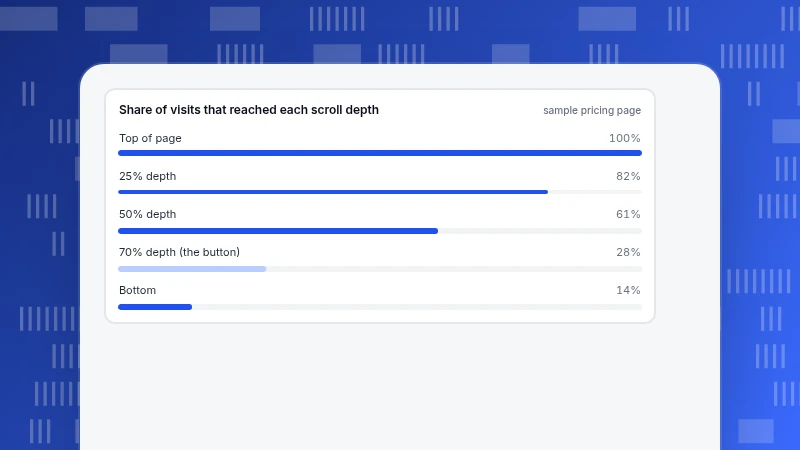
Heat map examples: six patterns and what each one means
Six recurring shapes on website heat maps, what each usually means, what to check and what to change, plus a worked example of a button nobody reaches.
Read more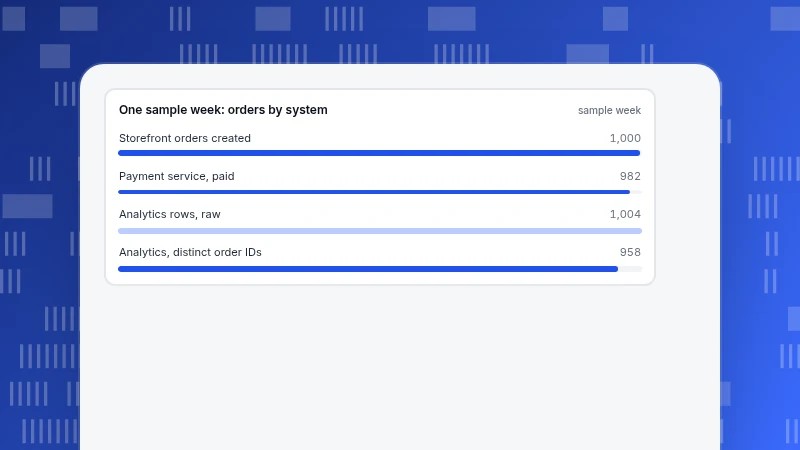
Ecommerce integration: align orders, products and users first
Most ecommerce integration problems are identifier problems. How to align order, product and user IDs across your store, payments and analytics, and how to reconcile a week of orders.
Read more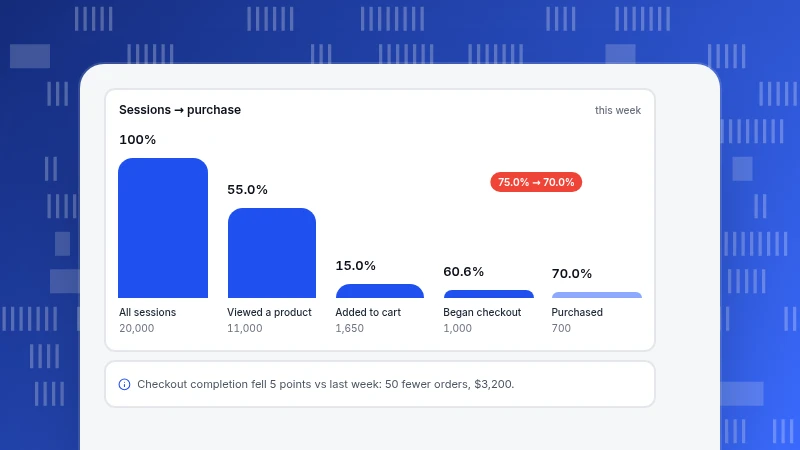
Ecommerce Dashboard: What to Put on It and in What Order
An ecommerce dashboard should follow the shopper's path: traffic, conversion, order value, repeat. A metric table, a recomputed week that isolates one moved funnel step, and layout rules.
Read more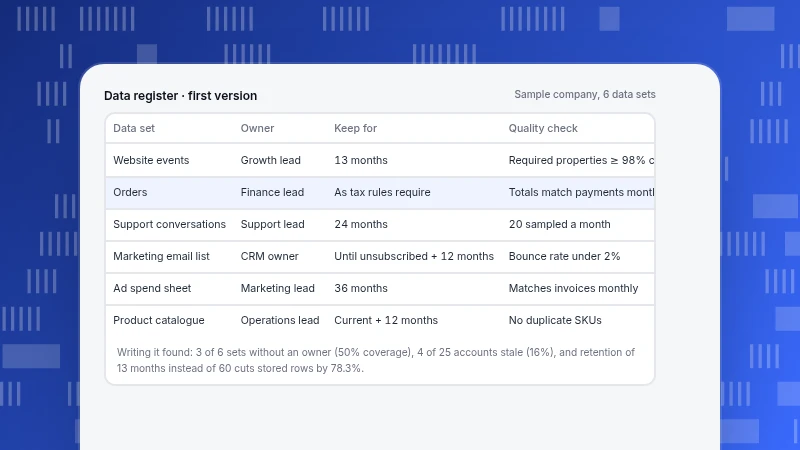
Data Management Strategy: Five Elements and a Four-Week Start
A data management strategy decides who owns each data set, what it means, how good it must be, who can use it and how long it is kept. Five elements, a four-week plan and a recomputed register.
Read more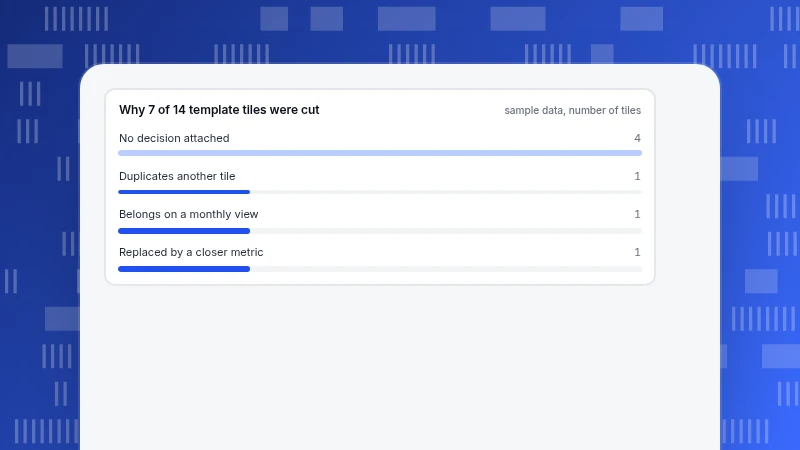
Dashboard Template: How to Adapt One to the Decisions You Make
A dashboard template saves layout time, but its metrics have to change to fit your decisions. Pick a template by decision, adapt it in five steps, and see a 14-tile template cut to 7.
Read more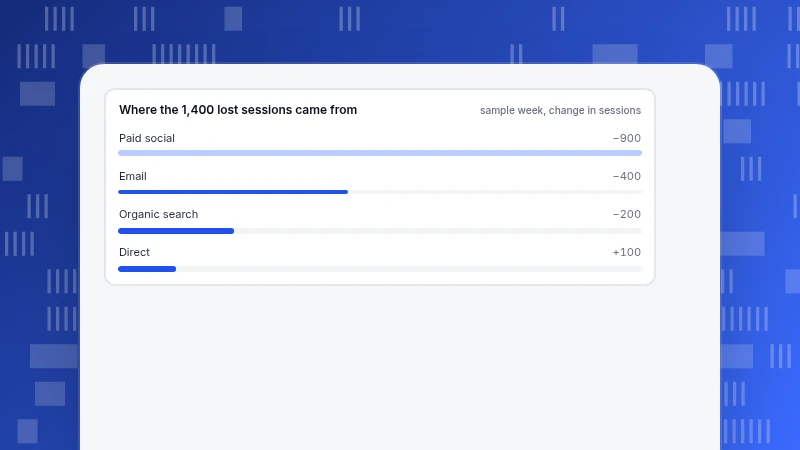
Dashboard Reporting: Turn a Dashboard into a Report That Gets Acted On
A dashboard shows; a report concludes. How to turn dashboard numbers into a regular report with a headline, a few compared numbers, a reason and an owned action, with a recomputed weekly example.
Read more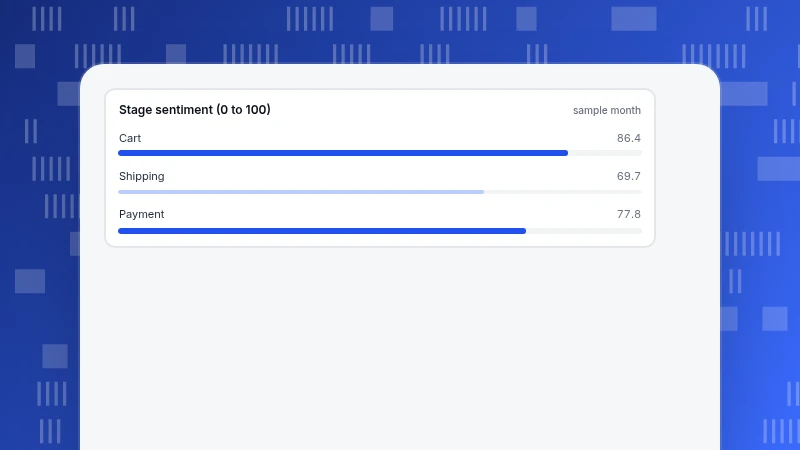
Customer Experience Analytics: How to Find Where Customers Get Stuck
Customer experience analytics puts behaviour, feedback scores and conversations side by side to find where people stall or leave. A seven-step method and a worked checkout example.
Read more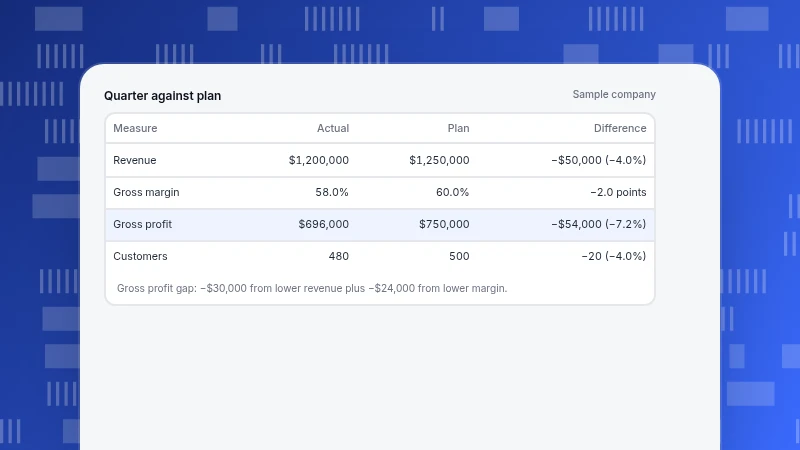
Business Reports: Types, Structure and a Template for Each Audience
Business reports work when written for one reader. Seven types, a who-needs-what table, a six-part structure, and one quarter written as a board paragraph and a manager version from the same numbers.
Read more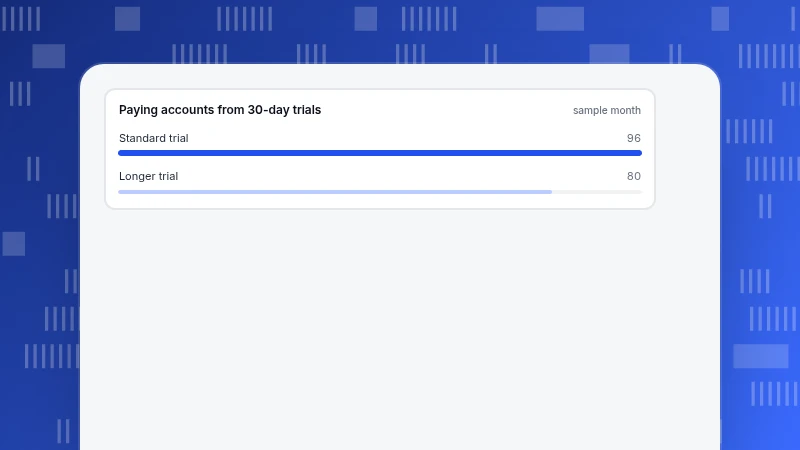
What Are Metrics in Business? Organise Them as North Star, Inputs and Guardrails
What metrics are in business, the five main types, and how to organise them into a north star, a few inputs and guardrails, with a worked example where a guardrail catches a harmful improvement.
Read more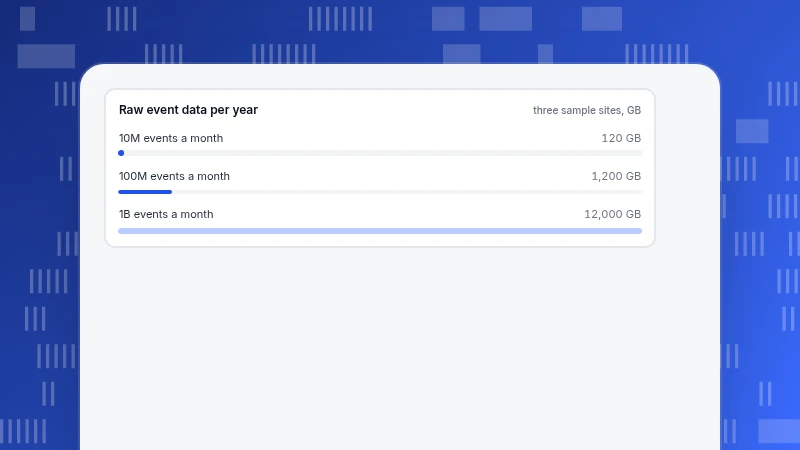
Big Data Analytics Examples: What They Share and Whether You Need Them
Eight big data analytics examples by industry, written question-first, with the four traits they share and a sizing calculation that shows whether your own event volume really needs big data tools.
Read more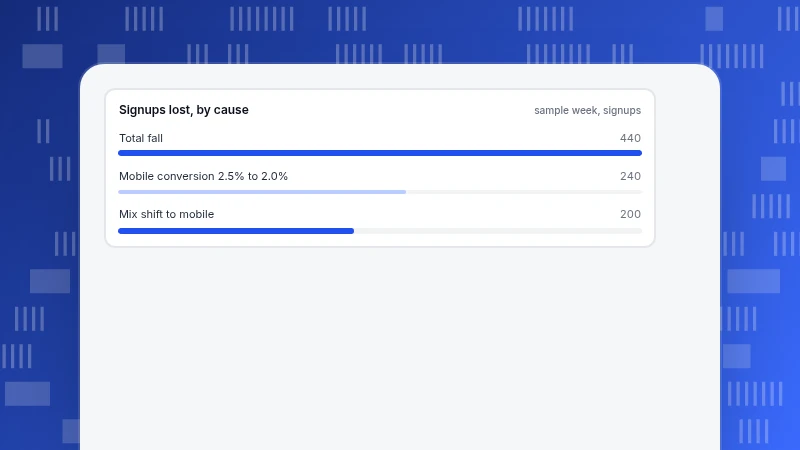
Analytics Reporting: How to Write a Report That Drives a Decision
Analytics reporting that leads to action: a conclusion-evidence-action structure, a fully worked example that splits an 11.0% drop into mix and rate effects, templates by cadence and caveat rules.
Read more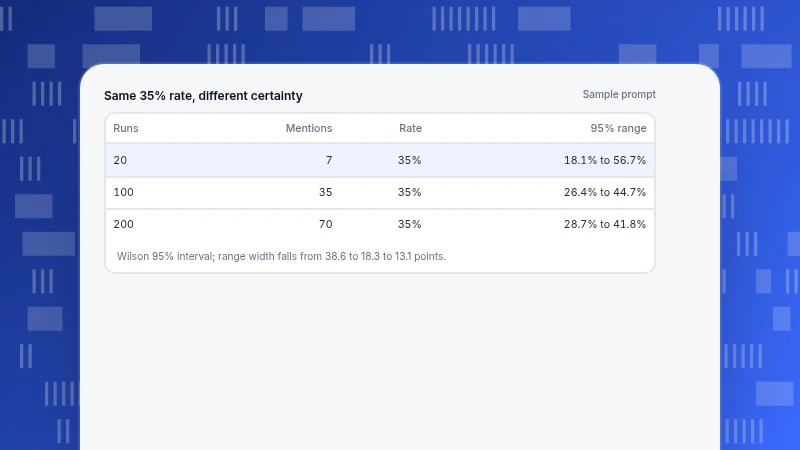
AI Brand Visibility Software: How to Evaluate It Before You Buy
AI brand visibility software reports mentions from sampled prompts, so scores differ by method. Learn the three kinds of tool, the sampling error behind a mention rate, questions to ask vendors and a worked comparison of two reports.
Read more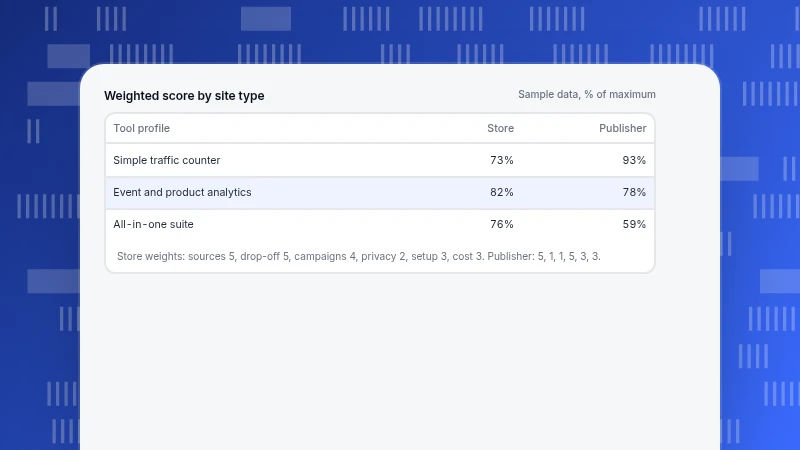
Web Analytics Tools: How to Choose by the Question You Need Answered
Web analytics tools sorted by the question they answer, with a weighted comparison you can recompute, a selection checklist, the real cost of free tiers, privacy triggers and how to switch tools.
Read more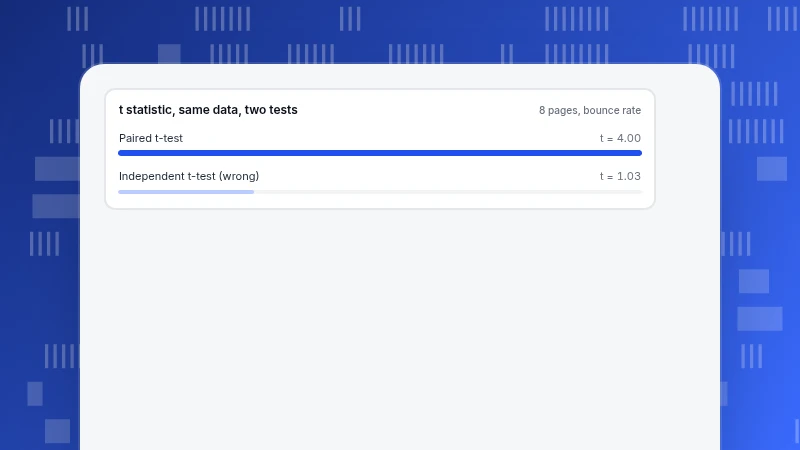
Types of T-Tests: One-Sample, Independent and Paired
The three types of t-tests, a decision rule for choosing, three recomputable worked examples and a demonstration of what the wrong test does to the same data.
Read more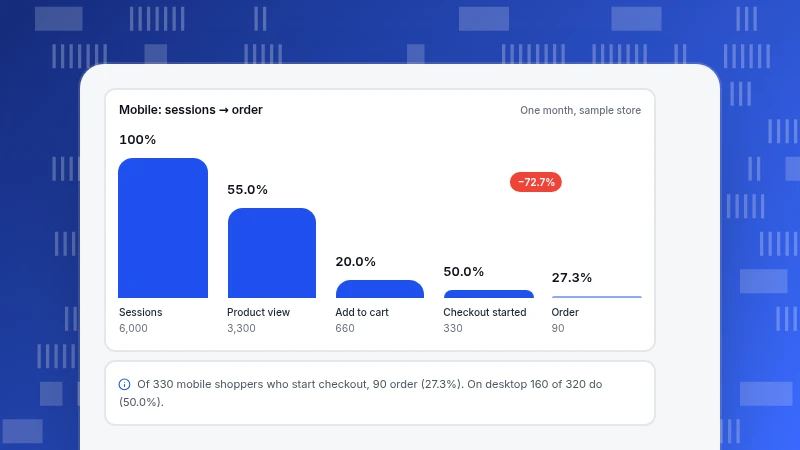
Data Insights: How to Turn Numbers into Decisions
What data insights are, the three parts every real insight has (see, explain, act), a worked example that traces a falling conversion rate to one checkout step, and how to check an insight before acting.
Read more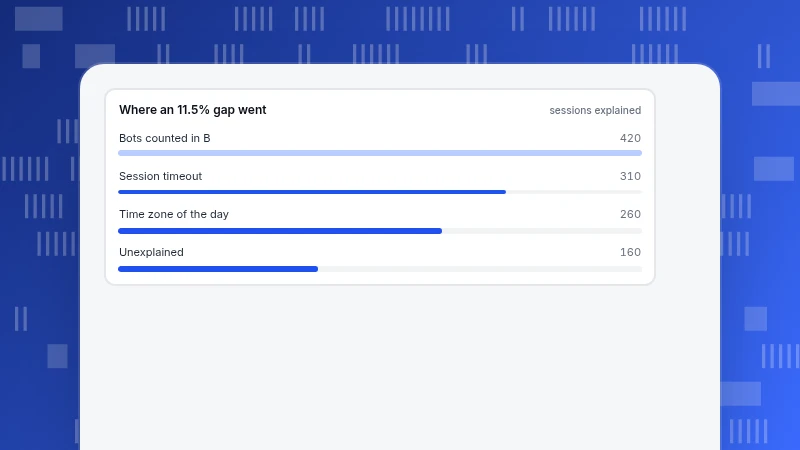
Data Discrepancies: Why Your Analytics Numbers Don't Match
Why two analytics numbers differ and how to find out: a discrepancy formula, eight usual causes, a worked reconciliation that explains an 11.5% gap and a checklist in the order the causes are likely.
Read more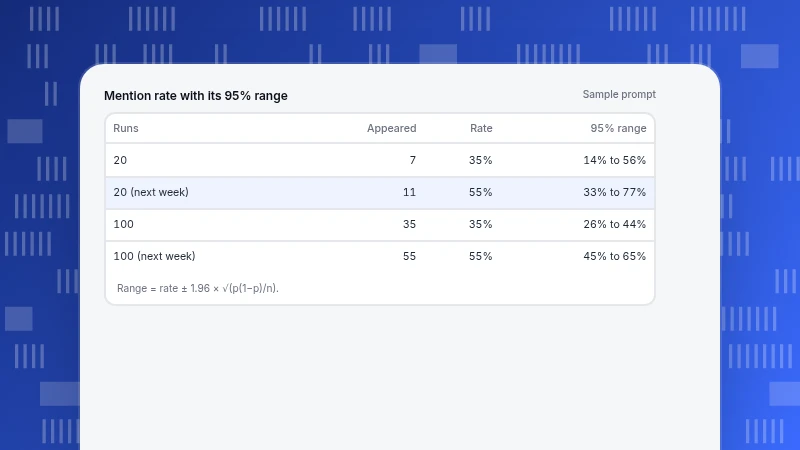
AI Visibility Tracking: What to Measure and How to Do It
AI visibility tracking measures whether assistants cite your site and how many visits they send. See the metrics, three tracking methods, why one check is noise, a recomputed traffic month and the limits.
Read more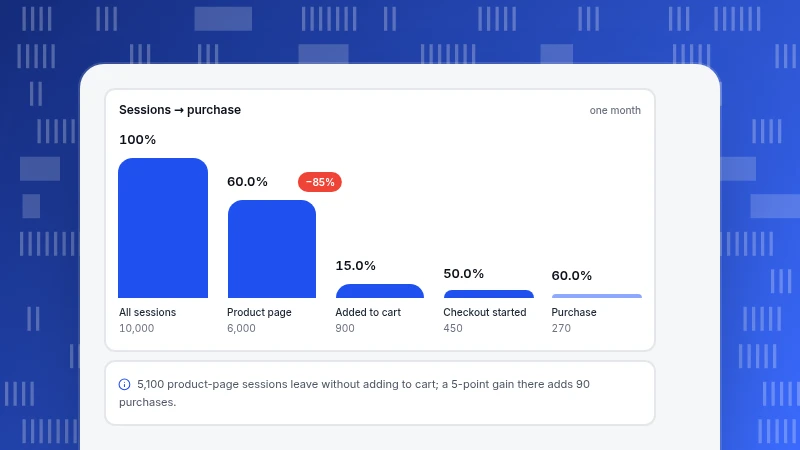
Website Optimization Tools: Five Questions, Five Kinds of Tool
Website optimization tools answer five different questions: where traffic comes from, whether pages are slow, where people give up, whether a change worked and whether search can find you. A worked funnel, experiment sizing and a minimum tool set.
Read more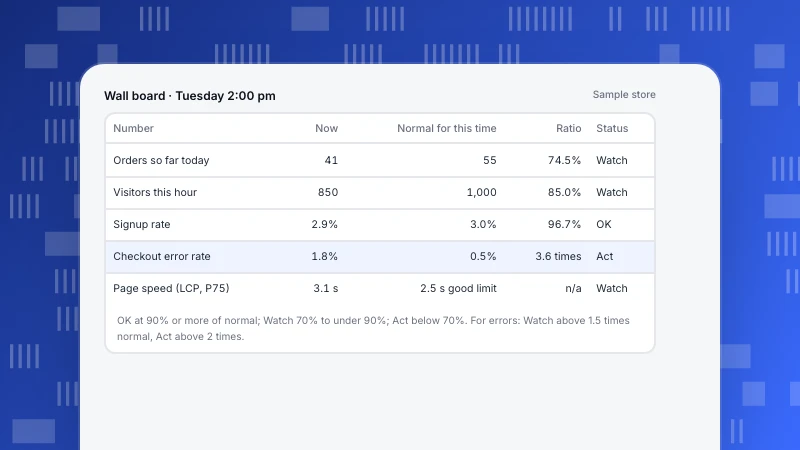
TV Dashboard: How to Design a Wall Screen People Can Read at a Glance
A TV dashboard has one job: tell anyone who looks up whether something needs attention. Five numbers, a screen layout, three-state threshold rules with a worked example, and how to keep the screen from going quietly stale.
Read more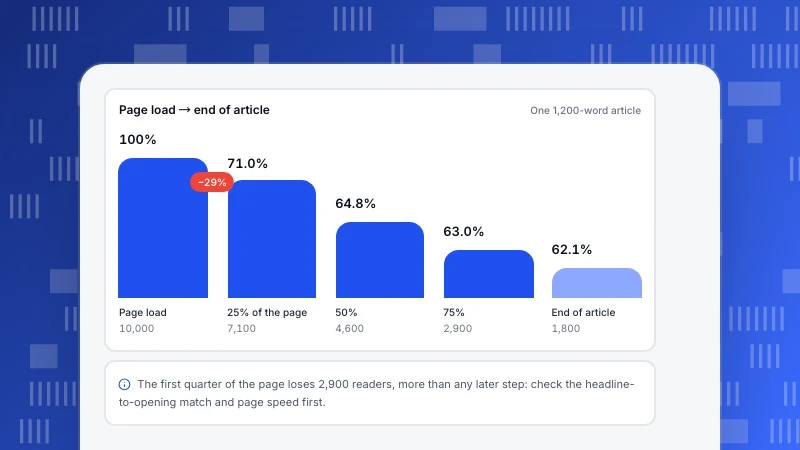
News analytics for publishers: six metrics that matter more than pageviews
News analytics here means measuring readers, not news text. Six indicators, a scroll funnel you can recompute, read-through by source and how to tell AI referrals from AI crawler reads.
Read more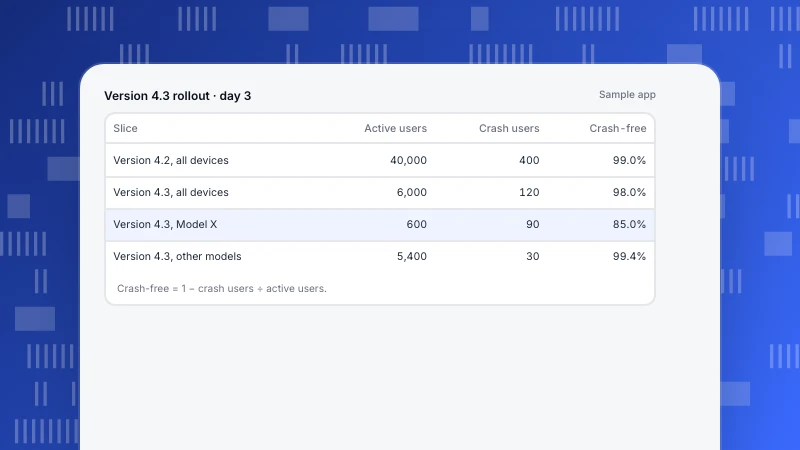
Mobile Testing Tools: Four Kinds and What Each One Tells You
Mobile testing tools answer four different questions: does it work, does it work on their devices, is it fast and stable, and what do real users hit after release. A before-and-after checklist and a worked release comparison.
Read more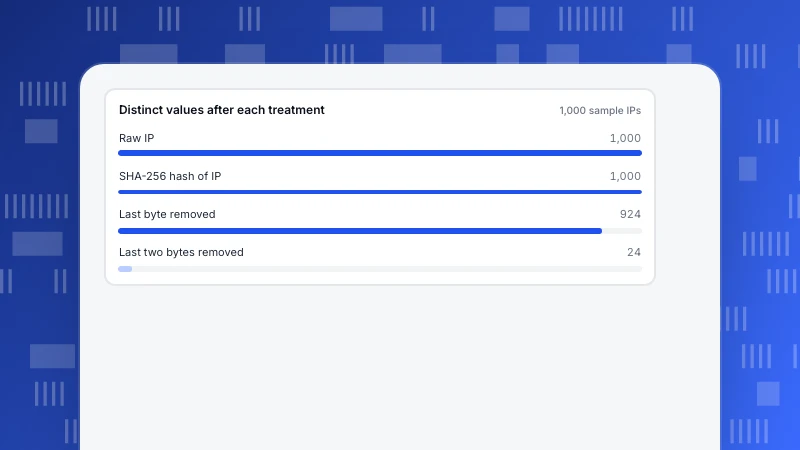
Data protection technology: the five types and how to choose
Data protection technology falls into five types: encryption, access control, masking, minimization and traceability. What each stops and does not stop, a worked hashing and truncation example, and how to choose from the threat.
Read more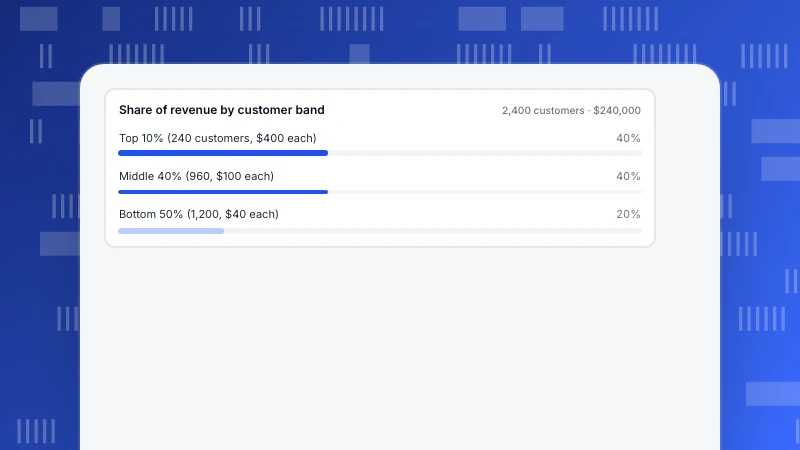
Customer analysis: start with one of four questions, not a report
Customer analysis answers one of four questions: who comes, who stays, who spends, who leaves. A five-step first pass with a recomputable example for all four and a sized decision at the end.
Read more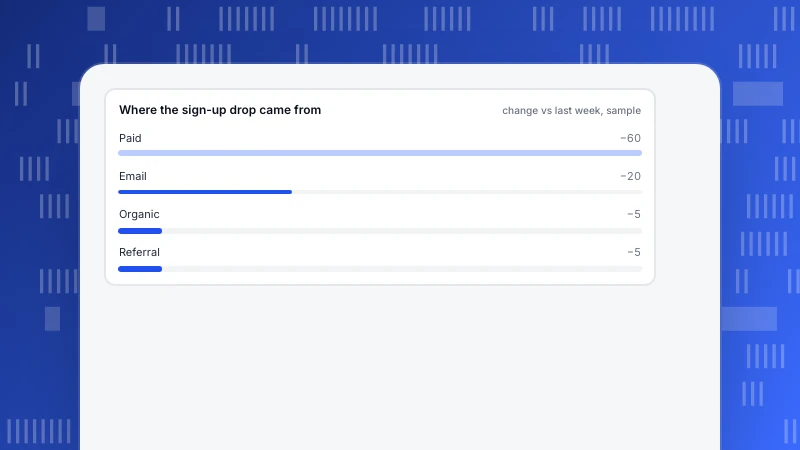
Business intelligence vs data analytics: which to start with
Business intelligence tells you what happened; data analytics asks why and what next. A comparison, five questions to decide, a sign-up drop worked both ways and the smallest setup for a small team.
Read more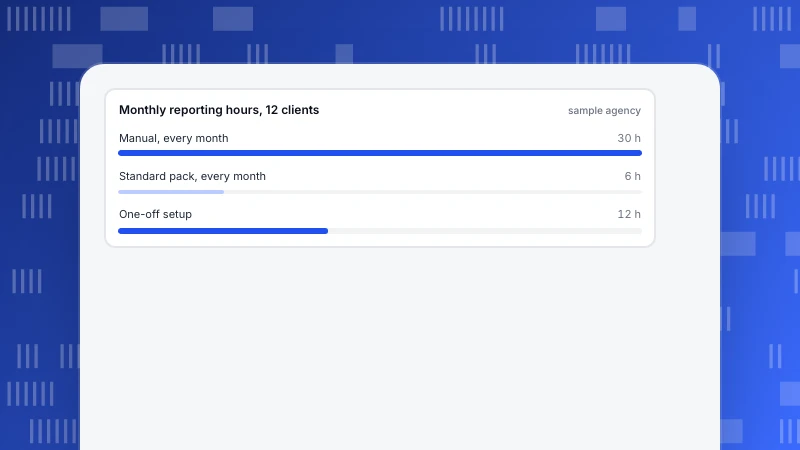
Analytics for Agencies: Structure Multi-Client Reporting That Scales
Agency analytics is less about charts than structure: separate data per client, shared metric definitions, a delivery rhythm and controlled access. Includes a metric dictionary, a time calculation for 12 clients and a permissions table.
Read more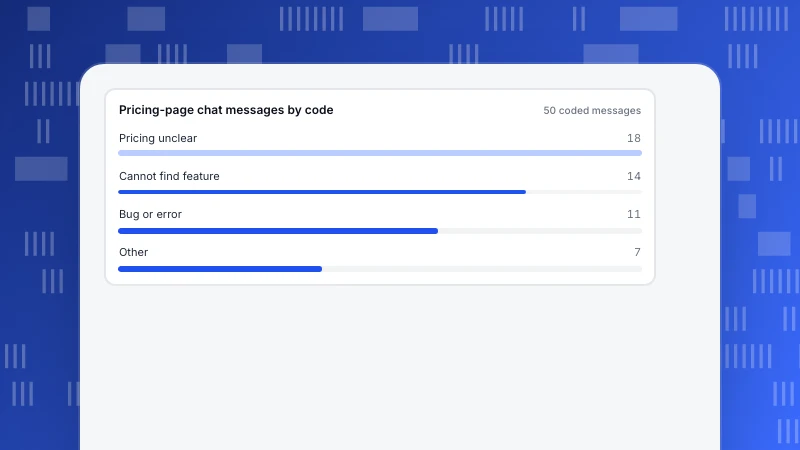
Qualitative Data Examples: 10 Sources and How to Code Them
Qualitative data is descriptive: words, categories and observations. Ten examples from product and support work, a worked coding example with counts, a reliability check, and how to pair it with funnel numbers.
Read more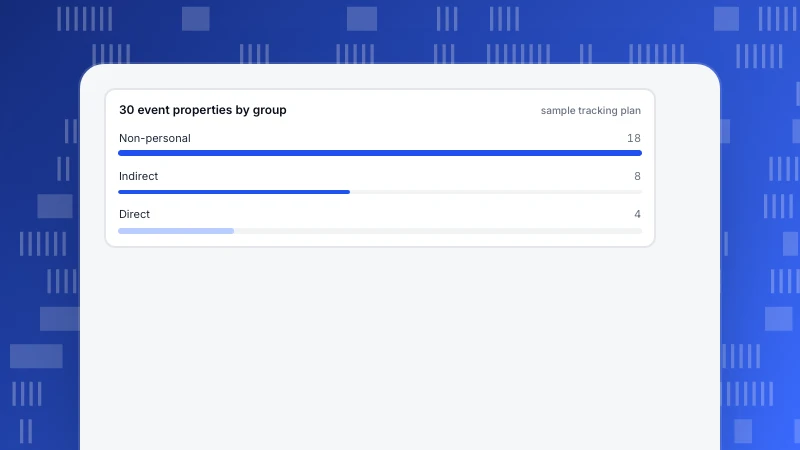
PII Examples: 20 Fields in Three Groups and What to Do With Each
Twenty concrete PII examples in three groups (direct, indirect, sensitive), which ones sneak into analytics data, a 30-property audit and a handling rule for each. Not legal advice.
Read more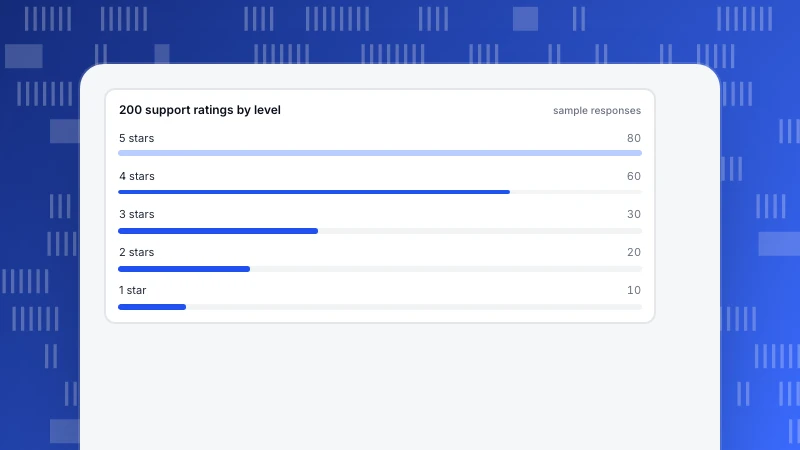
What Is Ordinal Data? 8 Examples and Which Statistic to Use
Ordinal data has an order but no known gaps. Eight product and support examples, a 200-rating worked example where the mean flips under a harmless recode while the median holds, and how to chart and report it.
Read more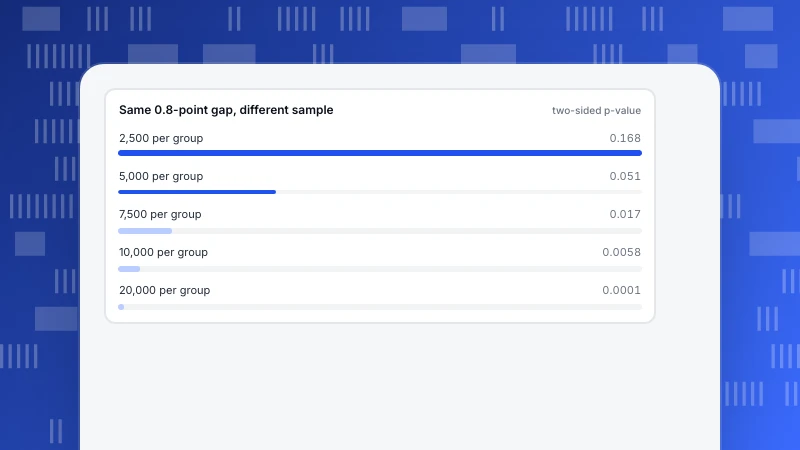
P-value meaning: how to interpret a p-value, with a worked example
A p-value is how often random variation alone would produce a gap as large as yours if there were no real difference. A 4.0% vs 4.8% worked example shows p = 0.168, why it does not mean 17% chance of no effect, and what to read next to it.
Read more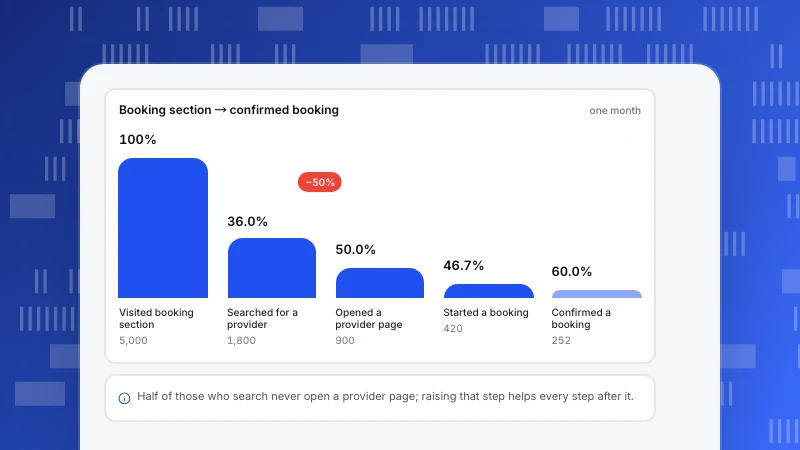
Healthcare Analytics for Websites and Apps: Four Layers, Eight Metrics
Healthcare analytics has a clinical side and an operational side. This guide covers the operational one: four analytics layers, eight metrics for a provider's site and app, a booking-funnel example and the privacy line not to cross.
Read more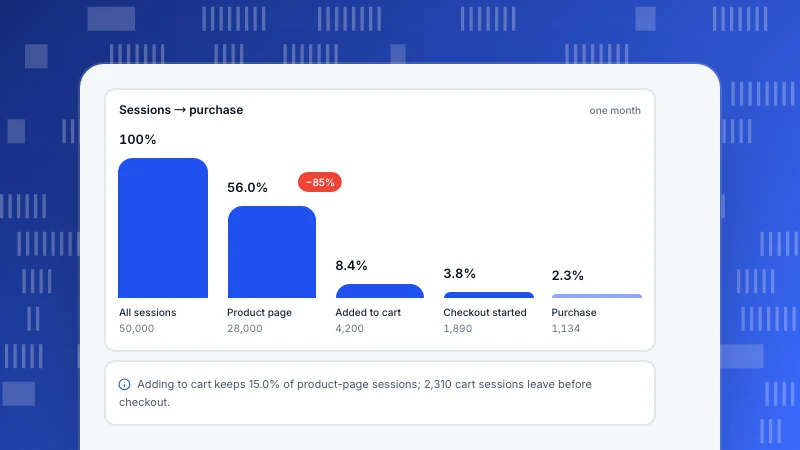
Ecommerce Analytics Tools: How to Choose by the Question You Need Answered
Ecommerce analytics tools fall into five types by the question they answer: traffic, funnel, behaviour, ad return and repeat buying. Five criteria, worked funnel and channel examples and a minimal stack for a store.
Read more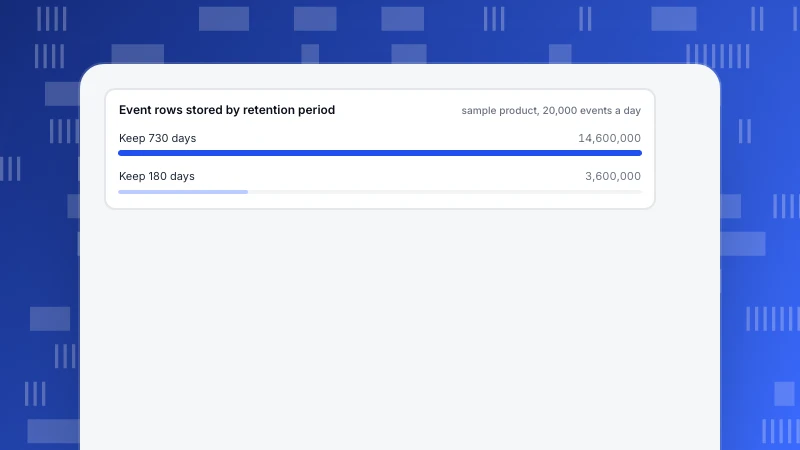
Data Protection Strategy: Six Blocks That Answer What, Who and How Long
A data protection strategy answers three questions for every dataset: what you hold, who can see it and how long you keep it. See six blocks with owners, a field-inventory example, a retention calculation and request and breach procedures.
Read more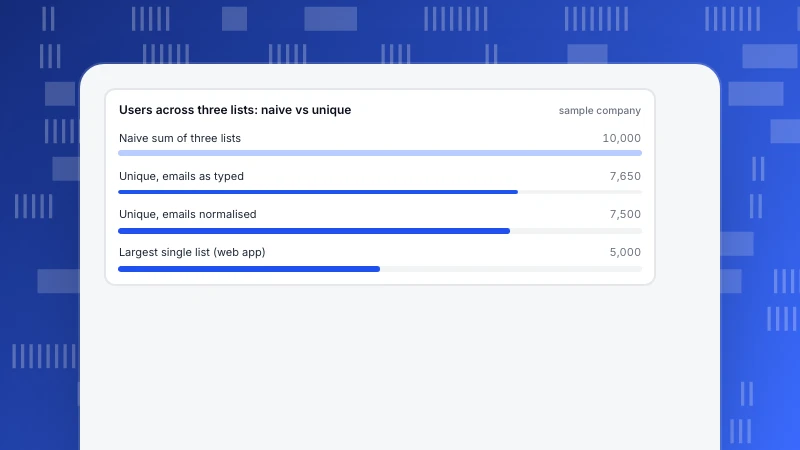
Unified Data: Four Approaches to Integration and How to Choose
Unified data means several sources read as one consistent set. Four integration approaches compared, five questions to choose between them and a worked example merging three user lists.
Read more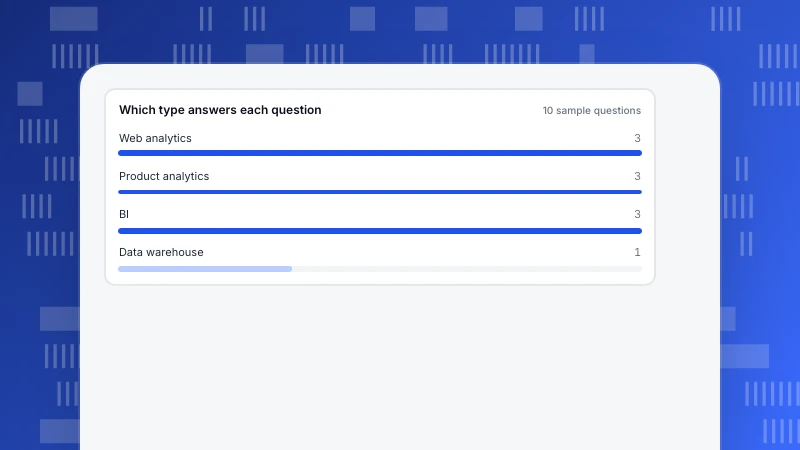
Data Analytics Platforms: Four Types and How to Choose
Data analytics platforms come in four types: web analytics, product analytics, BI and data warehouses. How to choose with six questions, a worked example, a decision table and the smallest stack that works.
Read more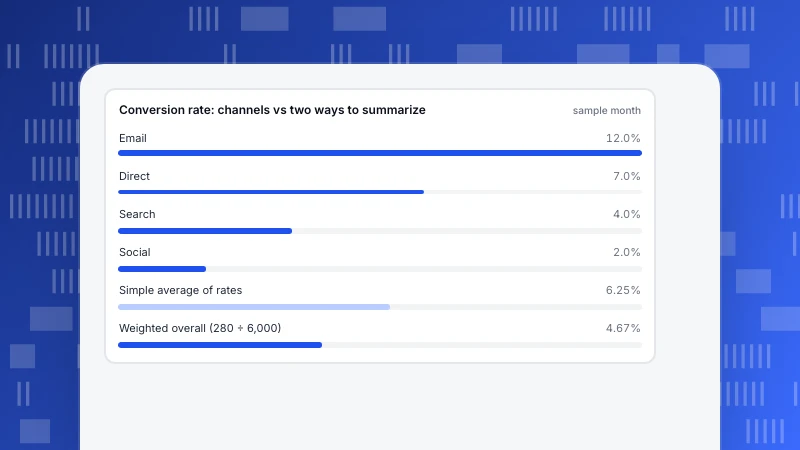
Aggregation Definition: What It Means and How It Misleads
To aggregate is to reduce many records to one value with a function such as a sum, average or count. What each function hides, and three traps: averaging ratios, Simpson's paradox and a grain that is too coarse.
Read more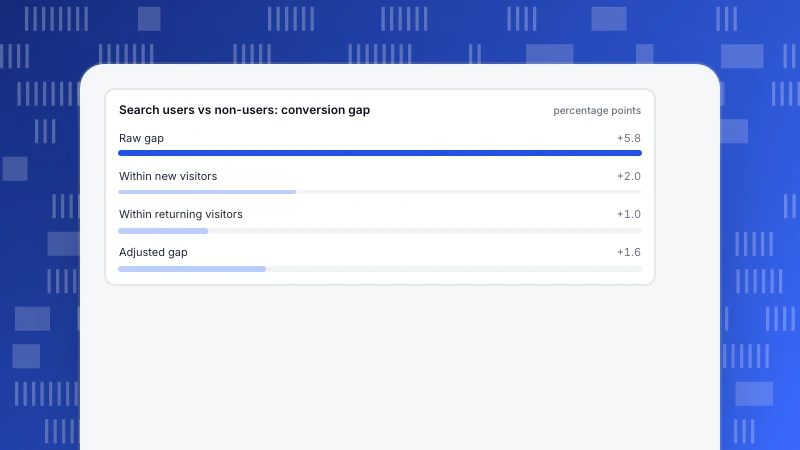
Correlation vs causation examples: 10 from product and marketing data
Ten correlation vs causation examples from product, marketing and support data, each with the likely third factor and how to test it, plus two worked examples: a 5.8-point conversion gap that shrinks to 1.6 points, and how often random metrics correlate.
Read more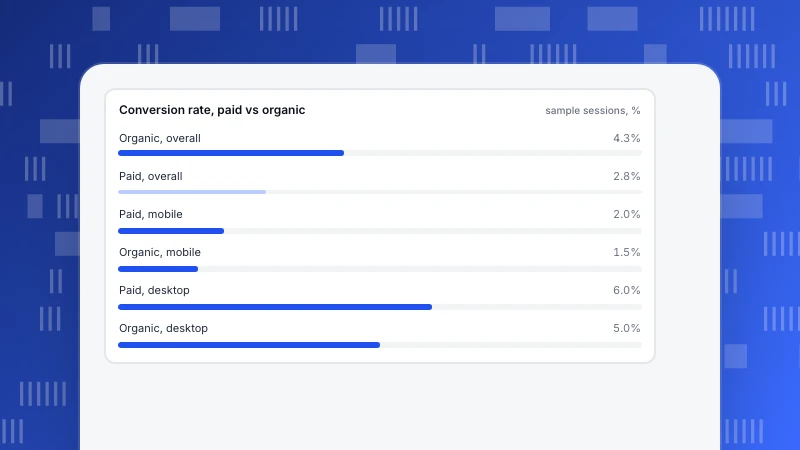
Confounding Variables: Examples and How to Spot Them in Your Data
Three recomputable examples of confounding variables from product and marketing data: a feature that seems to double retention, an email lift that mostly vanishes and a channel that wins on every device yet loses overall. Plus how to split, standardise and avoid common mistakes.
Read more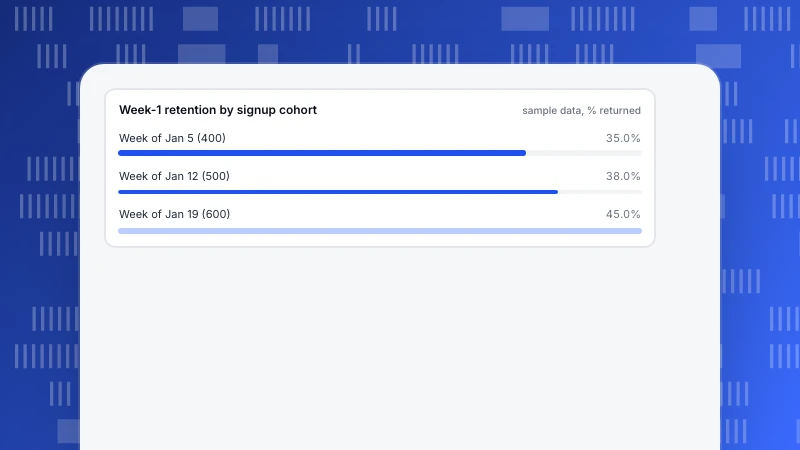
What Is a Cohort? Definition, Types and How to Read One
A cohort is a group of people who share the same starting point, such as everyone who signed up in one week. Time and behavior cohorts, three steps to define one, and a worked retention table you can recompute.
Read moreOther categories
Each category answers a recurring question we hear from customers. Start with the one closest to your job.
Growth & Marketing
Acquisition, marketing, site and app operations, and how to pick the one stage worth fixing first.
238 articlesLive Chat
Proactive invites, translation and turning support conversations into conversions.
78 articlesAI Search
GPTBot, ClaudeBot, PerplexityBot: who fetches your pages, what the files say and what comes back.
39 articlesProduct News
What shipped, why we built it that way, and how to turn it on.
64 articles