Analytics · Page 6
How metrics are defined, where numbers disagree, and how to read a funnel or a retention curve without fooling yourself.
This category covers the mechanics of measurement: what a visitor is, why sessions differ between tools, how to build a funnel that survives scrutiny, and how to spot bot traffic before it skews a decision. Every article uses the same sample dataset you see in the product, so you can reproduce the reasoning in your own workspace.
Articles in Analytics
304 articles · page 6 of 7
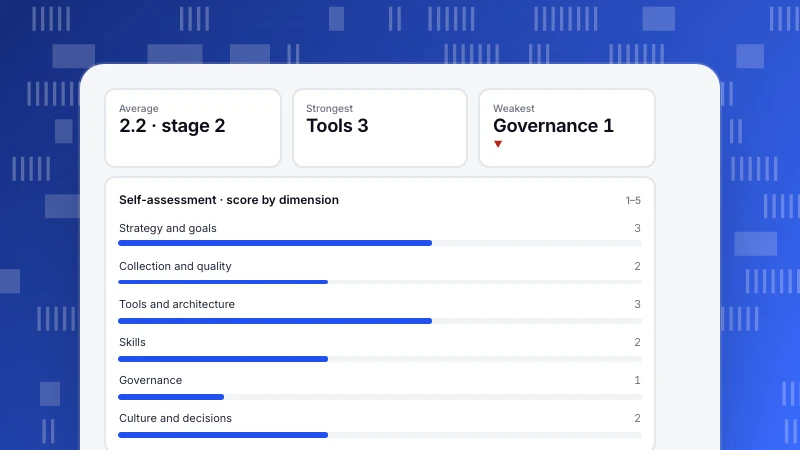
Data maturity model: five stages, a self-assessment and what to fix first
A data maturity model shows how organizations progress from ad hoc spreadsheets to data embedded in decisions. Five stages, six dimensions to score, a worked self-assessment where tools outran governance, and the questions to ask.
Read more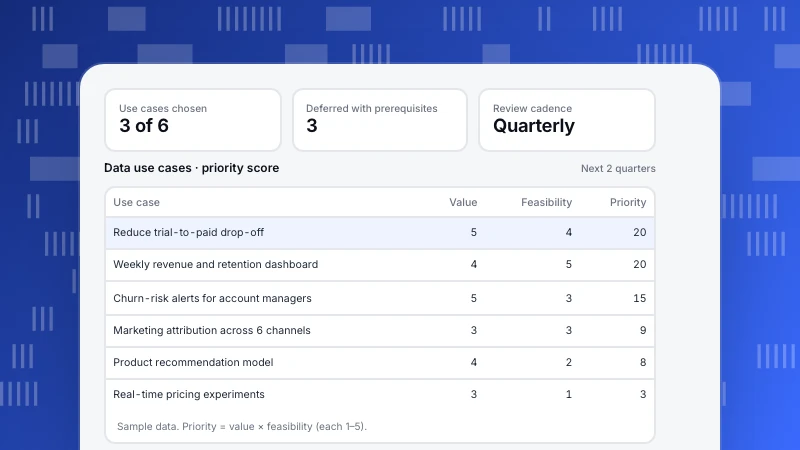
Data strategy: components, a worked example and a one-page plan
A data strategy links business goals to how data is collected, governed and used. Offense vs defense, the seven components, a worked example scoring six use cases into a 90-day plan, five steps to write one and the mistakes that stall it.
Read more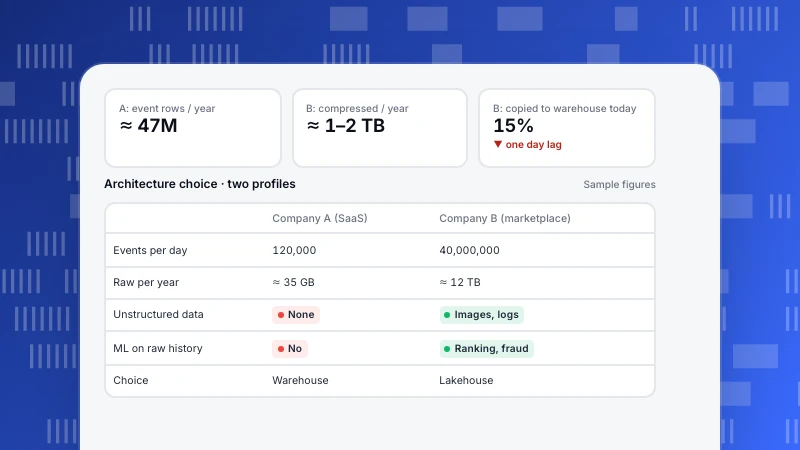
Data lakehouse vs data warehouse (and data lake): how to choose
A warehouse stores modeled tables for SQL, a lake stores raw files cheaply, and a lakehouse adds warehouse features to lake storage. A three-way comparison, why lakehouses appeared, two worked company examples and a decision checklist.
Read more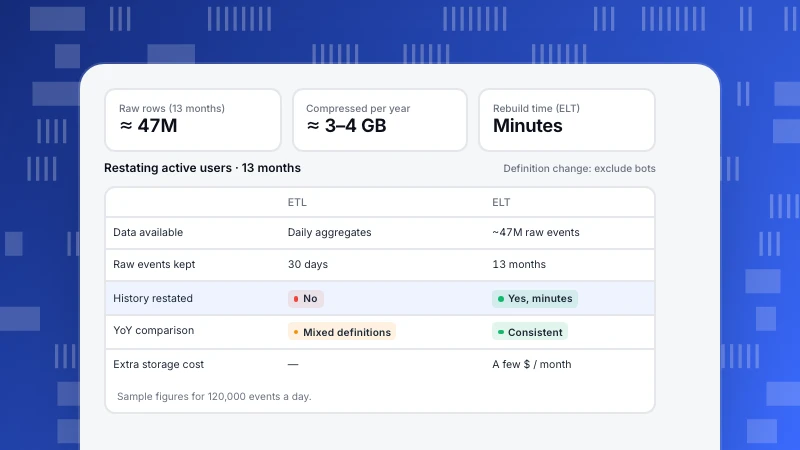
ETL vs ELT: differences, a worked example and how to choose
ETL transforms data before loading; ELT loads raw data and transforms it in the warehouse. A comparison table, a worked example of restating a metric after its definition changes, the privacy catch, EtLT, reverse ETL and a decision checklist.
Read more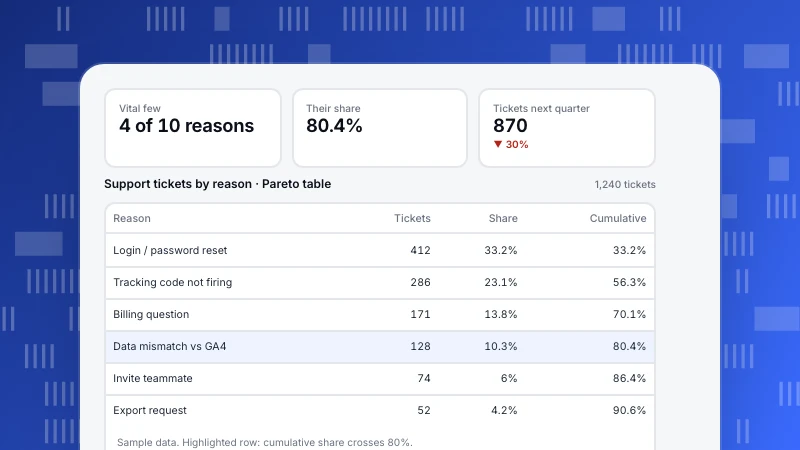
Pareto analysis: how to find the 20% that drives 80% of results
Pareto analysis finds the few causes behind most of an effect. The 8 steps, a support-ticket example where 4 of 10 reasons caused 80% of tickets, a traffic concentration example, analytics use cases and the mistakes that make the 80/20 rule misleading.
Read more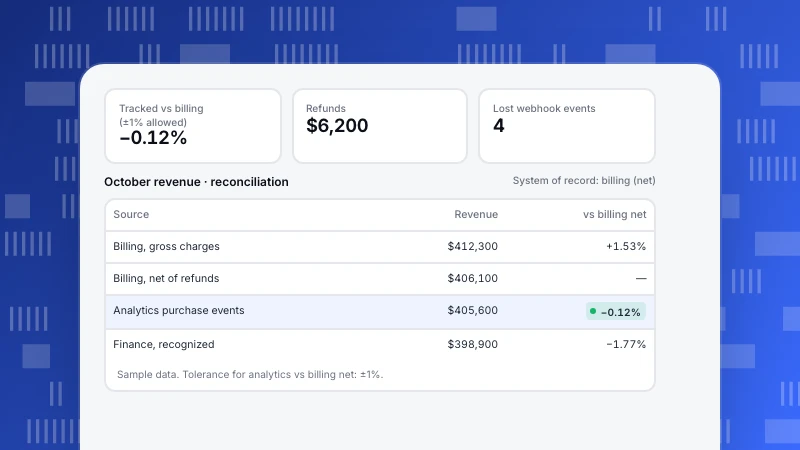
Single source of truth for analytics: definitions, owners and reconciliation
A single source of truth means one agreed value and definition for each important metric. Source vs version of truth, why numbers disagree, a worked example reconciling four October revenue figures, and the steps to make it stick.
Read more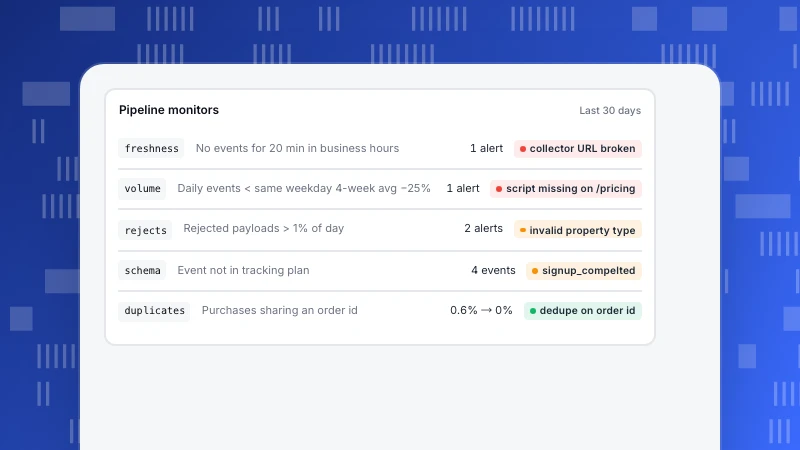
What is a data pipeline? Stages, types and an analytics example
A data pipeline moves data from where it is created to where it is used. The six stages and how each one fails, batch vs streaming, ETL vs ELT, and a worked event-pipeline example with duplicates, late data and the monitors that catch them.
Read more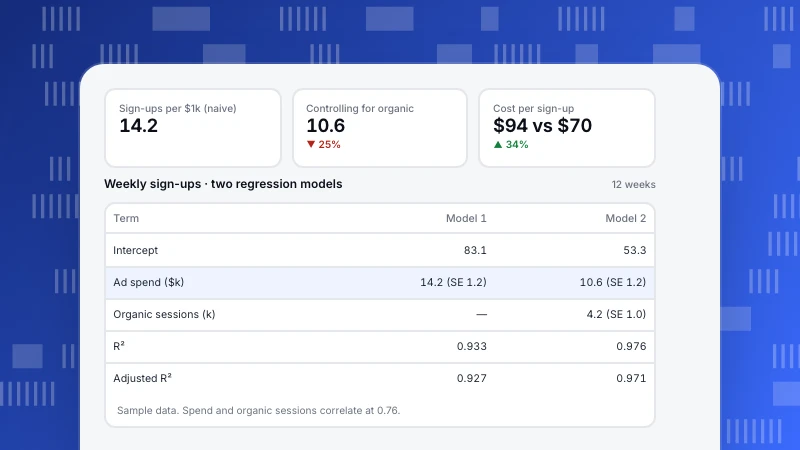
Regression analysis for marketers and analysts: a worked example
Regression analysis estimates how an outcome changes with its drivers. A 12-week example shows how leaving out organic traffic inflated the value of ad spend by a third, plus how to read output, check assumptions and avoid common mistakes.
Read more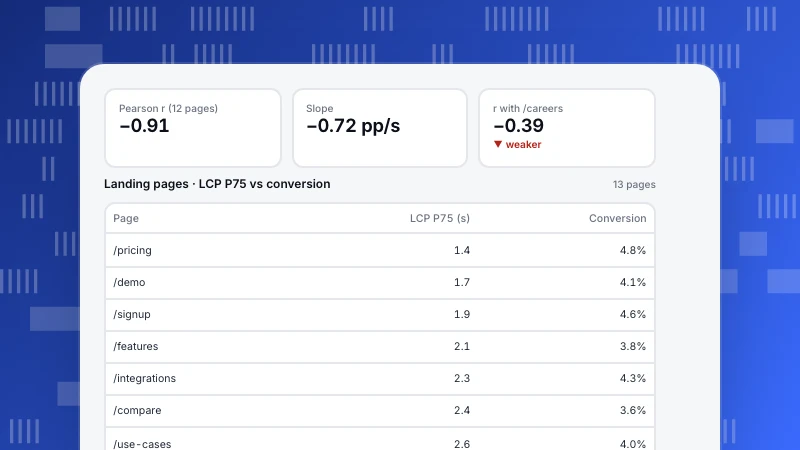
Scatter plots: how to read them, make them and avoid false conclusions
A scatter plot shows how two numeric variables move together. How to read direction, form, strength, outliers and clusters, with a page-speed vs conversion example where one outlier flips the conclusion.
Read more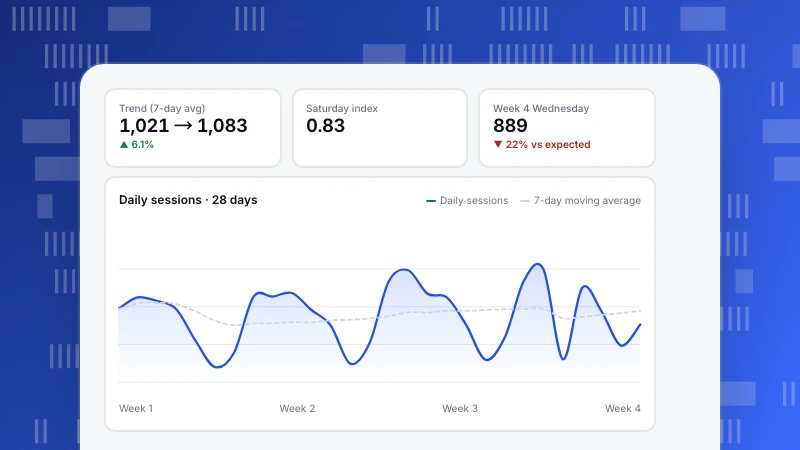
Time series analysis for web analytics: trend, seasonality and anomalies
Time series analysis separates trend, seasonality and noise so you can tell a real change from a Monday. A 4-week worked example, the core techniques, forecasting baselines and the mistakes that mislead dashboards.
Read more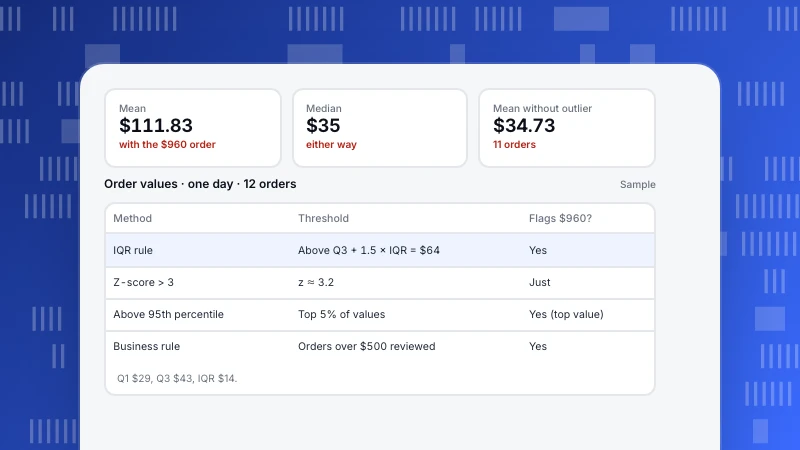
Outliers in Data: How to Find Them and What to Do With Them
An outlier is a value far from the rest of the data. How to find outliers with the IQR rule, z-scores and percentiles, a worked example with 12 orders, and how to decide whether an outlier is an error to remove or a real value to report.
Read more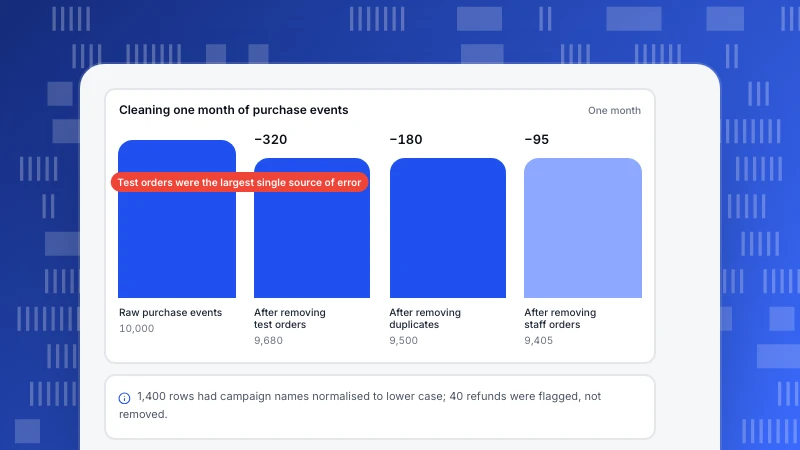
Data Cleaning Techniques for Analytics Data, With a Worked Example
Data cleaning removes or fixes the records that make reports wrong: duplicates, bots, test and internal traffic, inconsistent labels, wrong time zones and outliers. Eight techniques for web and product data, and a worked cleanup of a month of orders.
Read more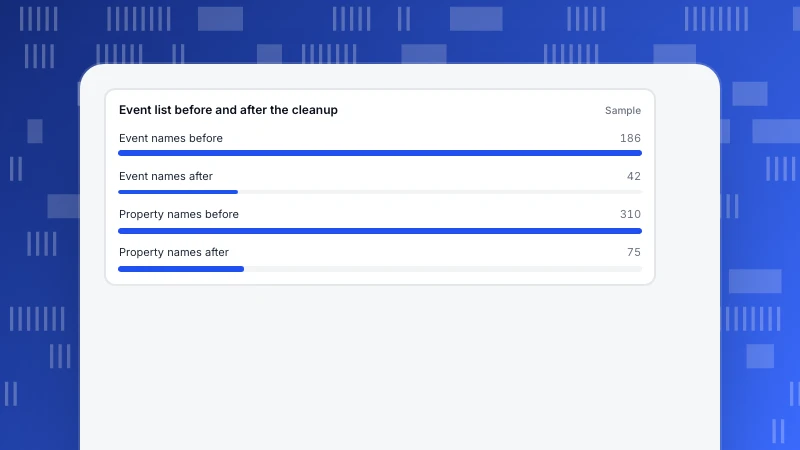
Data Taxonomy for Analytics: Naming Rules and a Cleanup Example
A data taxonomy is the agreed structure and naming of your events, properties and values, so everyone counts the same thing the same way. The four layers, naming rules with examples, a worked cleanup from 186 event names to 42, and how to keep it from drifting.
Read more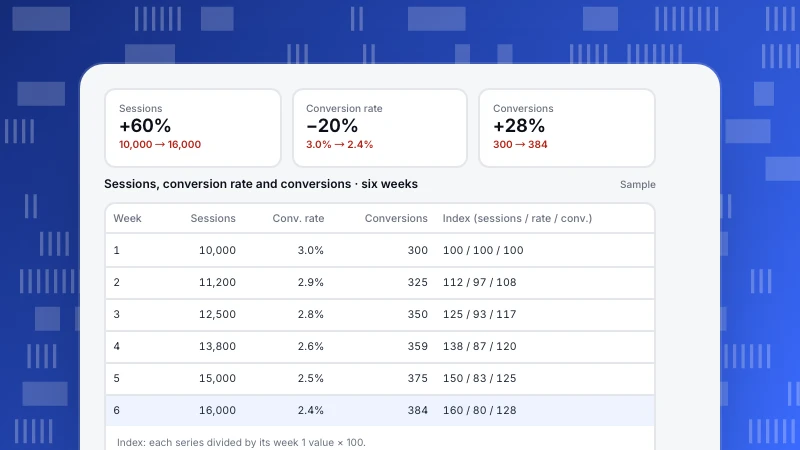
Dual Axis Charts: When They Mislead and What to Use Instead
A dual-axis chart puts two measures with different units on one chart, each with its own y-axis. The axis ranges are arbitrary, so the chart can show crossings and correlations that mean nothing. When it is acceptable, and four clearer alternatives with the same data.
Read more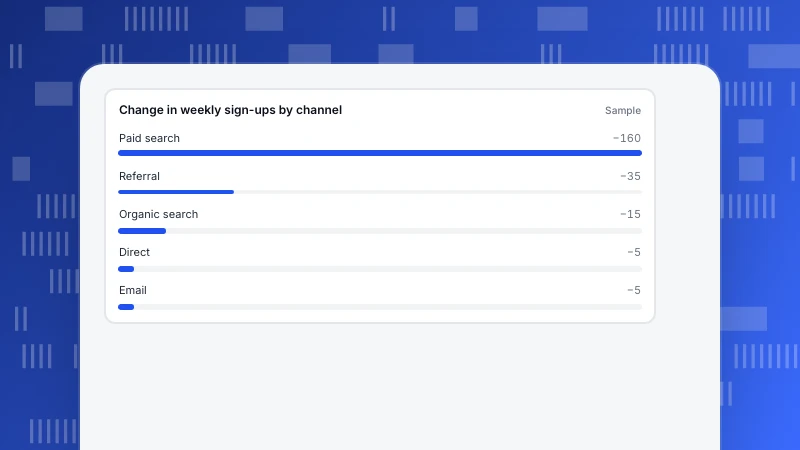
How to Analyze Data: 6 Steps and a Worked Example
A practical six-step way to analyze data: start from a question, pick the metric, check the data, break the change down, test the explanation and act. With a worked example of a 220 sign-up drop traced to one channel.
Read more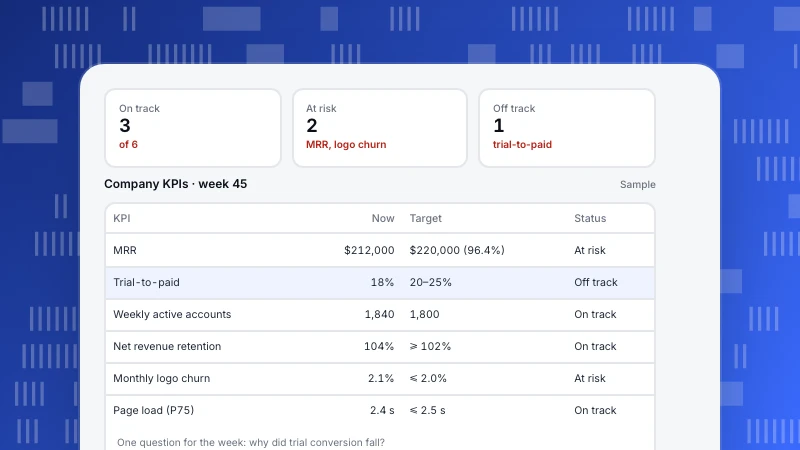
KPI Dashboard: How to Design One People Actually Use
A KPI dashboard shows a handful of key numbers, each with a target and a status, so anyone can see in a minute what is on track. Eight design rules, a sample company dashboard, and how to build one in six steps.
Read more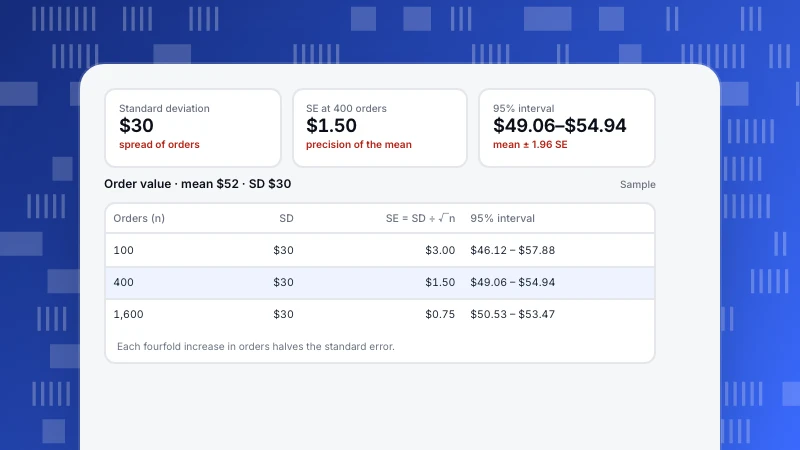
Standard Deviation vs Standard Error: The Difference, With Examples
Standard deviation describes how spread out your data is; standard error describes how precise your average is. The formulas, a worked example at three sample sizes, the conversion-rate version and the mistakes to avoid.
Read more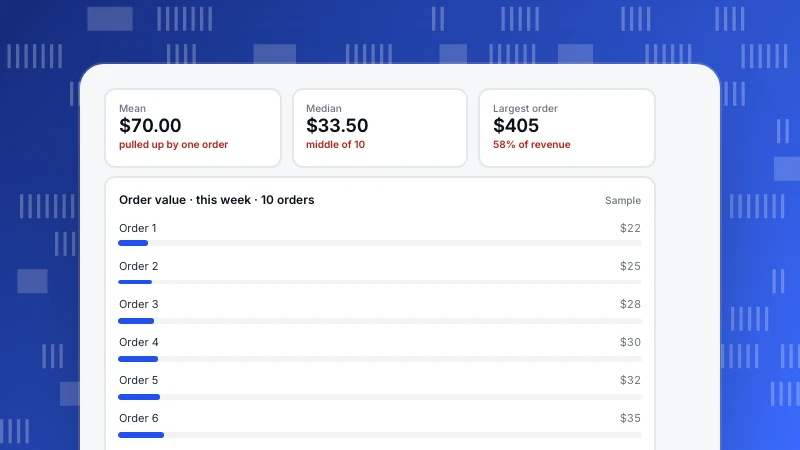
Mean vs Median: Which Average to Use for Your Metrics
The mean adds everything up and divides; the median is the middle value. A worked example where one large order doubles average order value, when to use each, and which analytics metrics should be read as medians.
Read more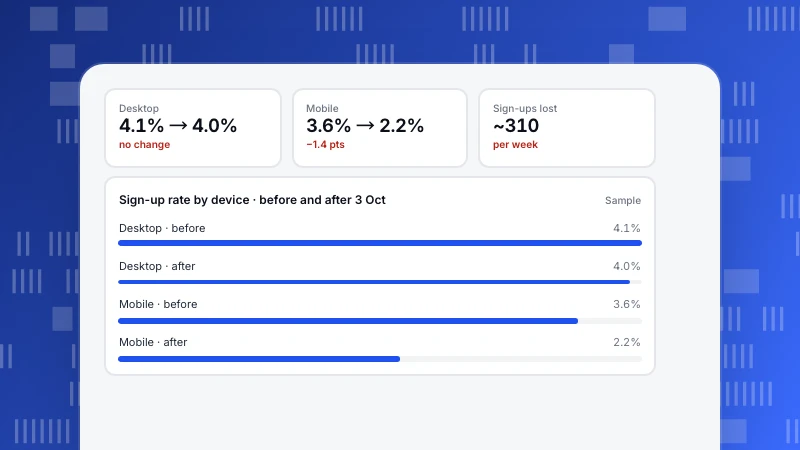
Data Storytelling: A Five-Part Structure, With a Before and After
Data storytelling turns an analysis into a decision someone can act on. A five-part structure for reports and presentations, the same analysis told badly and well, chart-choice rules and how to keep the story honest.
Read more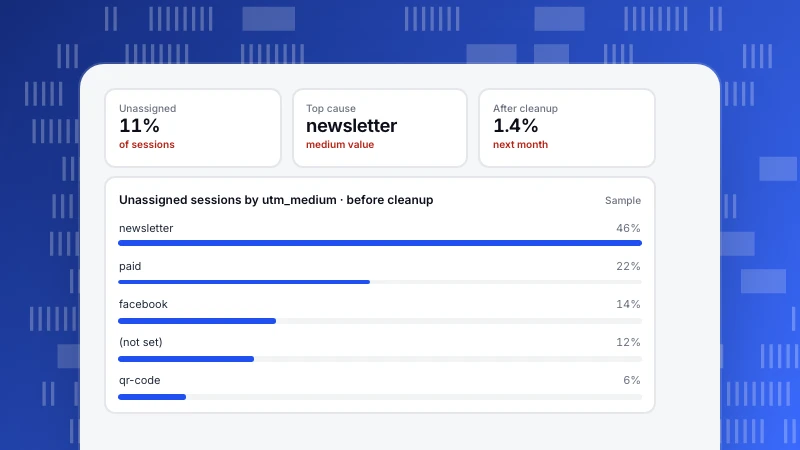
Unassigned Traffic in GA4: What It Means and How to Fix It
Unassigned is the GA4 channel for sessions that match no channel rule. The usual causes, how to find which applies, a table of medium values to rename, a sample cleanup and a naming standard to prevent it.
Read more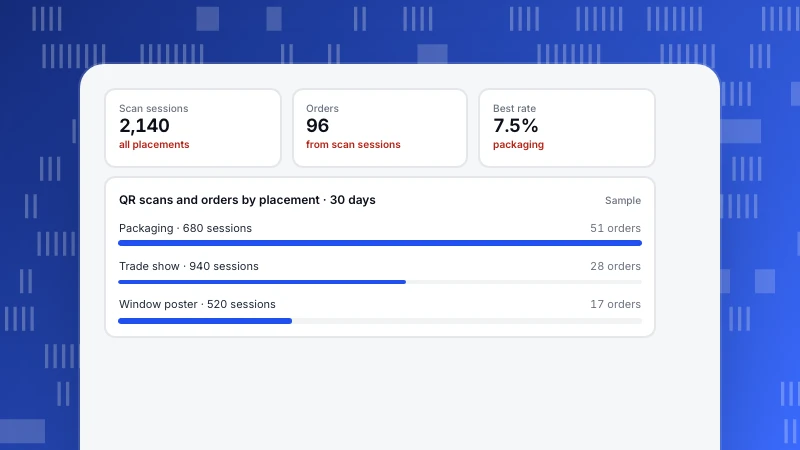
How to Track QR Code Scans, From Scan to Sale
How to track QR code scans end to end: tag the link with UTM parameters per placement, read scans as sessions in analytics, and follow them through to sign-ups and sales. With a sample of three placements.
Read more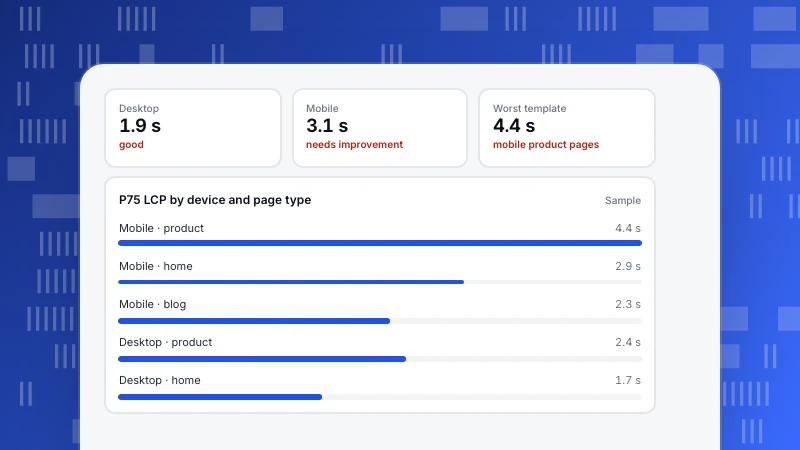
What Is a Good Page Load Time? A Clear Target and How to Check It
A good page load time is when the main content appears within 2.5 seconds for three in four real visits. Why full load time misleads, targets for each timing, and a sample split by device and page type.
Read more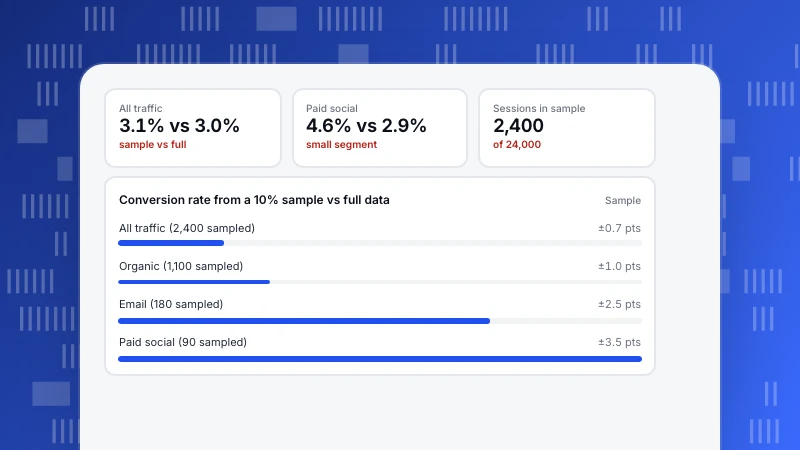
Data Sampling in Analytics: When It Is Fine and When It Misleads
Data sampling means reading a subset to estimate the whole. The main sampling methods, where analytics tools sample, how small segments and rare events go wrong, and rules for trusting sampled numbers.
Read more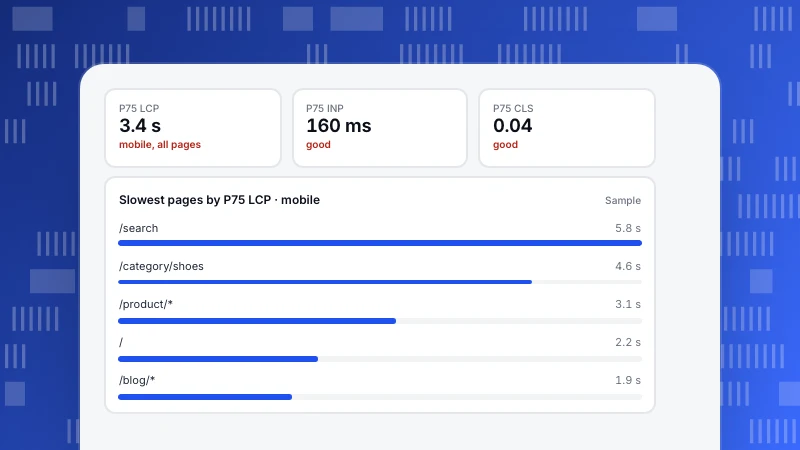
Website Performance Metrics: The Five to Watch and How to Read Them
The website performance metrics that matter: LCP, INP, CLS, FCP and TTFB, their thresholds, why to read the 75th percentile from real users, and a sample that traces a slow page to its cause.
Read more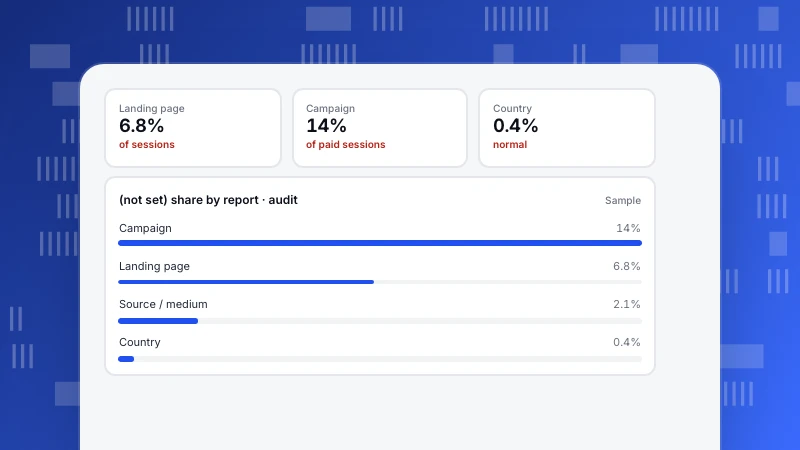
What Is (not set) in Google Analytics? Causes and Fixes by Report
(not set) is the placeholder Google Analytics shows when a value is missing for a dimension. Where it appears, the usual cause in each report, how much is normal and how to reduce it.
Read more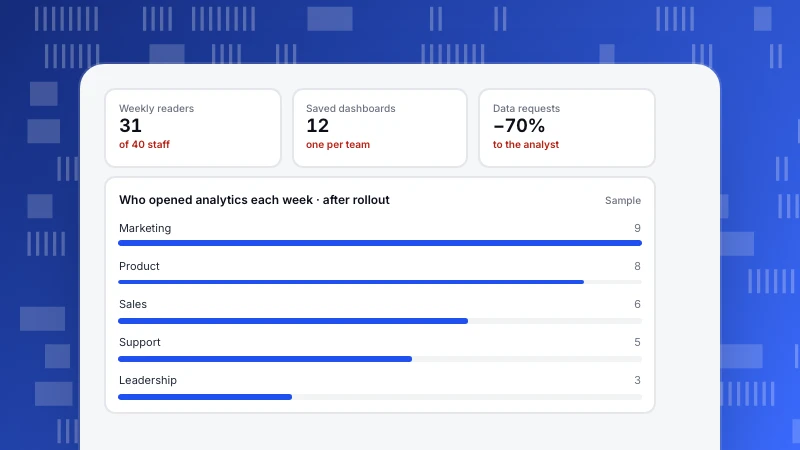
Data Democratization: Give Everyone Data Without Losing Trust
Data democratization means anyone who needs data can get it and read it the same way. What it is, five practical steps from shared definitions to read-only links, a sample role setup, and the risks to manage.
Read more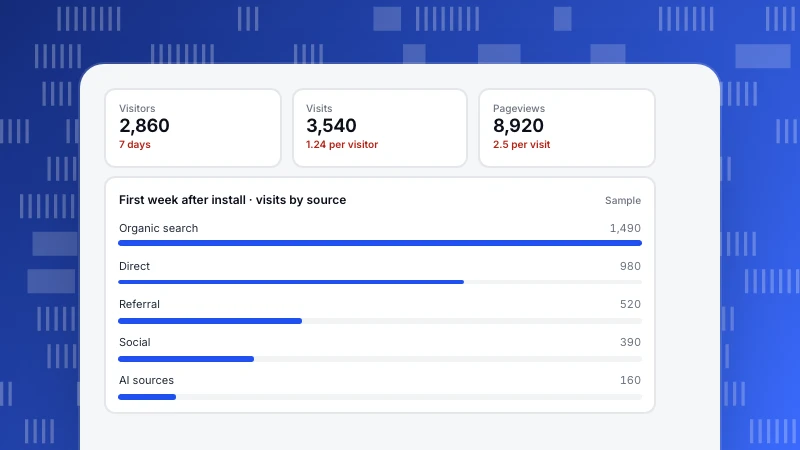
How to Check Website Traffic: Your Own Site and Anyone Else's
How to check traffic on your own website with analytics, which five numbers to read first, how estimates for other sites work and how far to trust them, and why tools never agree.
Read more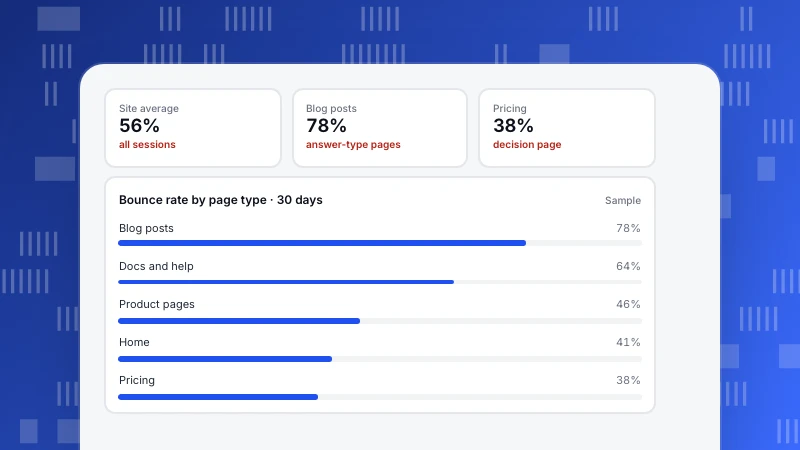
What Is a Good Bounce Rate? Judge It by Page Type, Not One Number
There is no single good bounce rate. What bounce rate measures, why a site-wide average misleads, a sample by page type, when a high rate is a real problem, and how to set your own target.
Read more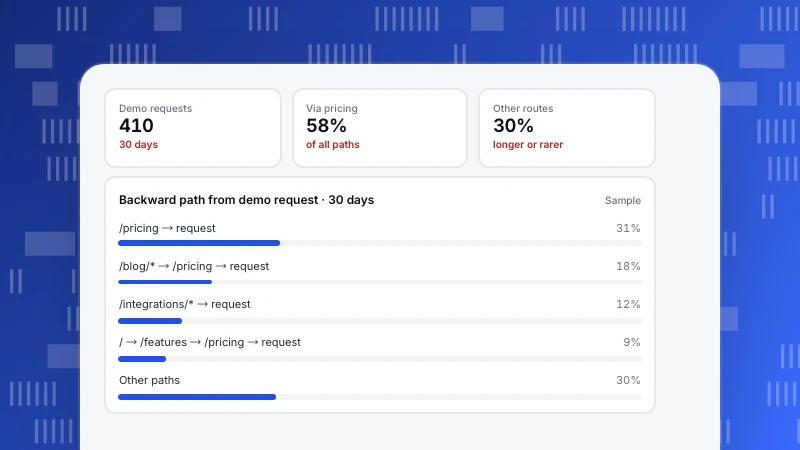
Conversion Paths: Design Them, Then Read the Ones People Actually Take
A conversion path is the route from a first click to a completed goal. The four parts of a designed path with one metric each, and how to read the real paths backward from the goal to find the pages that feed it.
Read more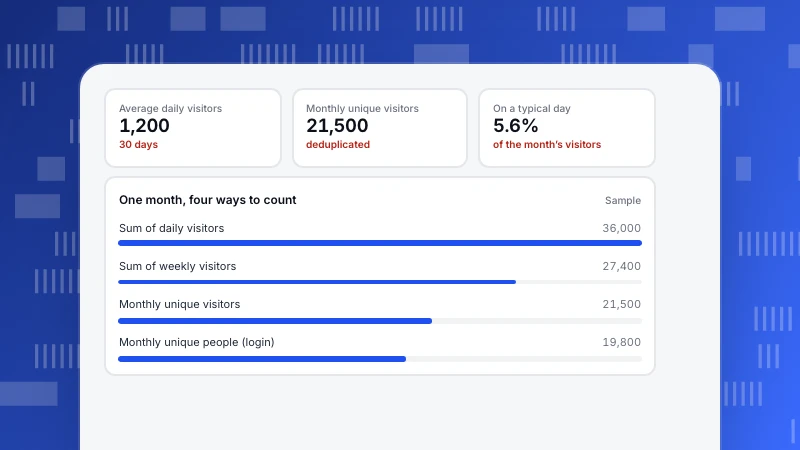
Monthly Unique Visitors: How They Are Counted, and Which Number to Quote
Monthly unique visitors are the distinct people (in practice, browsers or devices) who visited at least once in a month. Why summing days overstates it, how the counting method changes it, and how to report it.
Read more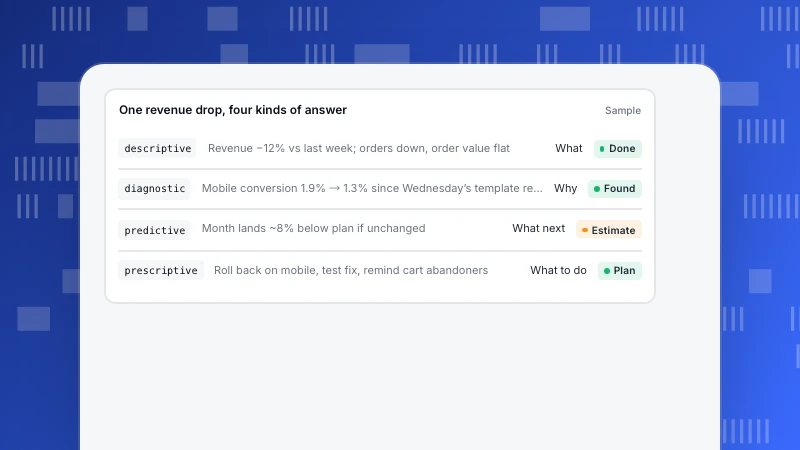
The 4 Types of Data Analytics, Followed Through One Real Question
Descriptive analytics says what happened, diagnostic why, predictive what will happen, and prescriptive what to do. One store’s revenue drop followed through all four, with the method and data each step needs.
Read more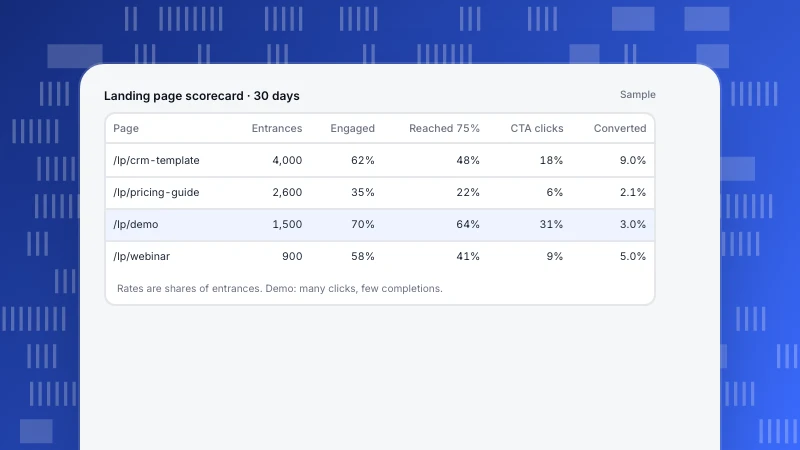
Landing Page Analytics: A Six-Metric Scorecard That Shows Where Visitors Drop
Landing page analytics should tell you where on the page visitors are lost, not just how many converted. Six metrics in page order, a sample scorecard of four pages, and the patterns that point at the fix.
Read more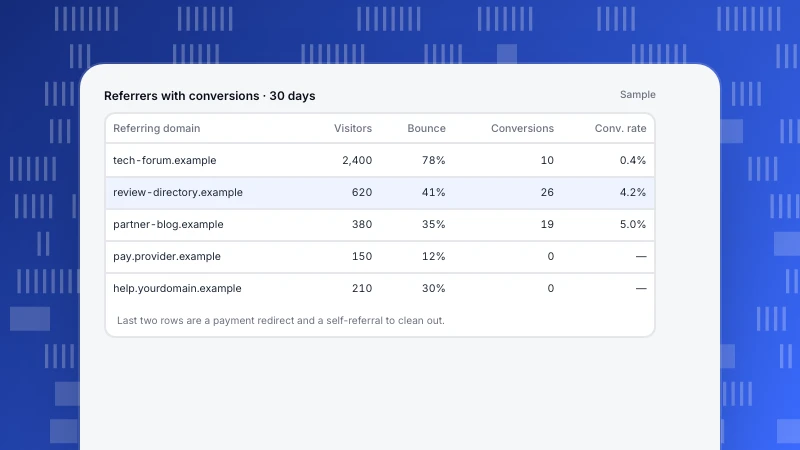
Referral Traffic: What It Is, What Isn’t, and How to Judge It
Referral traffic is visits that arrive by a link on another website. How analytics decides a visit is a referral, the referrers that are not real referrals, and how to judge referring sites by what their visitors do.
Read more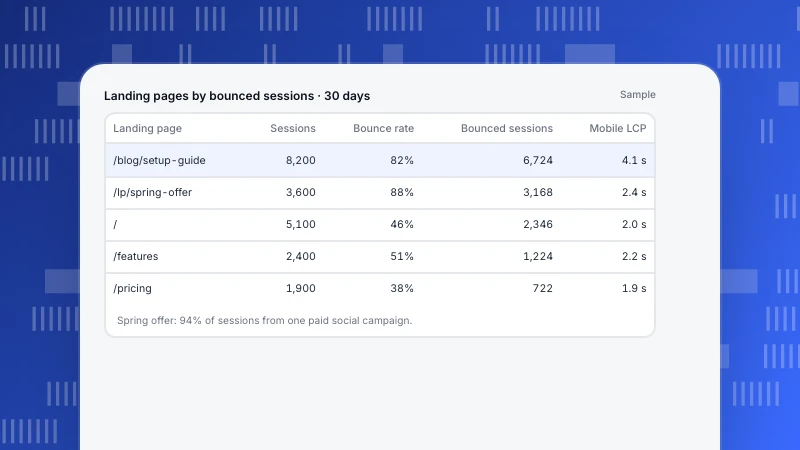
How to Reduce Bounce Rate: Find the Pages That Matter, Then Fix the Cause
Reducing bounce rate starts with knowing what your tool counts as a bounce and which pages lose the most visitors. How to rank landing pages, diagnose the cause by source and device, and apply the fix that matches it.
Read more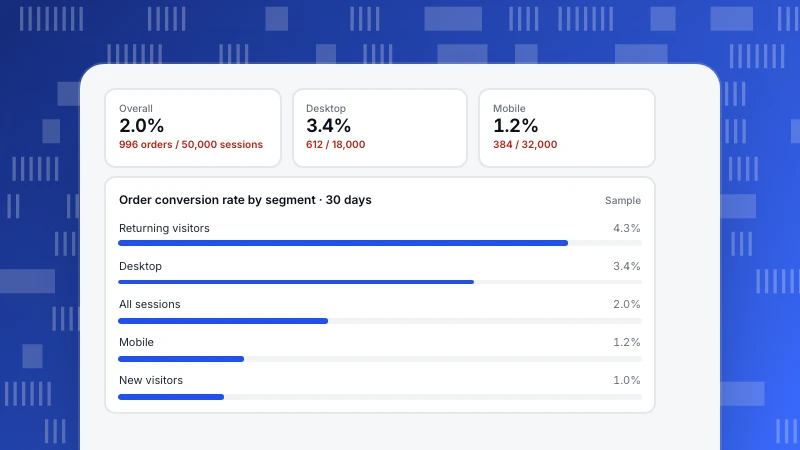
What Is a Good Conversion Rate? How to Judge Yours
A good conversion rate depends on what you count as a conversion, what you divide by, and who your visitors are. Rough ranges by conversion type, the two denominators that change the number, and how to judge your own rate by splitting it.
Read more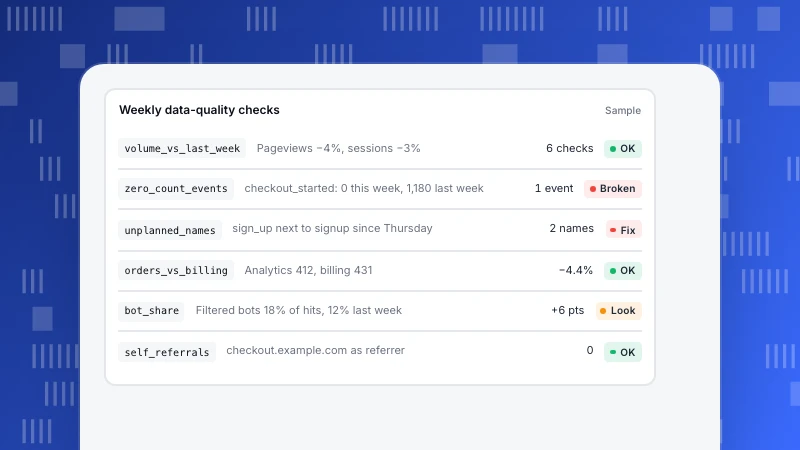
What Is Data Quality? The Six Dimensions, Applied to Analytics Data
Data quality is how far data can be trusted for the decision you want to make. The six dimensions (accuracy, completeness, consistency, timeliness, validity and uniqueness) with the analytics failure each one catches and a weekly check list.
Read more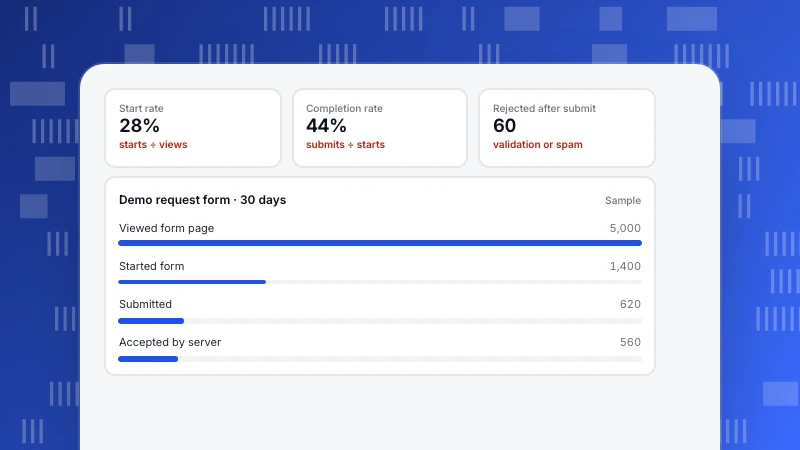
Form Analytics: Measure Where Forms Lose People, Without Recording What They Type
Form analytics shows how many people see a form, start it, submit it and get through. The metrics for each step, how to track starts and validation errors without capturing field values, and what to fix first.
Read more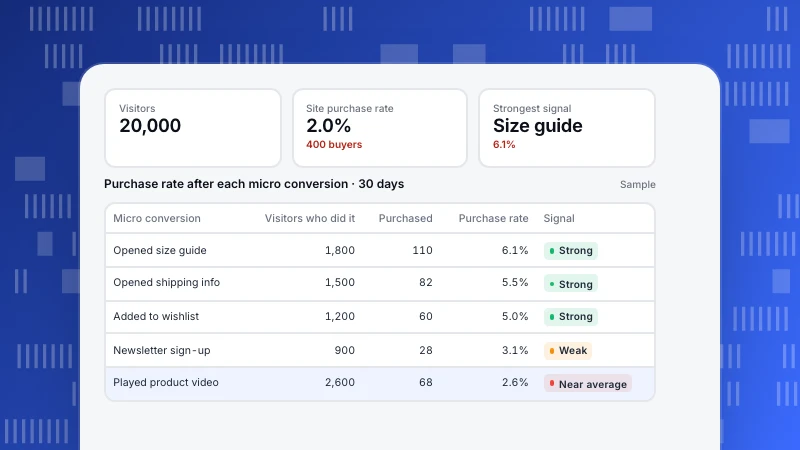
Micro Conversions: How to Pick the Ones That Actually Predict Sales
Micro conversions are small actions on the way to a purchase or lead. They help only if they predict the main conversion. How to pick candidates, test each one against your sales data, track the keepers as goals, and avoid reporting them as success.
Read more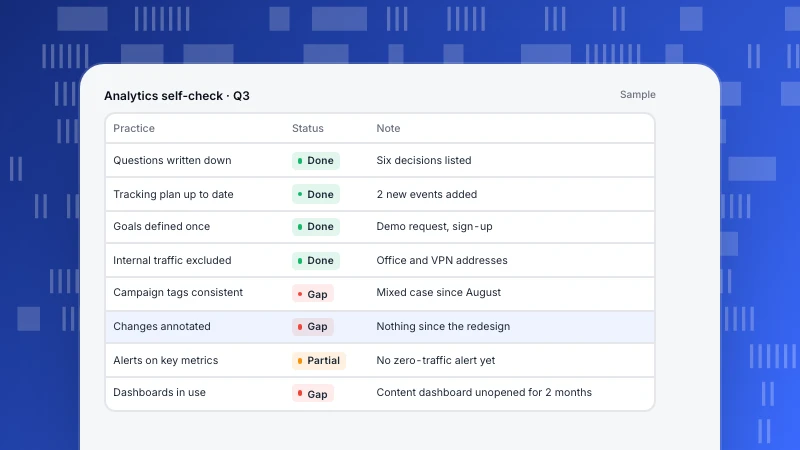
Web Analytics Best Practices: 12 Habits That Keep Data Trustworthy
Twelve web analytics best practices in four groups, plan, collect, read and act, each with a quick way to check you are following it. The habits that keep numbers trustworthy and make sure someone actually uses them.
Read more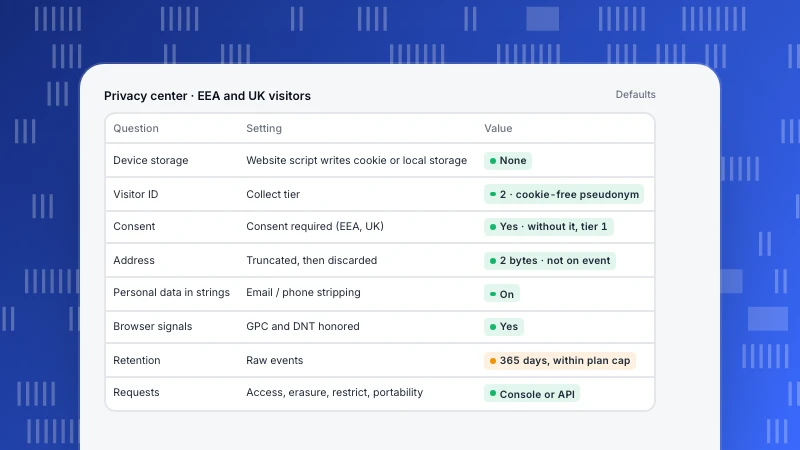
GDPR-Compliant Analytics: A Checklist for Choosing and Setting Up a Tool
No analytics tool is GDPR compliant by itself; compliance depends on what you collect and how you set it up. A checklist of what to check in any tool, tied to the regulation text, with the matching settings in TapCub.
Read more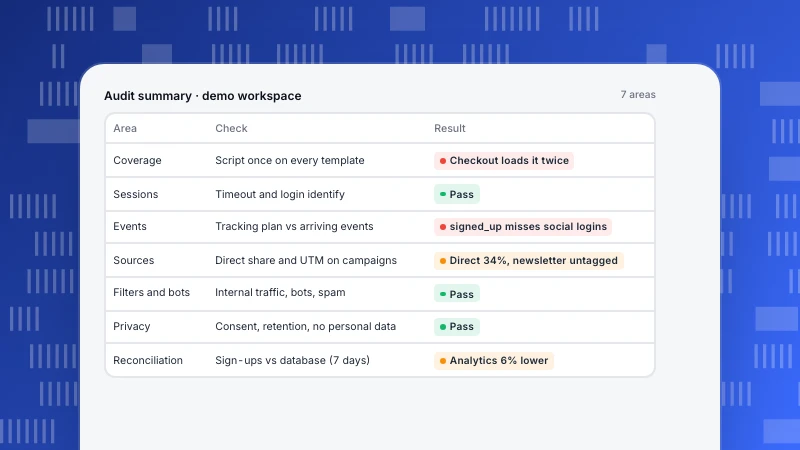
Web Analytics Audit: A Checklist in Seven Areas
A web analytics audit in seven areas: coverage, sessions and identity, events, sources, filters and bots, privacy, and reconciliation with your backend. A concrete check for each, how to run it, and how to keep it healthy afterwards.
Read more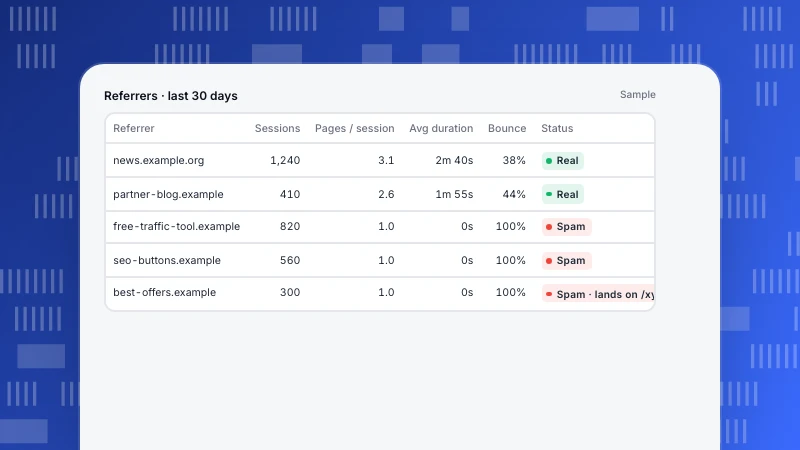
Referral Spam: Three Kinds, How to Spot Each, and Where to Stop It
Referral spam comes in three kinds: ghost hits that never touch your site, crawler visits and scripted browser visits. The report signals for each and the fix that belongs at each layer, from collection allowlists to filters.
Read more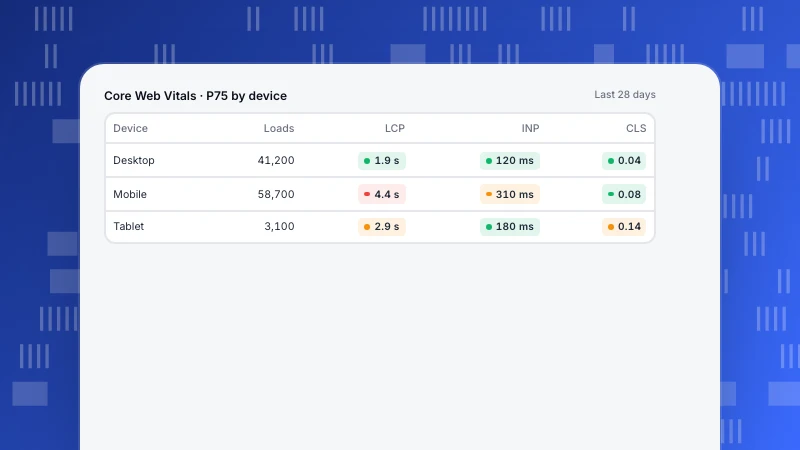
Real User Monitoring: How to Read Speed Data from Real Visits
Real user monitoring (RUM) measures speed in visitors' own browsers. How it differs from synthetic tests, why P75 by device is the default view, how small samples mislead, and how to turn a slow segment into a fix.
Read more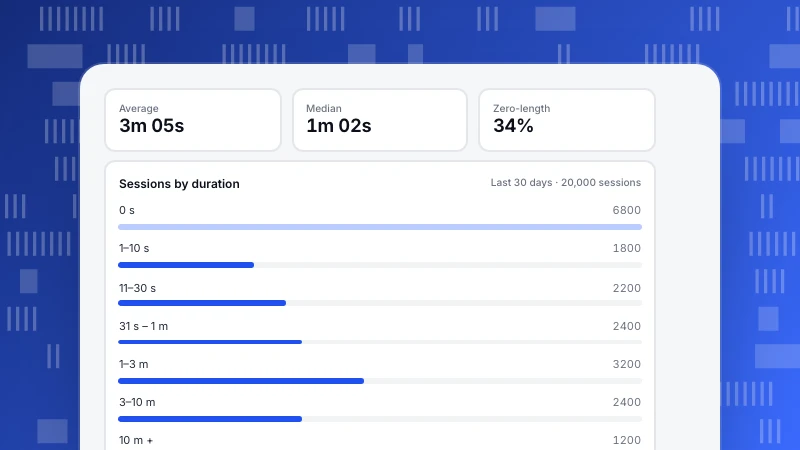
Average Session Duration: How It's Calculated and Why the Mean Misleads
Average session duration is the last event minus the first, averaged over sessions. Why one-page sessions often count as zero, how a few long sessions inflate the mean, and how to read it as a distribution instead.
Read more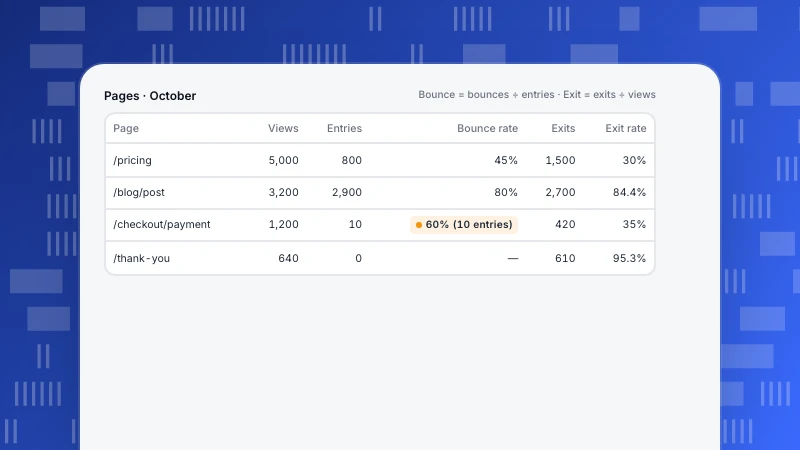
Bounce Rate vs Exit Rate: Different Denominators, Different Questions
Bounce rate divides single-page sessions by sessions that started on a page; exit rate divides exits by every view of that page. A worked table, which pages each one fits, and the mistakes to avoid.
Read more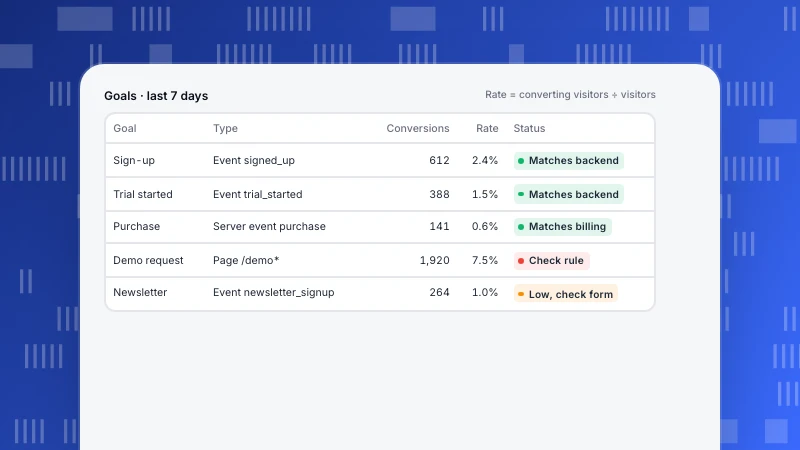
Conversion Tracking: Set It Up on Your Site and Count Each Once
Conversion tracking on your own site: decide what counts, record each conversion as a page goal, client event or server event, keep it from being counted twice, verify it, and keep it apart from ad-platform tags.
Read more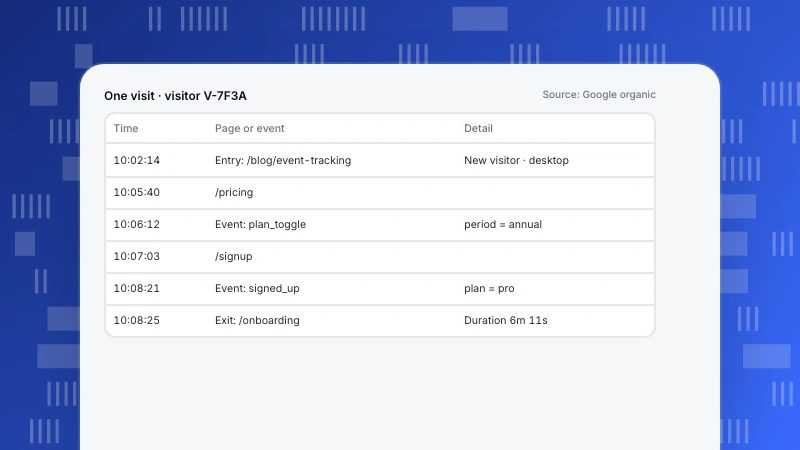
Website Visitor Tracking: Four Layers and What Each Can See
Website visitor tracking in four layers: aggregate counts, sessions and paths, identified users after login, and company identification. What each layer sees, what it needs, and where privacy changes what you should collect.
Read more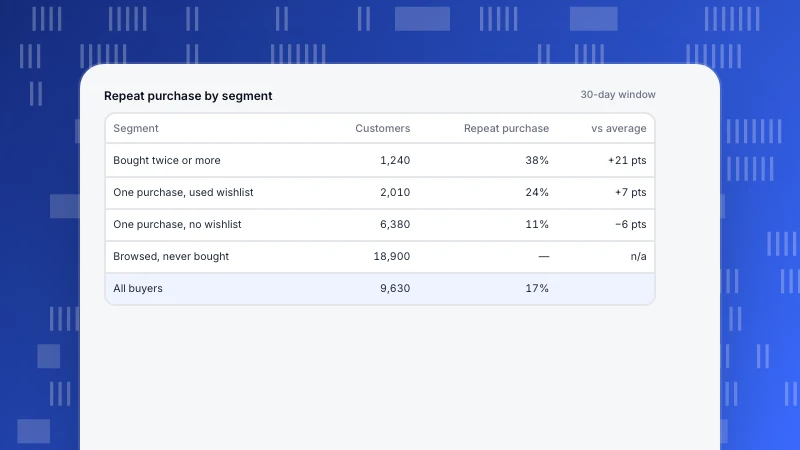
Customer Segmentation Analysis: Five Steps from Question to Action
Customer segmentation analysis in five steps: start from a decision, choose variables you can observe, compare segments on the same KPI, check size and stability, then act and measure again.
Read moreOther categories
Each category answers a recurring question we hear from customers. Start with the one closest to your job.
Growth & Marketing
Acquisition, marketing, site and app operations, and how to pick the one stage worth fixing first.
238 articlesLive Chat
Proactive invites, translation and turning support conversations into conversions.
78 articlesAI Search
GPTBot, ClaudeBot, PerplexityBot: who fetches your pages, what the files say and what comes back.
39 articlesProduct News
What shipped, why we built it that way, and how to turn it on.
64 articles