Try it on your own data
Every report in this article is in the free plan. One snippet for web and apps, up to 10 sites.
Start freeDashboards show averages everywhere, but most business data has a long tail. This guide explains the mean and the median, walks through a sample week where one bulk order doubles average order value, and shows which metrics should be read as medians.
What you will learn
- The mean is pulled by large values; the median is the middle and ignores how extreme the tail is
- For order value, session duration and load time, read the median (or P75) as the typical case
- A big gap between mean and median is a finding: a few values dominate
The difference in one sentence
The mean (the everyday "average") adds every value and divides by how many there are. The median is the middle value once you sort them: half the values are below it, half above.
When the data is roughly symmetric, the two are close. When a few values are much larger than the rest, the mean gets pulled toward them and the median does not. Most business data, such as order values, session durations, page load times and revenue per customer, has exactly that long tail.
How to calculate each
- Mean: sum ÷ count. For 3, 5 and 10: (3 + 5 + 10) ÷ 3 = 6.
- Median: sort the values and take the middle one. For 3, 5, 10 it is 5. With an even count, average the two middle values: for 3, 5, 10, 12 it is (5 + 10) ÷ 2 = 7.5.
A worked example: one bulk order
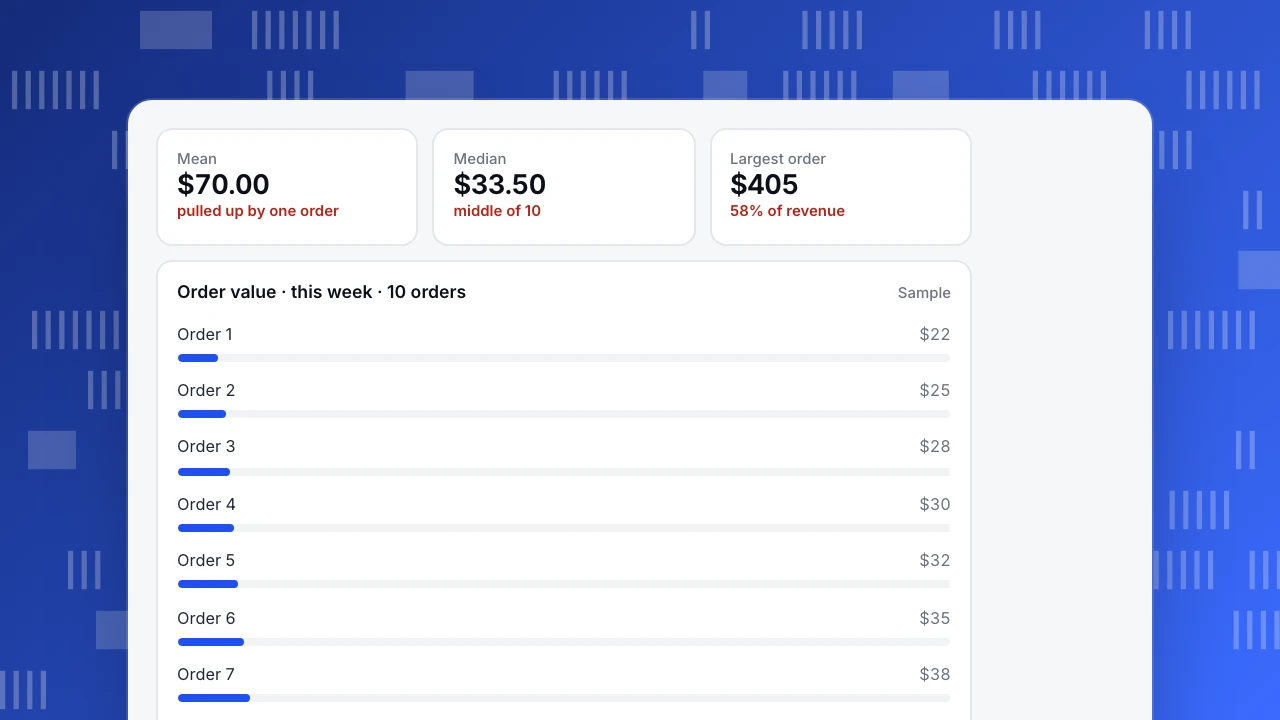
A small shop has 10 orders this week (sample numbers): $22, $25, $28, $30, $32, $35, $38, $40, $45, and one wholesale order of $405.
- Total: $700, so the mean order value is $70.00.
- Sorted, the middle two orders are $32 and $35, so the median is $33.50.
Nine of ten customers spent less than $46, yet the mean says $70. Remove the wholesale order and the mean falls to $32.78 while the median barely moves, from $33.50 to $32. If you set a free-shipping threshold or judged a campaign by the mean, one customer would decide it.
Mean
$70.00
pulled up by one order
Median
$33.50
middle of 10
Largest order
$405
58% of revenue
Order value · this week · 10 orders
SampleWhen to use the mean and when to use the median
Neither is "right". They answer different questions, as the table below shows. A useful habit: report both, and look closer whenever they differ a lot. A big gap is itself a finding: it means a few values dominate.
| Mean | Median | |
|---|---|---|
| Answers | What is the total spread evenly? | What does a typical case look like? |
| Sensitive to outliers | Yes, strongly | No |
| Good for | Forecasting totals (revenue = visitors × mean revenue per visitor), symmetric data | Skewed data: order value, duration, load time, income |
| Adds up | Yes: mean × count = total | No |
| Watch out | One large value can decide it | Hides how big the tail is |
Report both when they differ; the gap tells you how much a few values dominate.
Which analytics metrics are skewed?
- Session duration and time on page. Many short visits and a few very long ones (a tab left open). The mean overstates typical engagement. See average session duration.
- Order value and revenue per customer. A handful of large buyers lift the mean. Use the median for the "typical" customer and the mean for forecasting total revenue.
- Page load time. A few slow connections stretch the tail. Performance teams use the median and the 75th percentile (P75) rather than the mean.
- Time to convert. Most people convert within days, some after months.
- Pageviews per visitor. Bots and power users pull the mean up.
Percentiles extend the median idea: P50 is the median, P75 is the value 75% of samples fall below, P95 shows the slow or extreme tail. For outliers that are errors rather than real customers, consider winsorization before taking the mean.
Mean, median and significance tests
Most A/B test calculators compare means. That is fine for conversion rates, but for revenue per visitor a few large orders make results noisy, which is why tests on revenue need larger samples. See statistical significance.
Where to see medians in TapCub
- Monitoring › Performance: the cards switch between P95, P75, median and average; trends and breakdowns can use P50, P75, P90 or P99.
- All-platform analytics › Behavior › Behavior analysis: for a property such as order amount, choose sum, average, median or 90th percentile as the aggregation, and split by source or device.
- Interval analysis shows the median and percentiles of the time between two events, for example from sign-up to first purchase.
See also
Was this article helpful?
We use your answers to fix and expand this page.
Couldn’t send. Please try again in a minute.
Thanks for the feedback. We’ll use it to improve this page.You’ve already sent feedback on this page. Thanks.

Data Analyst
Explores traffic sources, conversion funnels, and retention, using clear metric definitions and concrete examples to explain what the numbers mean.