Metrics
77 articles tagged “Metrics”. Tags cut across categories, so you may find analytics, chat and product notes side by side.
Tagged Metrics
77 articles · page 1 of 2
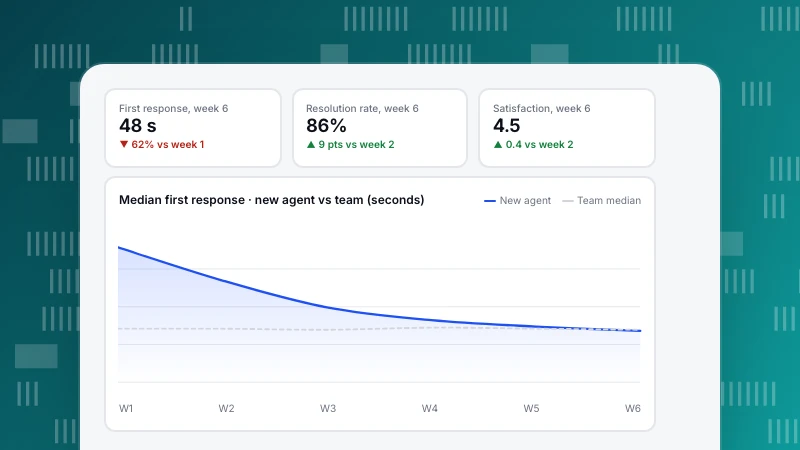
Customer service training: what to cover, a 30-day plan and how to measure it
A practical customer service training programme: the skills to cover and how to practise each, a 30-day onboarding plan for chat agents, training methods compared, and how to prove the training worked with support metrics.
Read more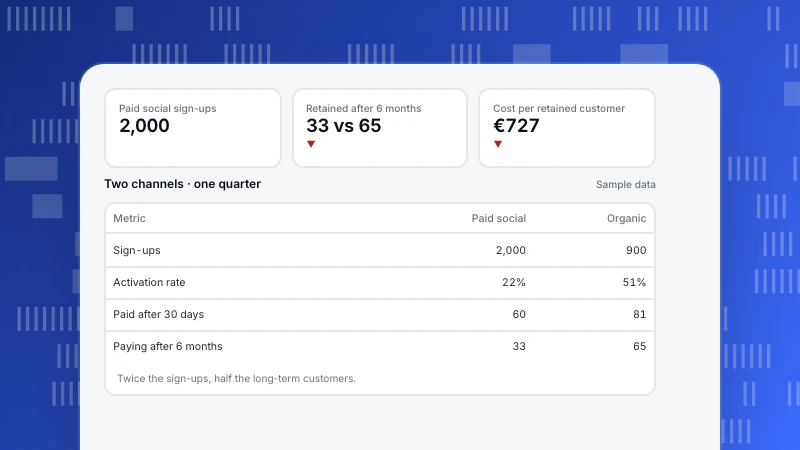
Product analytics vs marketing analytics: differences and why to join them
Product analytics vs marketing analytics: a side-by-side comparison, where they overlap, why joining them on one identity matters, and a channel example.
Read more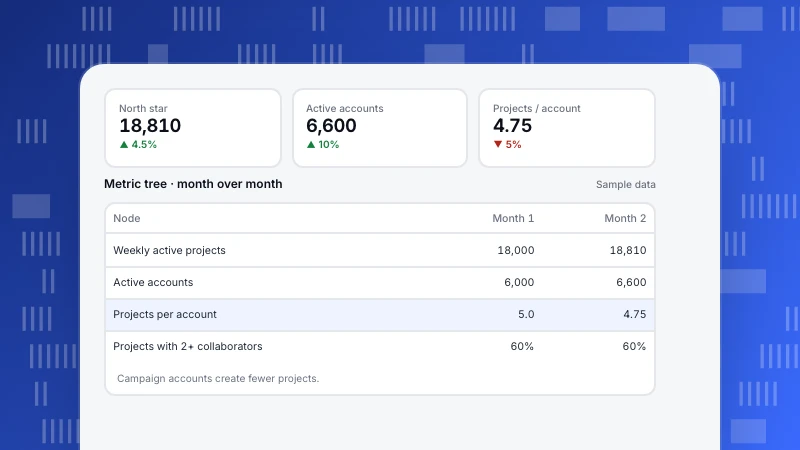
Product analytics framework: how to choose metrics that drive decisions
A product analytics framework connects goals to metrics, behaviors and events. North Star, AARRR, HEART and metric trees compared, five steps to build your own, and a metric tree example.
Read more
Analytics for product managers: metrics, analyses and a weekly routine
What product managers should measure, the six analyses every PM should be able to run, a weekly analytics routine and an example of sizing a roadmap item with data.
Read more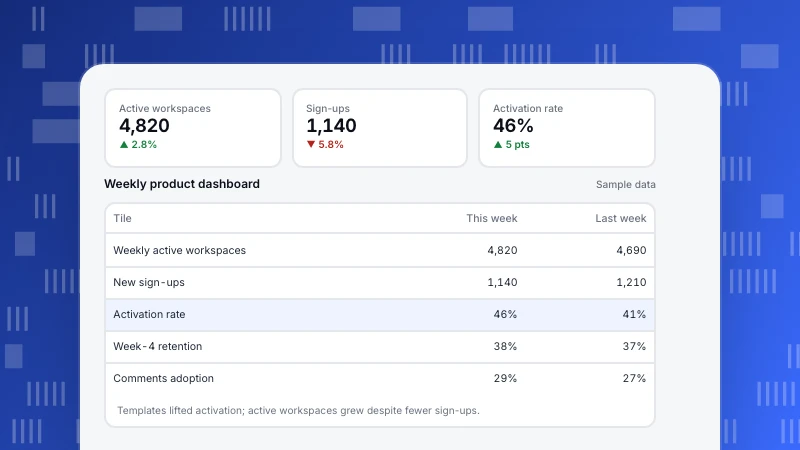
Product analytics dashboard: what to include and an example
What to put on a product analytics dashboard: north star, activation, engagement, adoption, retention, revenue and quality. Six steps to build it and a weekly example.
Read more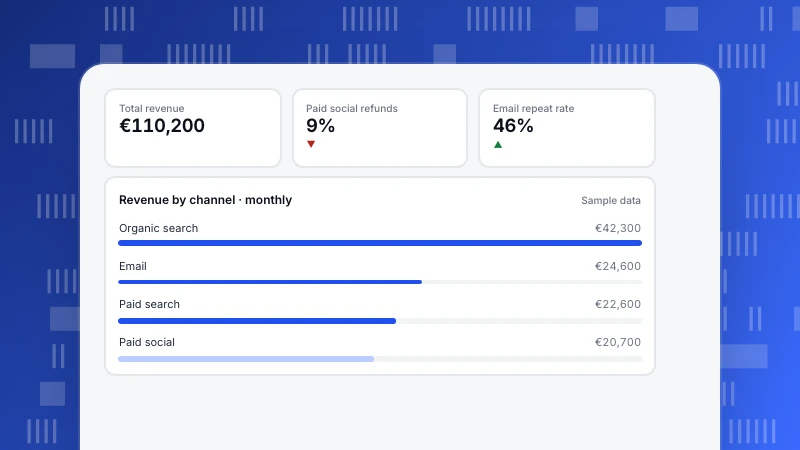
Ecommerce analytics: metrics, reports and how to set it up
Ecommerce analytics joins traffic, behavior and transactions. The metrics and formulas that matter, five reports every store needs, setup steps and a channel-quality example.
Read more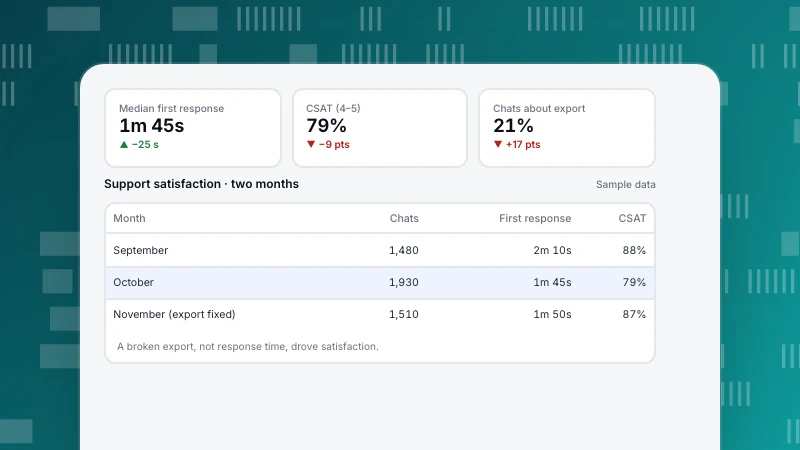
Customer experience metrics: CSAT, NPS, CES and 7 more with formulas
The customer experience metrics that matter, with formulas: perception (CSAT, NPS, CES), operational (response, resolution, task completion) and outcome (churn, retention). How to choose them and a worked example.
Read more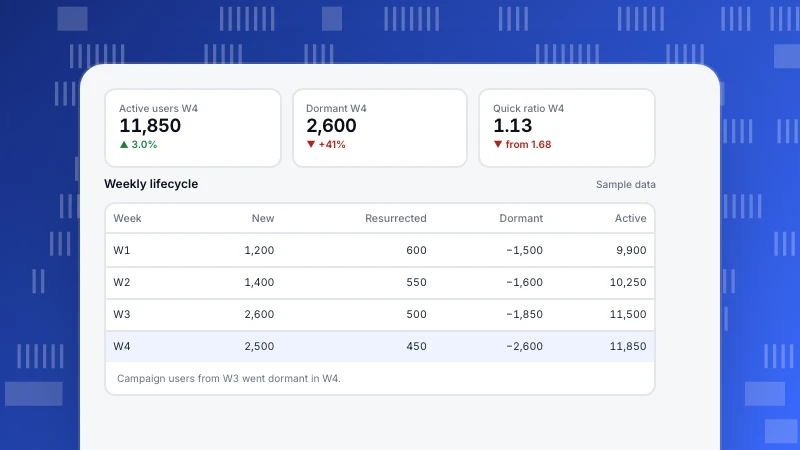
User status segmentation: new, returning, resurrected and dormant users
User status segmentation classifies users as new, returning, resurrected, at risk or dormant each period. Definitions, the growth accounting identity, actions per status and a weekly example.
Read more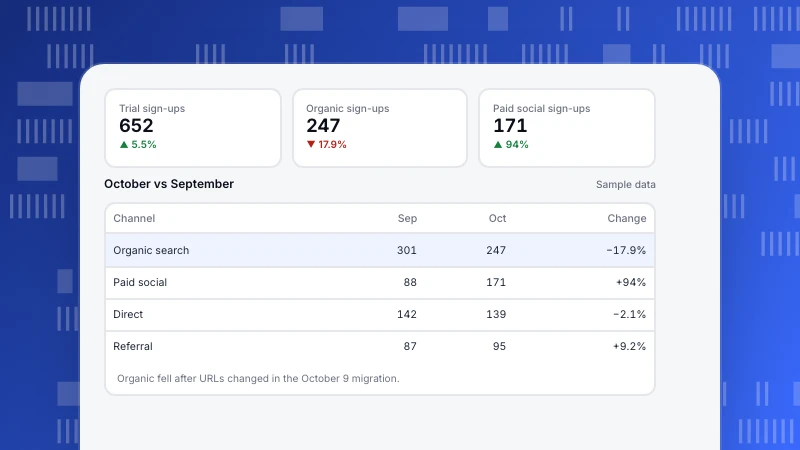
Web analytics report: what to include, types and an example
How to write a web analytics report that leads to action: report types by audience, what to include, six steps and a one-page monthly example.
Read more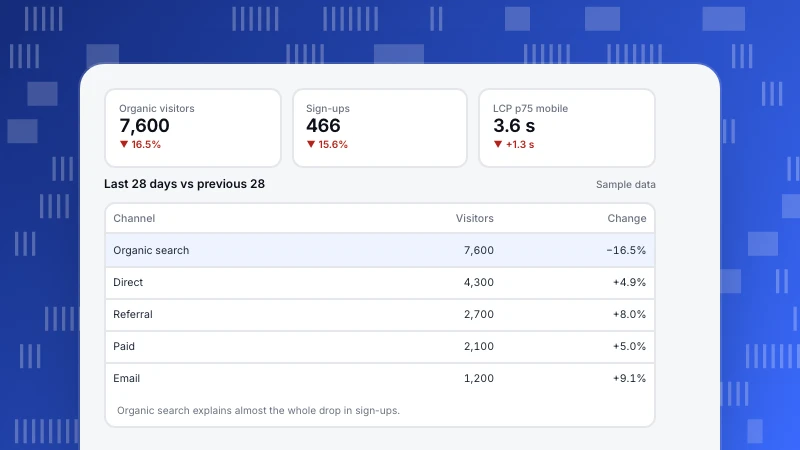
Website analysis: how to analyze a website in 7 steps
How to analyze a website across traffic, behavior, technical health and search, with a 28-day worked example, how to size up a competitor site, common mistakes and a FAQ.
Read more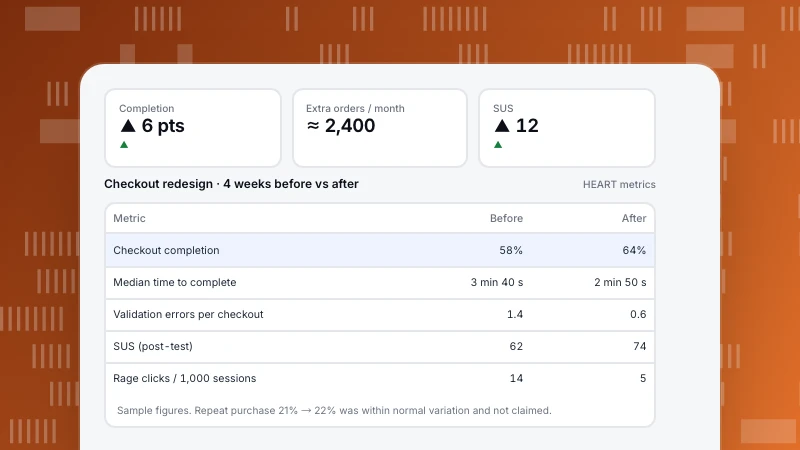
UX metrics: what to measure, the HEART framework and a worked redesign
The UX metrics that matter, behavioral and attitudinal, with how to measure each; Google’s HEART framework with goals, signals and metrics; and a worked checkout redesign measured before and after.
Read more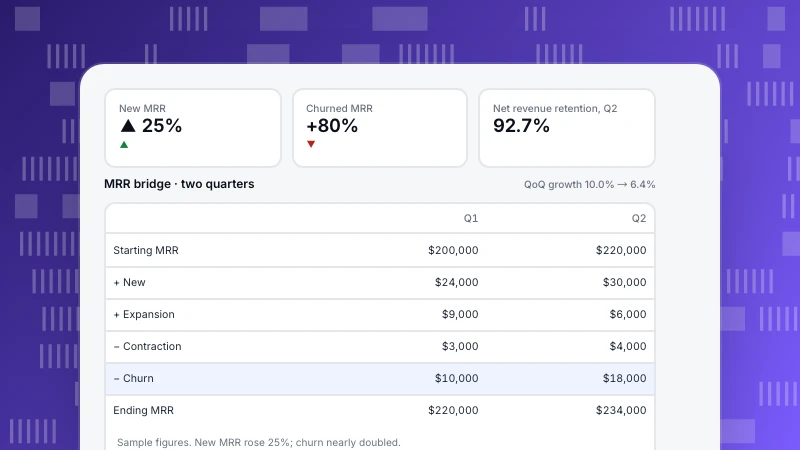
Revenue growth rate: formula, CAGR, benchmarks and a worked MRR bridge
How to calculate revenue growth rate month over month, quarter over quarter and year over year, when to use CAGR, what counts as good growth, and a worked MRR bridge showing why growth slowed while new sales rose.
Read more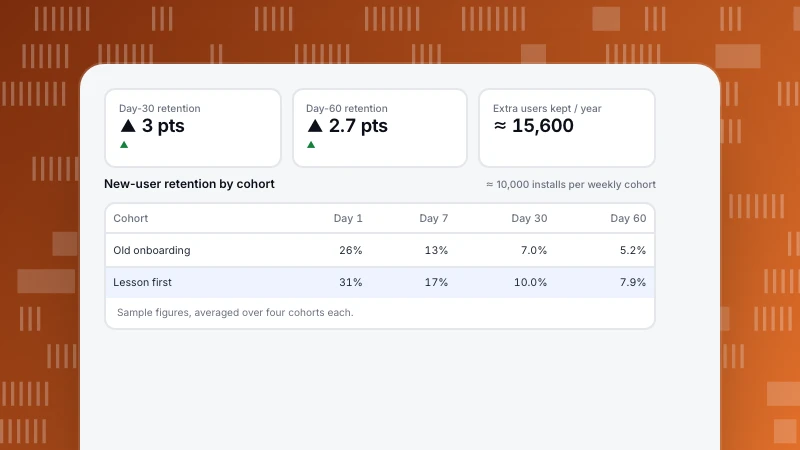
App retention rate: how to calculate it, read the curve and improve it
App retention rate is the share of new users who come back after N days. The formula, why classic, range and unbounded retention give different numbers, what a healthy curve looks like, and a worked onboarding change measured by cohort.
Read more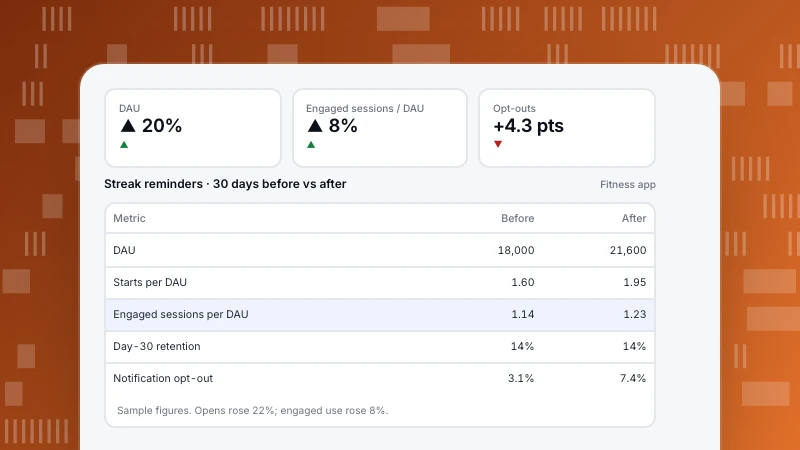
App engagement metrics: formulas, benchmarks by app type and a worked case
The app engagement metrics that matter, with formulas: DAU, MAU, stickiness, session length and interval, engaged sessions and retention. How to judge them by app type, and a worked case where opens rose 22% but real use barely moved.
Read more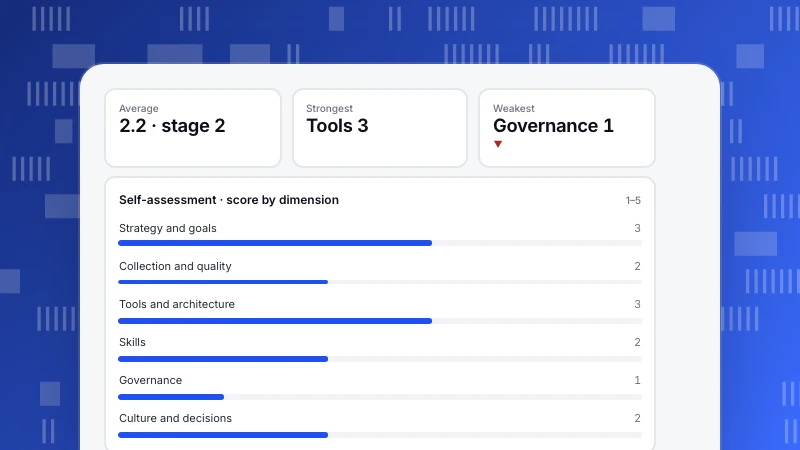
Data maturity model: five stages, a self-assessment and what to fix first
A data maturity model shows how organizations progress from ad hoc spreadsheets to data embedded in decisions. Five stages, six dimensions to score, a worked self-assessment where tools outran governance, and the questions to ask.
Read more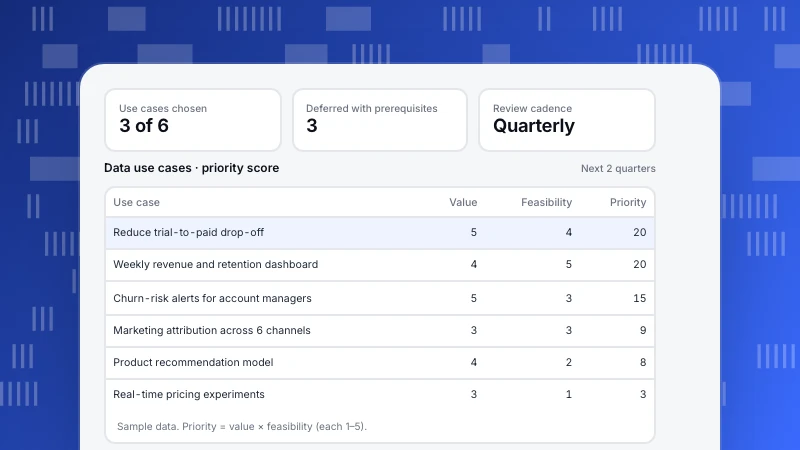
Data strategy: components, a worked example and a one-page plan
A data strategy links business goals to how data is collected, governed and used. Offense vs defense, the seven components, a worked example scoring six use cases into a 90-day plan, five steps to write one and the mistakes that stall it.
Read more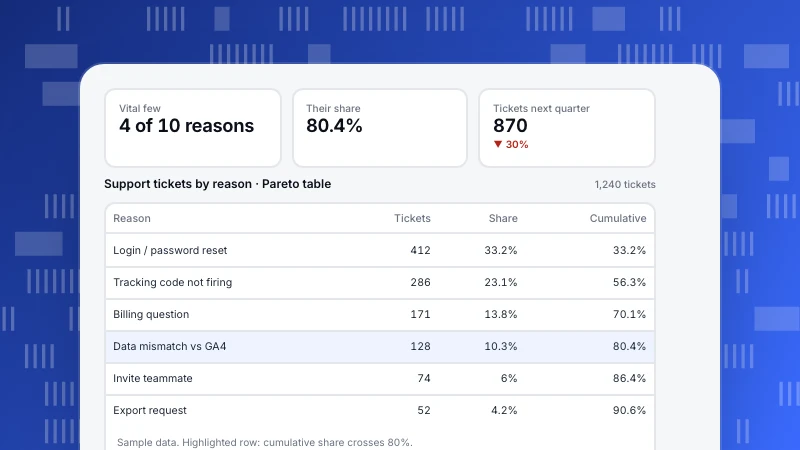
Pareto analysis: how to find the 20% that drives 80% of results
Pareto analysis finds the few causes behind most of an effect. The 8 steps, a support-ticket example where 4 of 10 reasons caused 80% of tickets, a traffic concentration example, analytics use cases and the mistakes that make the 80/20 rule misleading.
Read more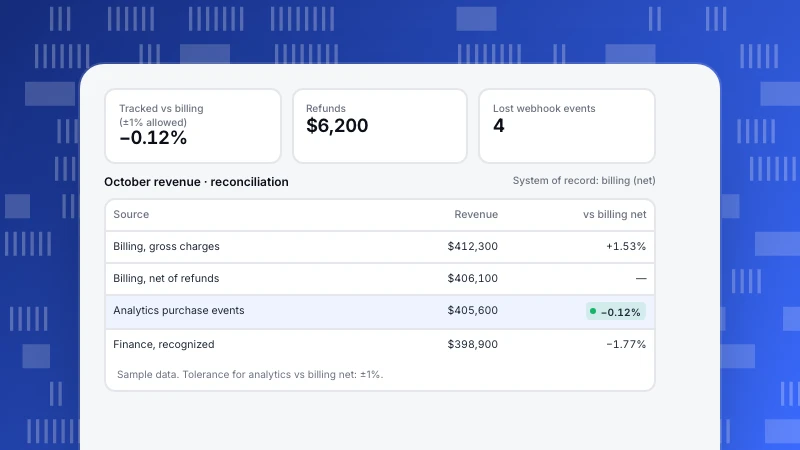
Single source of truth for analytics: definitions, owners and reconciliation
A single source of truth means one agreed value and definition for each important metric. Source vs version of truth, why numbers disagree, a worked example reconciling four October revenue figures, and the steps to make it stick.
Read more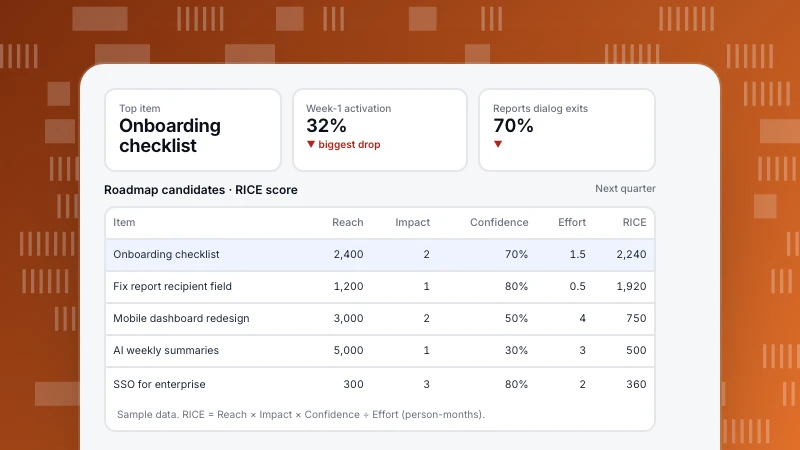
Product roadmap: types, how to build one and how to prioritize with data
A product roadmap links strategy to what gets built next. Four roadmap types compared, an 8-step process, a RICE prioritization example with reach taken from funnel data, and the mistakes that turn roadmaps into feature factories.
Read more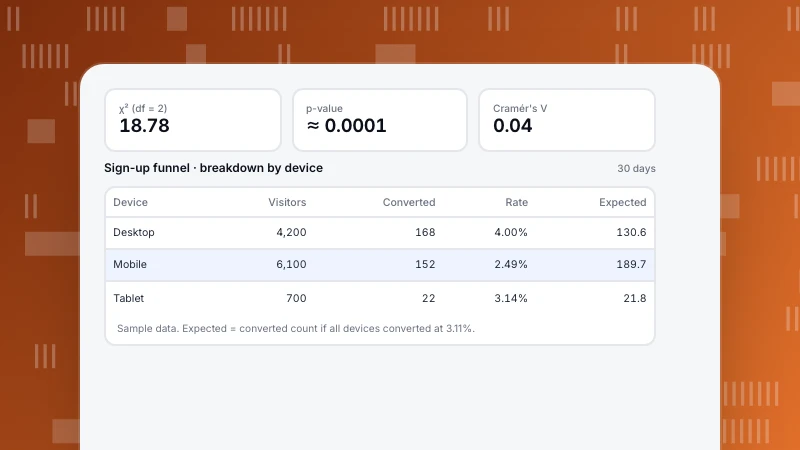
Chi-square test explained with conversion and experiment examples
The chi-square test checks whether category counts differ from chance. Two worked examples, conversion by device and a sample ratio mismatch check, with every expected count, degrees of freedom, effect size and the mistakes to avoid.
Read more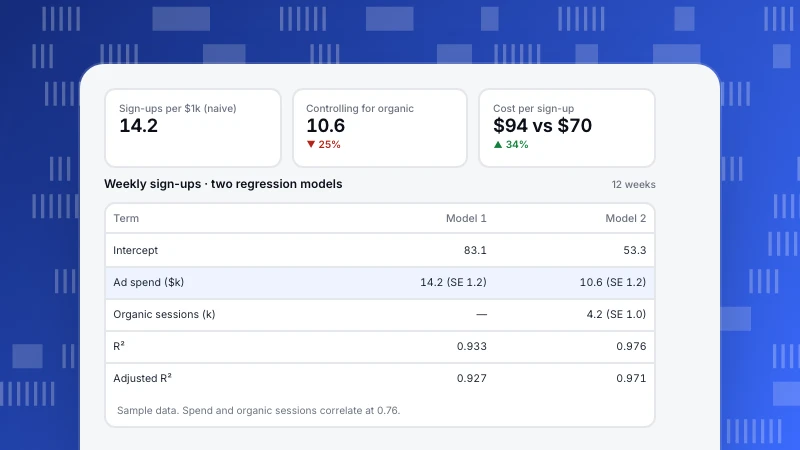
Regression analysis for marketers and analysts: a worked example
Regression analysis estimates how an outcome changes with its drivers. A 12-week example shows how leaving out organic traffic inflated the value of ad spend by a third, plus how to read output, check assumptions and avoid common mistakes.
Read more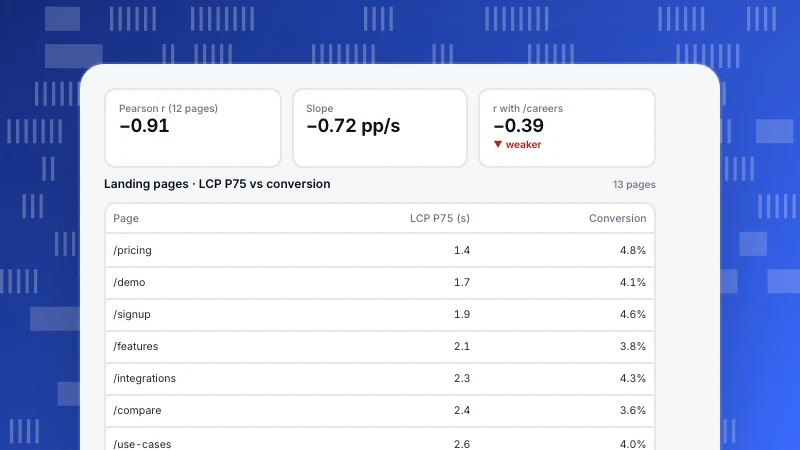
Scatter plots: how to read them, make them and avoid false conclusions
A scatter plot shows how two numeric variables move together. How to read direction, form, strength, outliers and clusters, with a page-speed vs conversion example where one outlier flips the conclusion.
Read more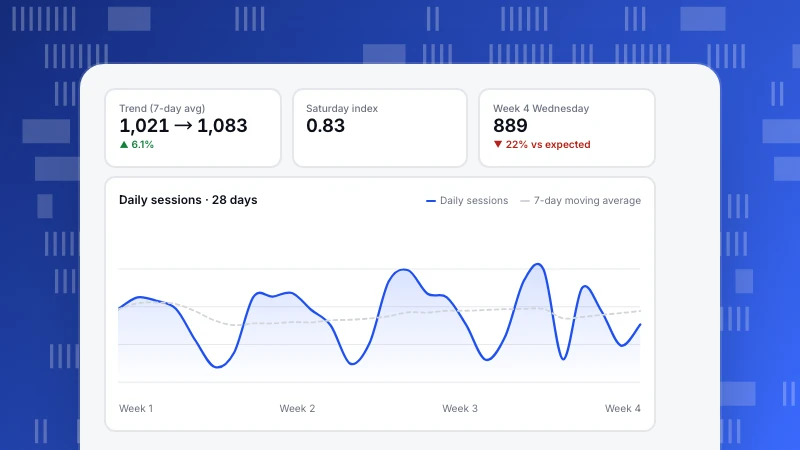
Time series analysis for web analytics: trend, seasonality and anomalies
Time series analysis separates trend, seasonality and noise so you can tell a real change from a Monday. A 4-week worked example, the core techniques, forecasting baselines and the mistakes that mislead dashboards.
Read more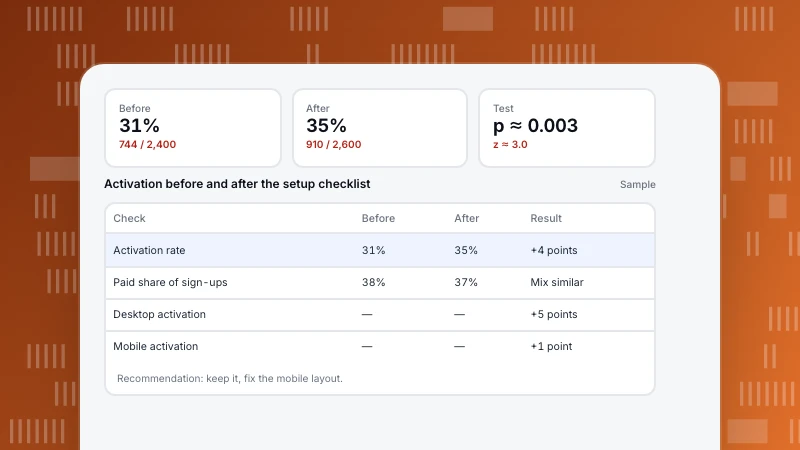
What Does a Product Analyst Do? Tasks, Skills and a Real Example
A product analyst turns product usage data into decisions: defining metrics, setting up tracking, answering questions about features and users, and checking whether changes worked. Five recurring jobs, a typical week, a worked analysis and how the role compares with related jobs.
Read more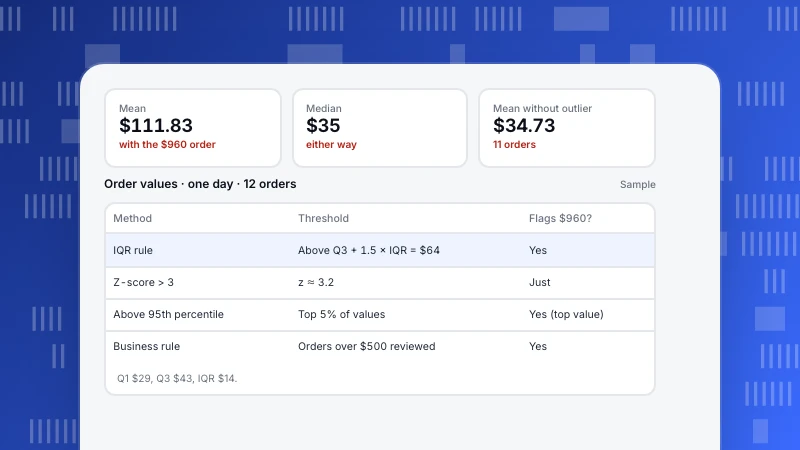
Outliers in Data: How to Find Them and What to Do With Them
An outlier is a value far from the rest of the data. How to find outliers with the IQR rule, z-scores and percentiles, a worked example with 12 orders, and how to decide whether an outlier is an error to remove or a real value to report.
Read more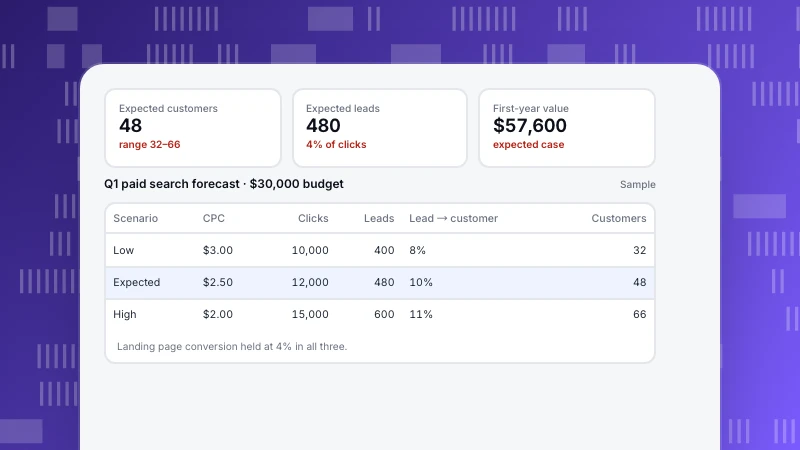
Marketing Forecasting: Methods and a Worked Quarterly Forecast
Marketing forecasting estimates the traffic, leads, customers and revenue your marketing will produce. Four methods, a worked funnel-based forecast with low, expected and high scenarios, and how to compare forecast with actuals every month.
Read more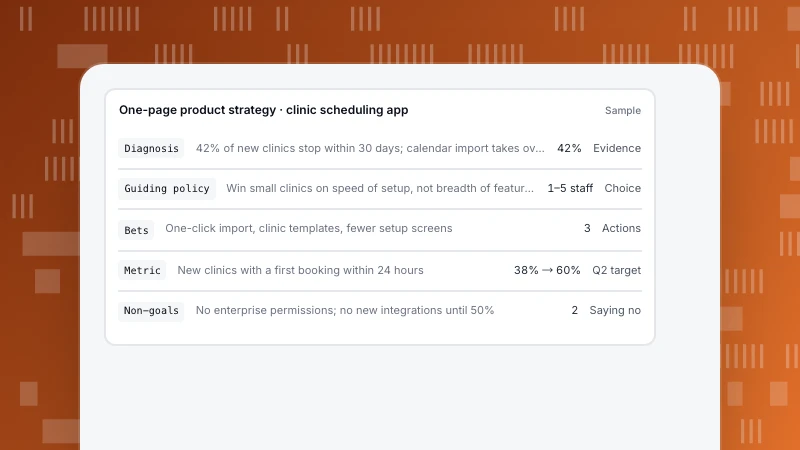
Product Strategy Framework: A One-Page Template With an Example
A product strategy explains where you will win and what you will not do. Five well-known frameworks compared, a one-page template (diagnosis, guiding policy, bets, metric, non-goals), and a filled-in example you can copy.
Read more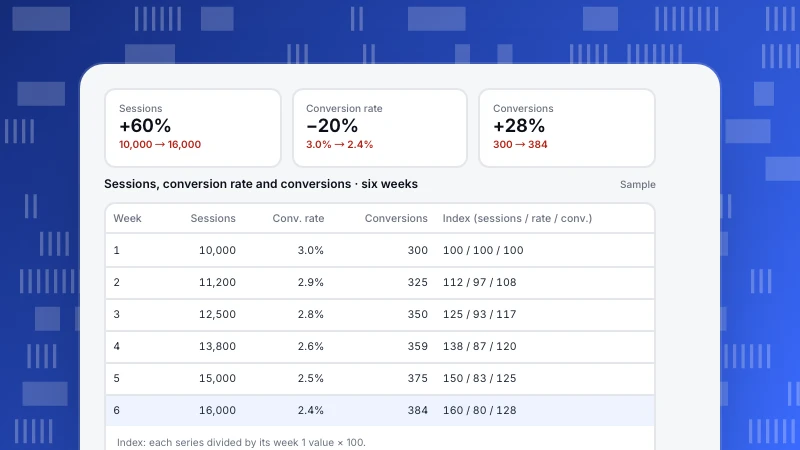
Dual Axis Charts: When They Mislead and What to Use Instead
A dual-axis chart puts two measures with different units on one chart, each with its own y-axis. The axis ranges are arbitrary, so the chart can show crossings and correlations that mean nothing. When it is acceptable, and four clearer alternatives with the same data.
Read more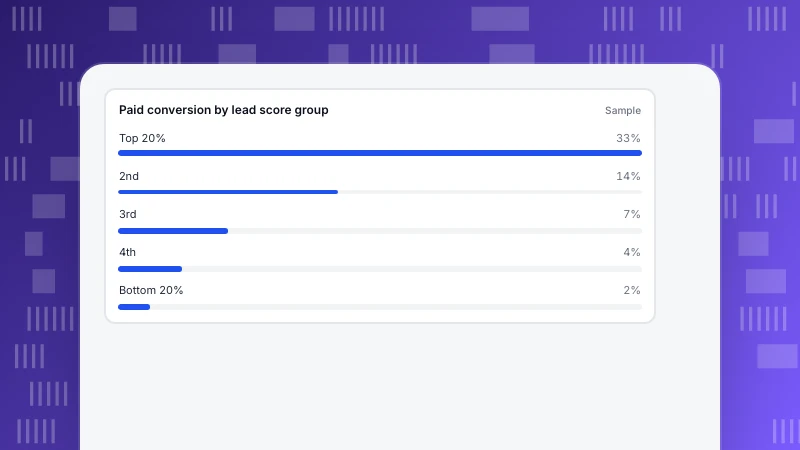
Predictive Analytics in Marketing: Use Cases and a Simple First Model
Predictive analytics in marketing uses past behavior to estimate what a person or a segment will do next: buy, upgrade, churn or respond. Five use cases, a simple lead score checked on held-out data, and how to judge whether a model really works.
Read more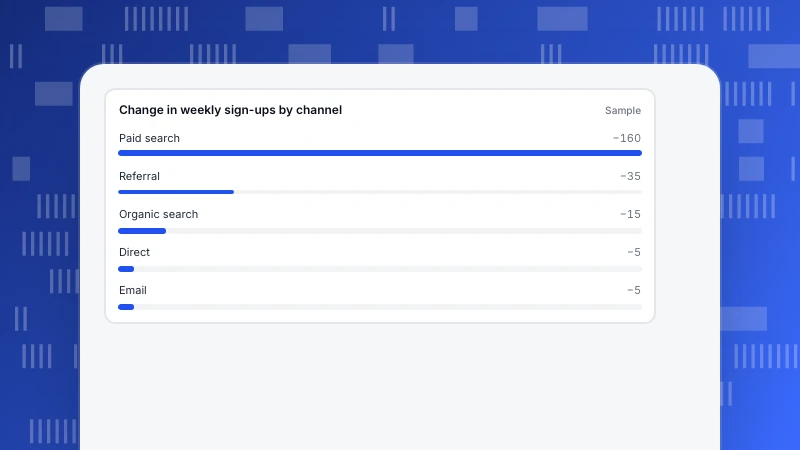
How to Analyze Data: 6 Steps and a Worked Example
A practical six-step way to analyze data: start from a question, pick the metric, check the data, break the change down, test the explanation and act. With a worked example of a 220 sign-up drop traced to one channel.
Read more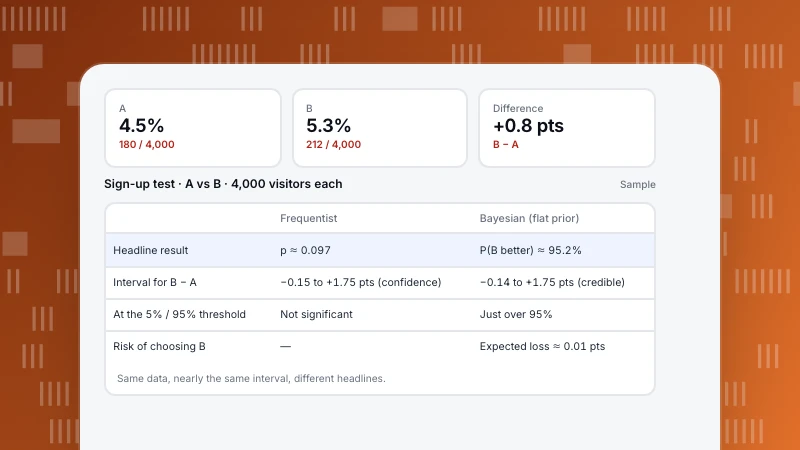
Bayesian vs Frequentist: The Same A/B Test, Analysed Both Ways
Frequentist and Bayesian statistics answer different questions about the same data. A plain explanation of both, one A/B test analysed each way (p = 0.097 vs a 95% chance B is better), and when to use which.
Read more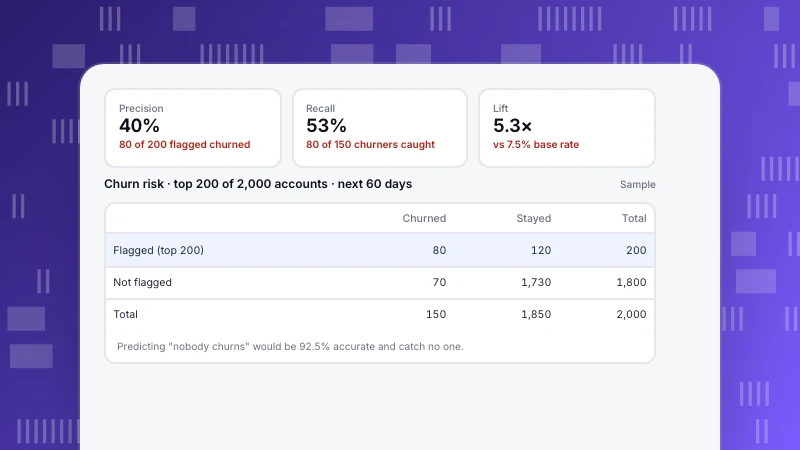
Customer Churn Prediction: Signals, Simple Models and How to Judge Them
Churn prediction flags customers likely to cancel early enough to do something about it. Which signals predict churn, a rule-based way to start, and a worked example of judging a model by precision, recall and lift.
Read more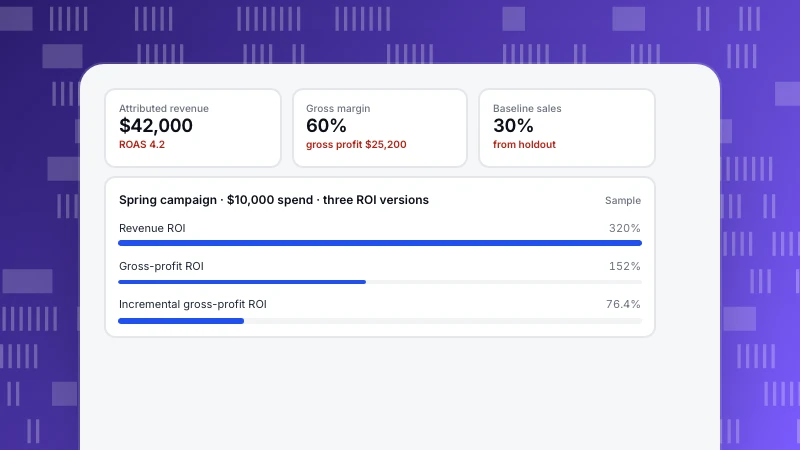
Marketing ROI: How to Calculate It (and Why the Simple Formula Misleads)
Marketing ROI compares what a campaign earned with what it cost. The formula in three versions, a worked example where the same campaign shows 320%, 152% or 76% depending on the method, and how ROI differs from ROAS.
Read more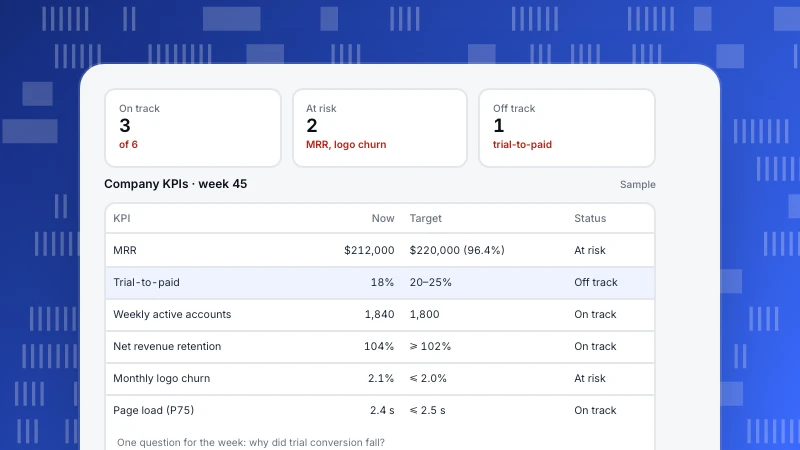
KPI Dashboard: How to Design One People Actually Use
A KPI dashboard shows a handful of key numbers, each with a target and a status, so anyone can see in a minute what is on track. Eight design rules, a sample company dashboard, and how to build one in six steps.
Read more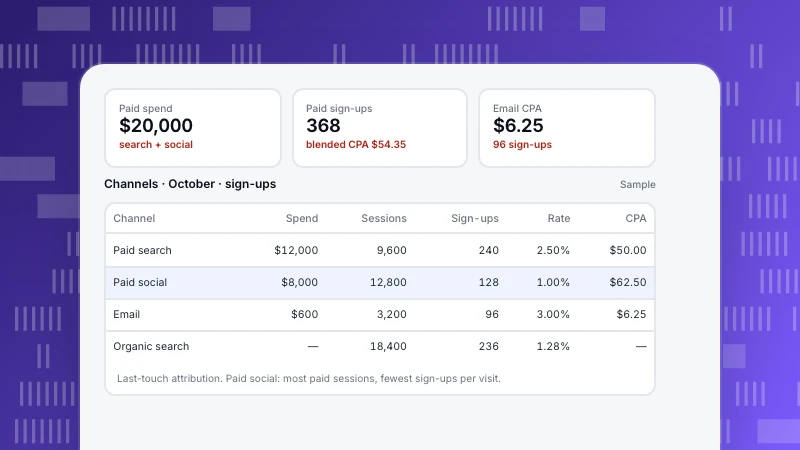
Marketing Dashboard: What to Include, With a Sample Layout
A marketing dashboard shows which channels bring customers and at what cost. The five sections to include, a sample channel table with spend, conversions and CPA, blended vs channel numbers, and the mistakes that make dashboards misleading.
Read more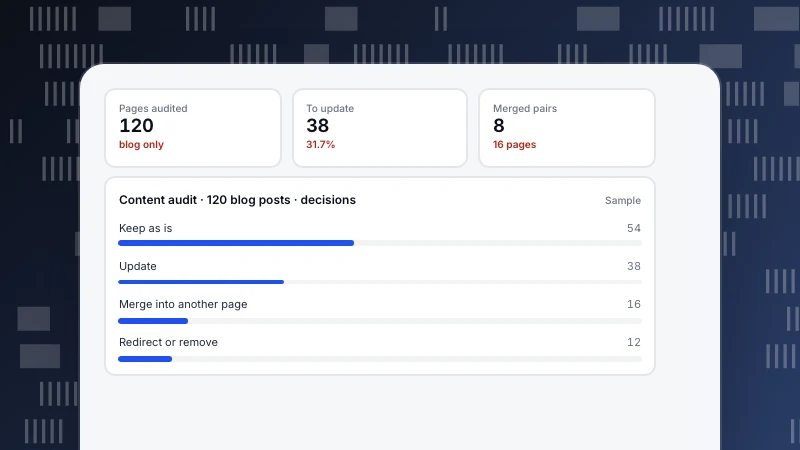
Content Audit: How to Review Every Page and Decide What to Do
A content audit lists every page with its traffic, conversions, links and trend, then decides to keep, update, merge or remove it. The data to collect, decision rules, and a worked sample of 120 pages.
Read more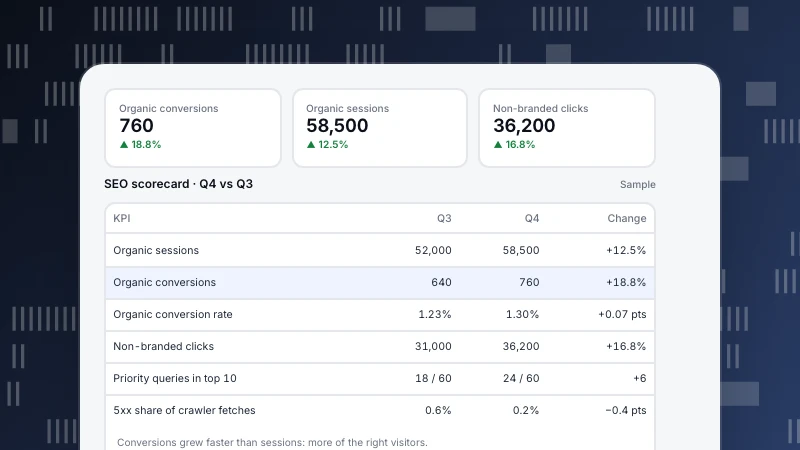
SEO KPIs: 10 Metrics That Show Whether SEO Is Working
Not every SEO metric is a KPI. Ten SEO KPIs in three tiers, business, visibility and technical health, with formulas, data sources, a sample quarterly scorecard and how to set targets.
Read more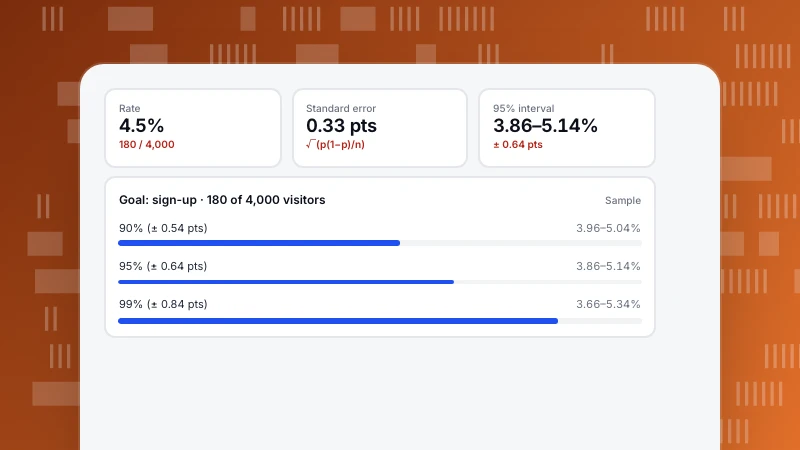
How to Calculate a Confidence Interval (With Conversion Rate Examples)
A confidence interval gives the range a true value probably sits in. The formulas for a mean, a rate and a difference between two rates, worked examples with conversion data, and what to do with small samples.
Read more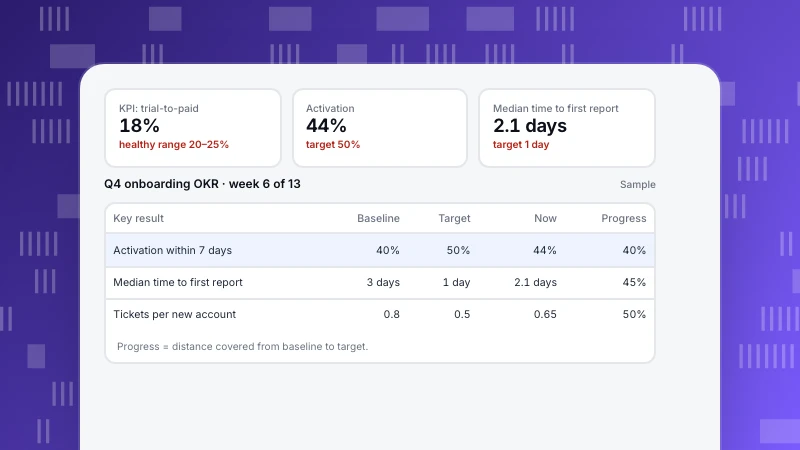
OKR vs KPI: The Difference and How to Use Them Together
KPIs track the health of what you already do; OKRs describe the change you want this quarter. The difference, how one feeds the other, a worked example with measurable key results, and the common mistakes.
Read more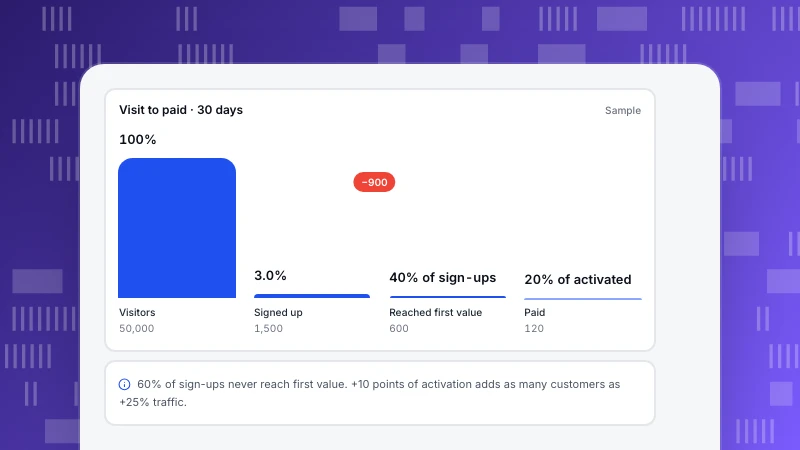
Growth Marketing: What It Is and How to Run It With Data
Growth marketing works on the whole customer journey, not just the top of the funnel, and runs on small, measured experiments. How it differs from traditional marketing, a sample funnel and experiment backlog, and the metrics for each stage.
Read more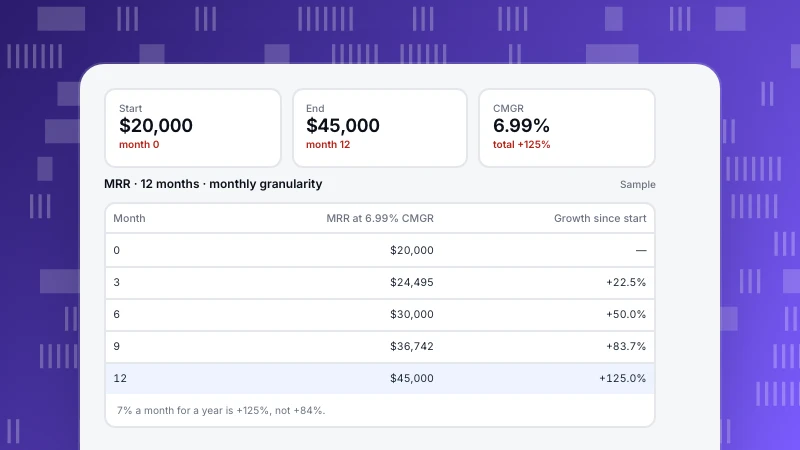
Compound Monthly Growth Rate (CMGR): Formula and Examples
Compound monthly growth rate (CMGR) is the steady monthly rate that takes you from a starting value to an ending value. The formula, a 12-month MRR example, why averaging monthly growth rates overstates growth, and how to calculate it in a spreadsheet.
Read more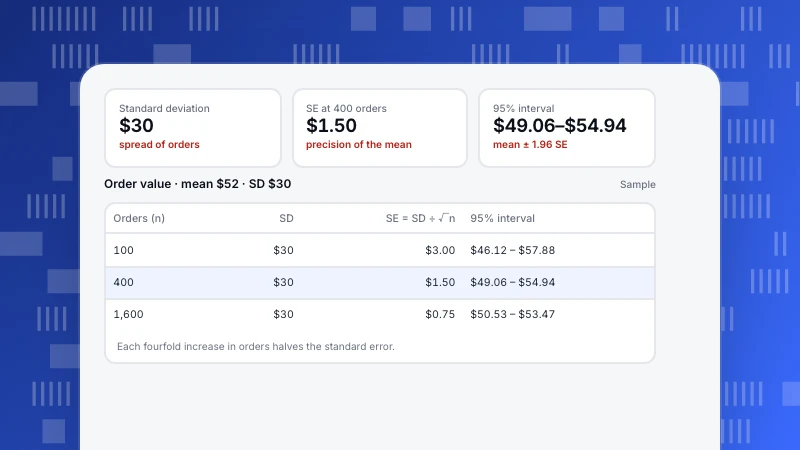
Standard Deviation vs Standard Error: The Difference, With Examples
Standard deviation describes how spread out your data is; standard error describes how precise your average is. The formulas, a worked example at three sample sizes, the conversion-rate version and the mistakes to avoid.
Read more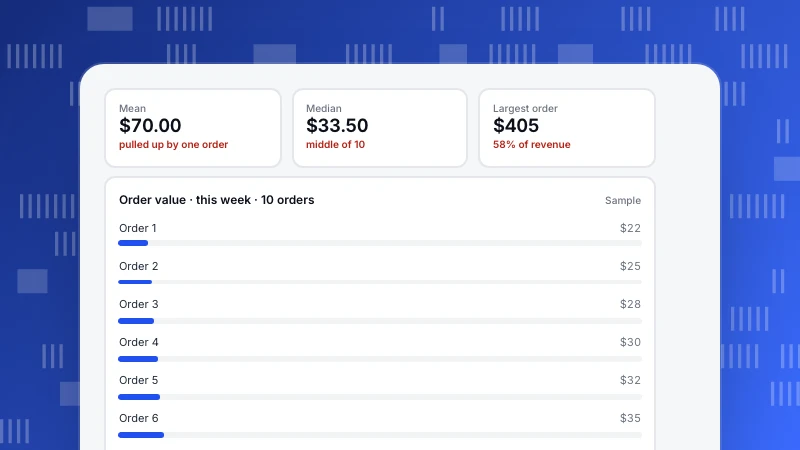
Mean vs Median: Which Average to Use for Your Metrics
The mean adds everything up and divides; the median is the middle value. A worked example where one large order doubles average order value, when to use each, and which analytics metrics should be read as medians.
Read more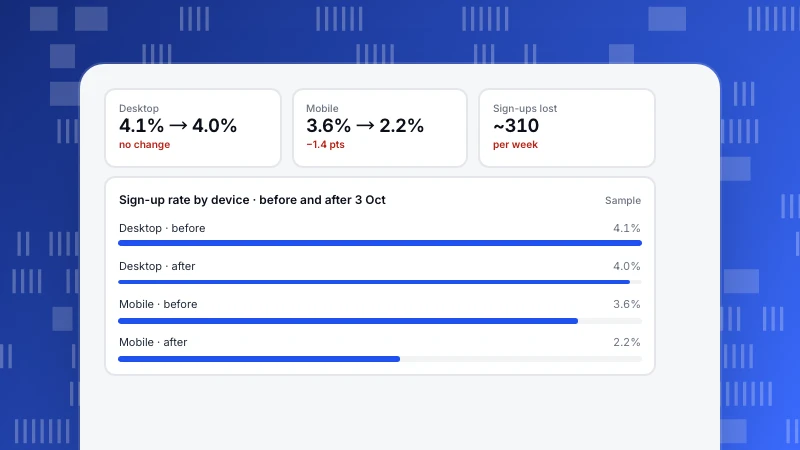
Data Storytelling: A Five-Part Structure, With a Before and After
Data storytelling turns an analysis into a decision someone can act on. A five-part structure for reports and presentations, the same analysis told badly and well, chart-choice rules and how to keep the story honest.
Read more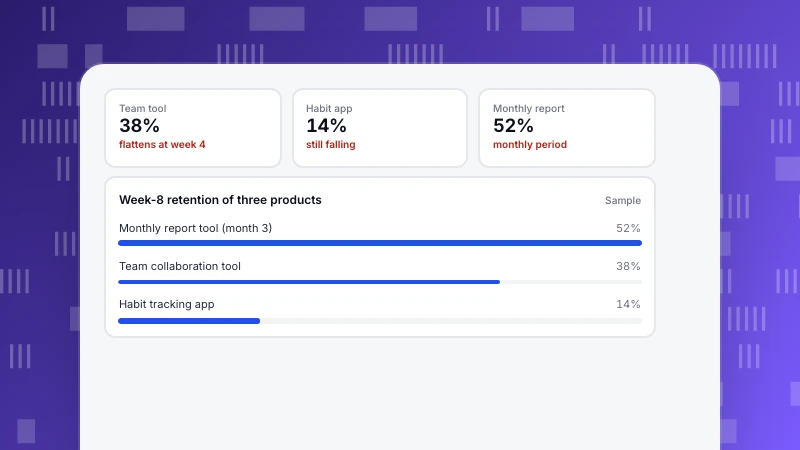
What Is a Good Retention Rate? Read the Curve, Not One Number
A good retention rate depends on the product, the definition and the time frame. Why benchmarks disagree, what the shape of the retention curve tells you, a sample of three products and how to set your own target.
Read more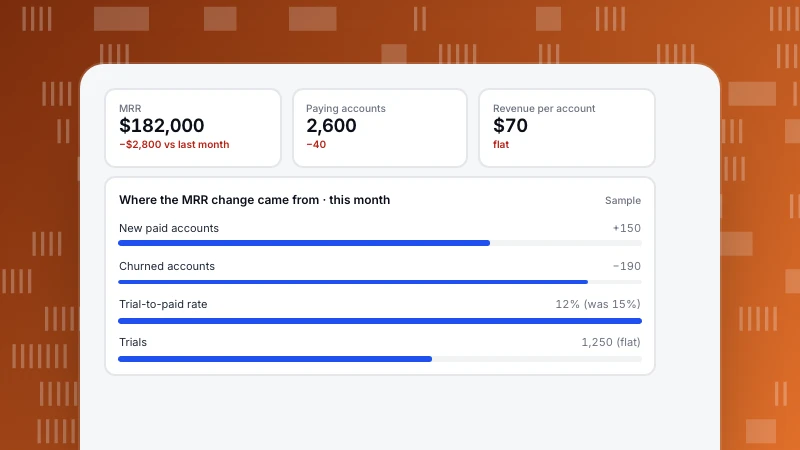
Metric Tree: How to Build One and Use It to Explain Changes
A metric tree breaks one top metric into the drivers that produce it. How to build one in five steps, a sample tree with numbers, how to use it to explain a drop, and how to keep it in your analytics.
Read more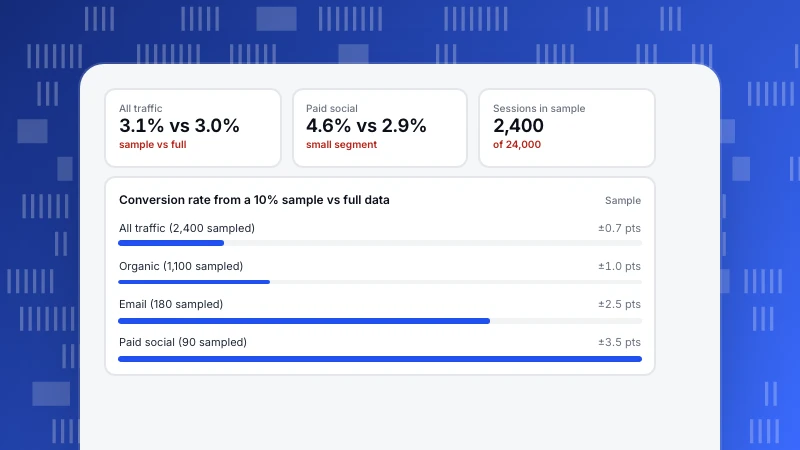
Data Sampling in Analytics: When It Is Fine and When It Misleads
Data sampling means reading a subset to estimate the whole. The main sampling methods, where analytics tools sample, how small segments and rare events go wrong, and rules for trusting sampled numbers.
Read more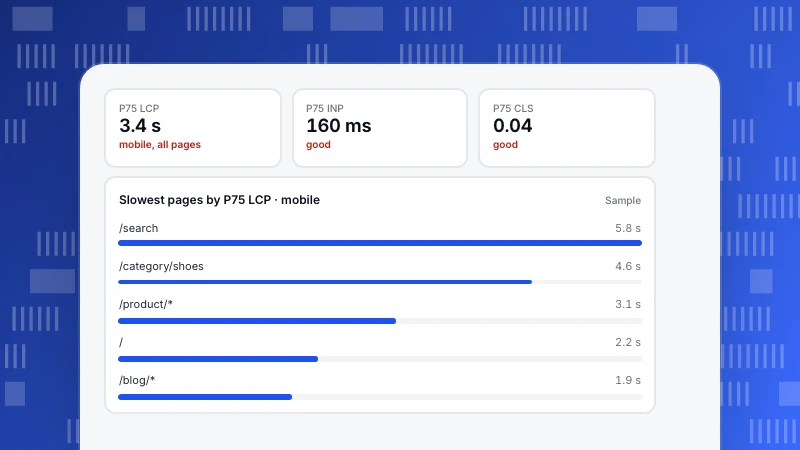
Website Performance Metrics: The Five to Watch and How to Read Them
The website performance metrics that matter: LCP, INP, CLS, FCP and TTFB, their thresholds, why to read the 75th percentile from real users, and a sample that traces a slow page to its cause.
Read more