Product analytics
36 articles tagged “Product analytics”. Tags cut across categories, so you may find analytics, chat and product notes side by side.
Tagged Product analytics
36 articles
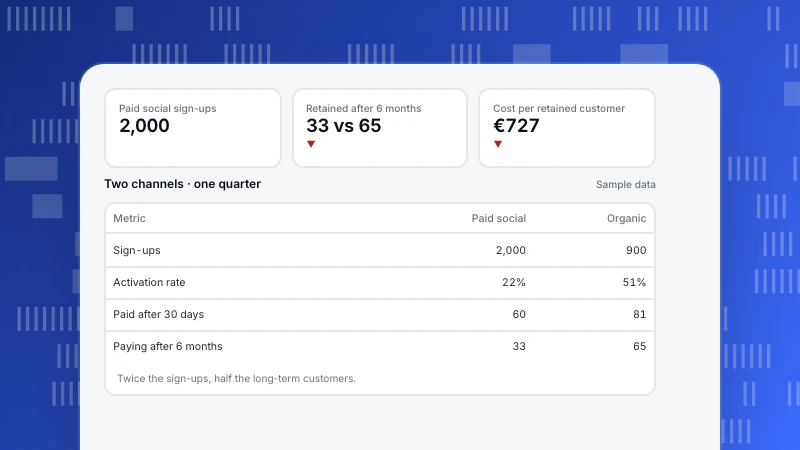
Product analytics vs marketing analytics: differences and why to join them
Product analytics vs marketing analytics: a side-by-side comparison, where they overlap, why joining them on one identity matters, and a channel example.
Read more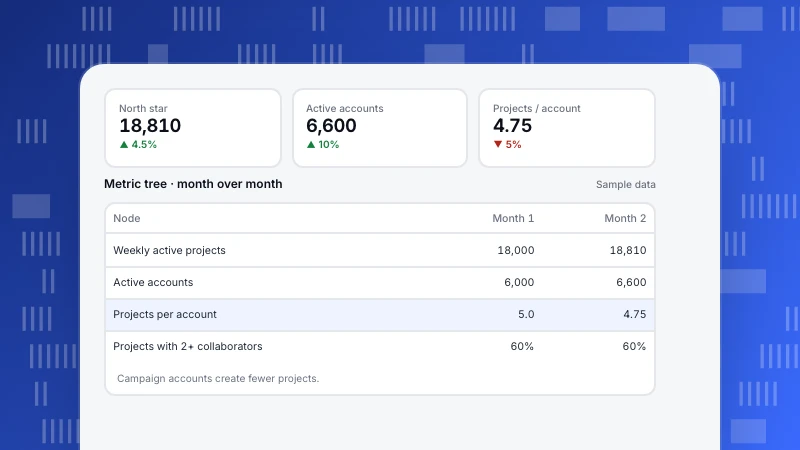
Product analytics framework: how to choose metrics that drive decisions
A product analytics framework connects goals to metrics, behaviors and events. North Star, AARRR, HEART and metric trees compared, five steps to build your own, and a metric tree example.
Read more
Analytics for product managers: metrics, analyses and a weekly routine
What product managers should measure, the six analyses every PM should be able to run, a weekly analytics routine and an example of sizing a roadmap item with data.
Read more
Product analytics examples: 8 questions, analyses and decisions
Eight product analytics examples, each with the question, the analysis, a sample result and the action: funnels, retention, adoption, attribution, paths, lifecycle, conversion and distribution.
Read more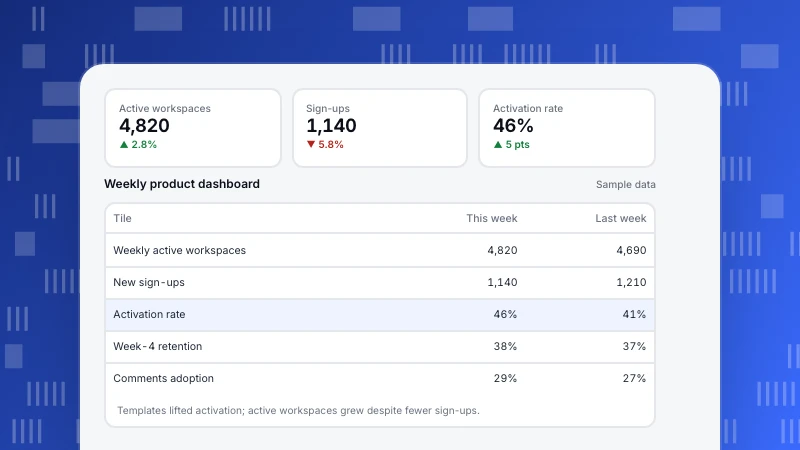
Product analytics dashboard: what to include and an example
What to put on a product analytics dashboard: north star, activation, engagement, adoption, retention, revenue and quality. Six steps to build it and a weekly example.
Read more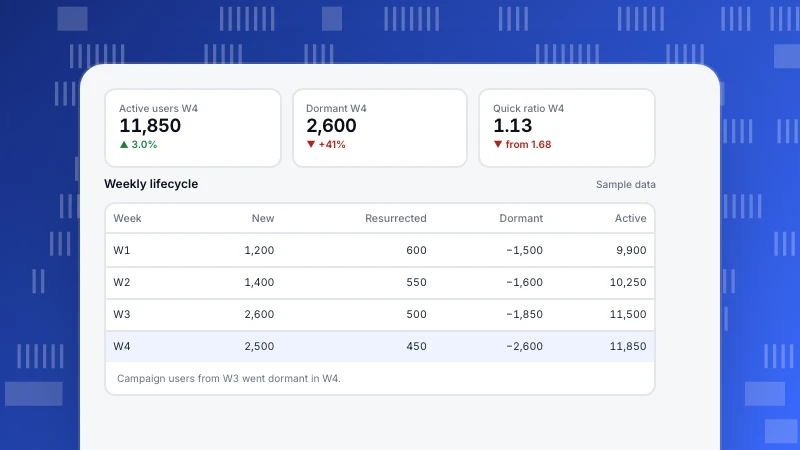
User status segmentation: new, returning, resurrected and dormant users
User status segmentation classifies users as new, returning, resurrected, at risk or dormant each period. Definitions, the growth accounting identity, actions per status and a weekly example.
Read more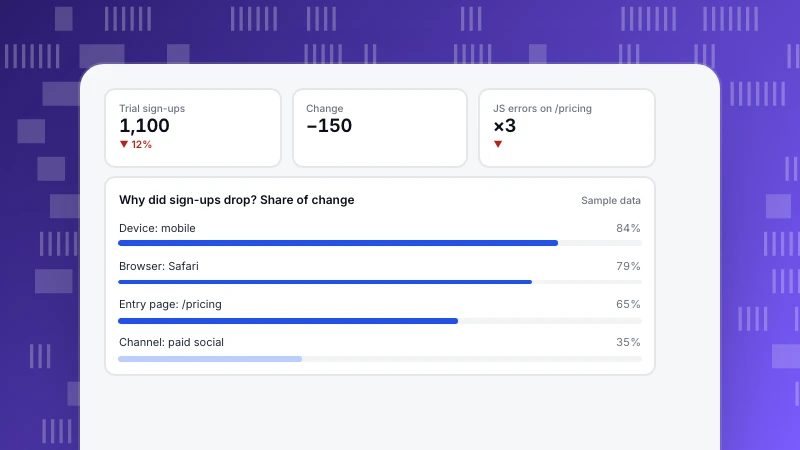
AI conversion rate optimization: what it does, limits and how to start
How AI is used across conversion rate optimization: finding and explaining drops, generating ideas, testing and personalization. Limits, five steps and an attribution example.
Read more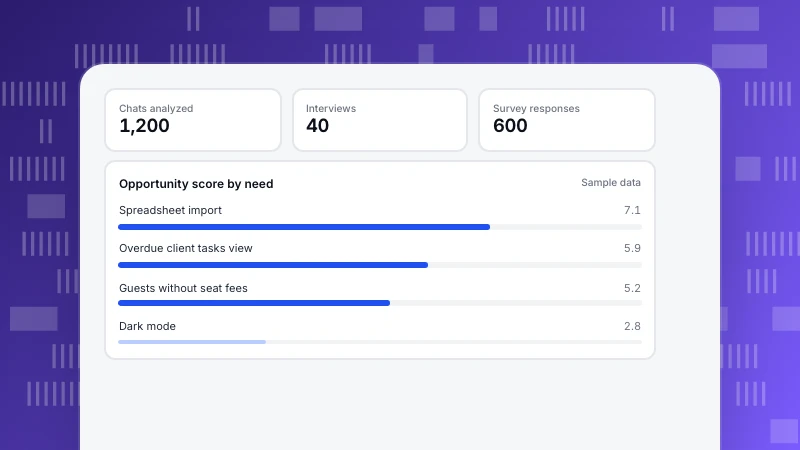
Customer needs analysis: methods, steps and an example
How to run a customer needs analysis: types of needs, what customers say vs what they do, six steps, an opportunity-score example and mistakes to avoid.
Read more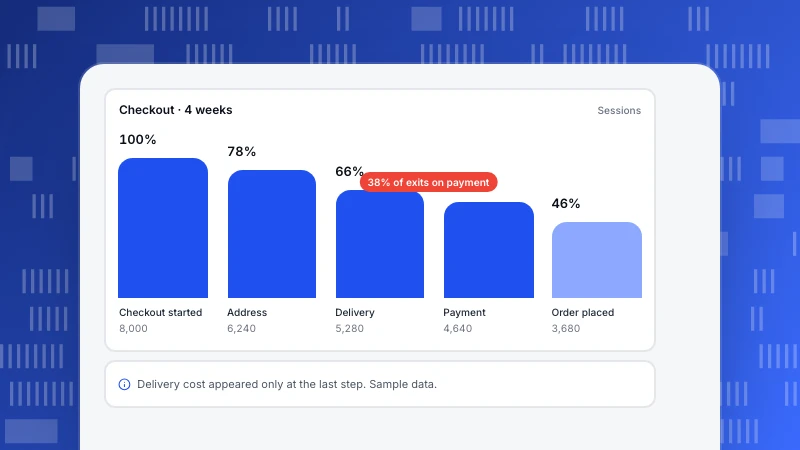
UX audit: how to do one in 7 steps (with checklist)
A UX audit finds usability problems and ranks what to fix. Expert review vs data-driven review, seven steps, a measurable checklist, a checkout audit example and FAQ.
Read more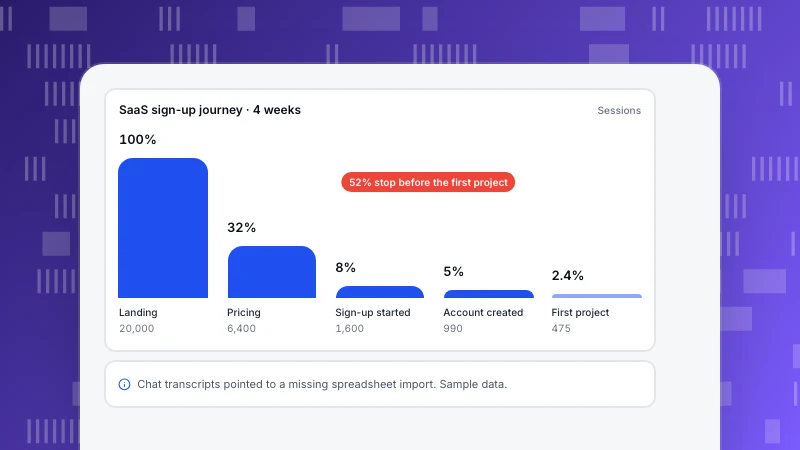
Customer journey optimization: find and fix the stage that loses customers
Customer journey optimization measures the journey customers already take and fixes the stage where they stall. Six steps, a SaaS sign-up example with friction signals, mistakes and a FAQ.
Read more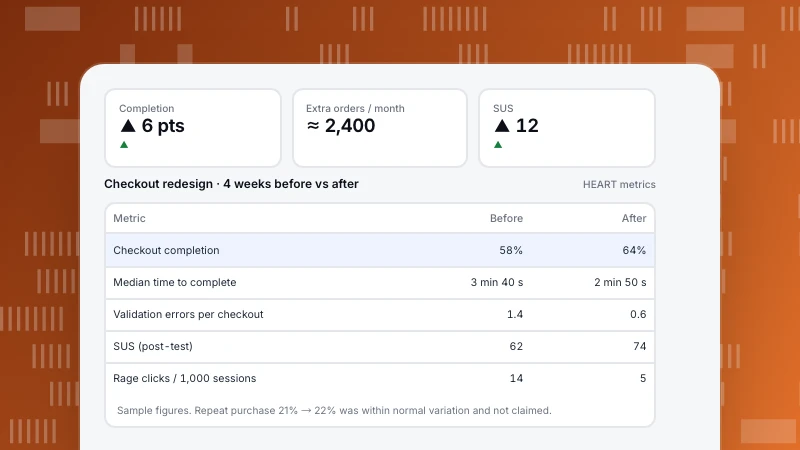
UX metrics: what to measure, the HEART framework and a worked redesign
The UX metrics that matter, behavioral and attitudinal, with how to measure each; Google’s HEART framework with goals, signals and metrics; and a worked checkout redesign measured before and after.
Read more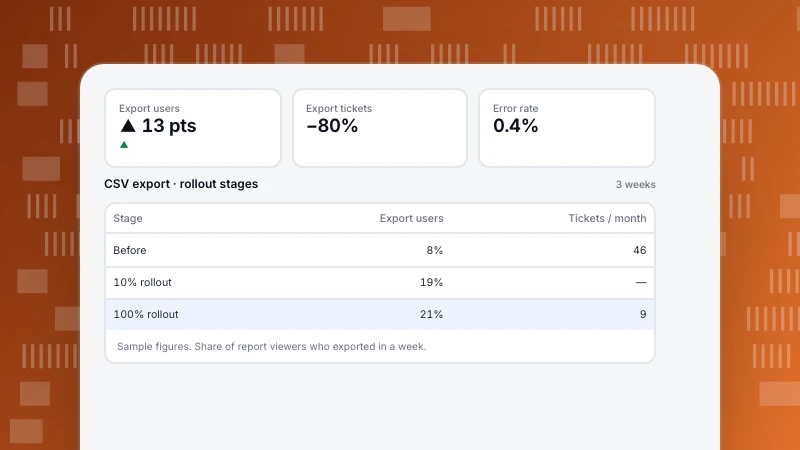
What does a product engineer do? Role, skills and a feature end to end
A product engineer owns product outcomes, not just code. How the role differs from software engineers and product managers, daily responsibilities, skills, and a worked feature from support tickets to full rollout.
Read more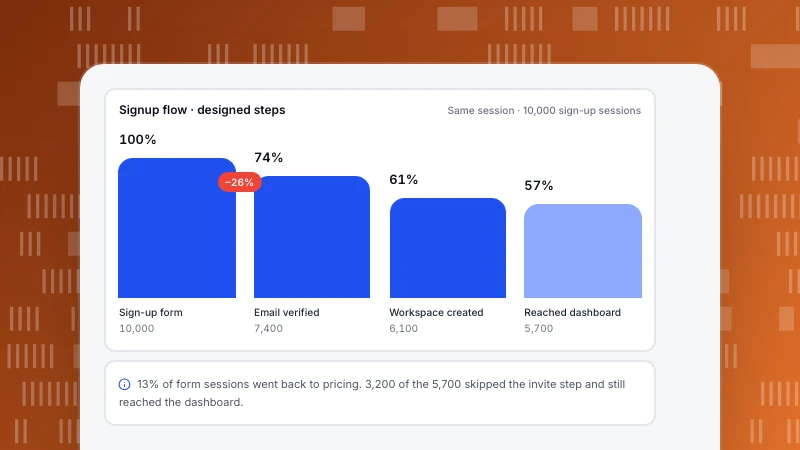
User flow: how to create one, examples and how to check it against real paths
What a user flow is, how it differs from a user journey and a wireflow, six steps to create one, four examples, and a worked signup flow compared with the paths 10,000 sessions actually took.
Read more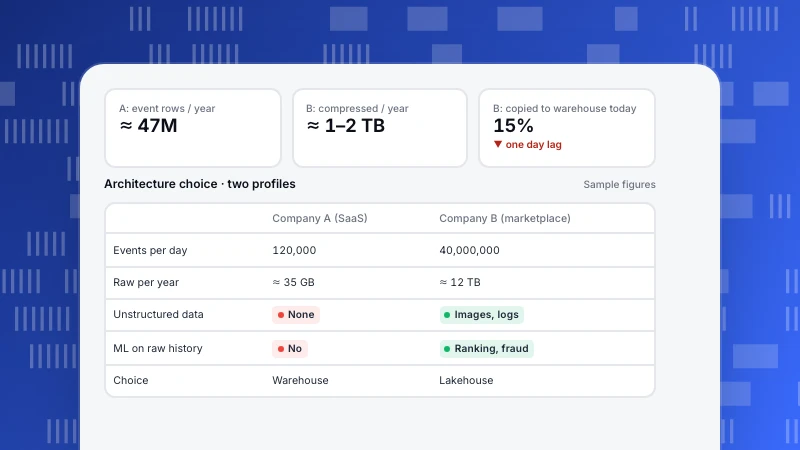
Data lakehouse vs data warehouse (and data lake): how to choose
A warehouse stores modeled tables for SQL, a lake stores raw files cheaply, and a lakehouse adds warehouse features to lake storage. A three-way comparison, why lakehouses appeared, two worked company examples and a decision checklist.
Read more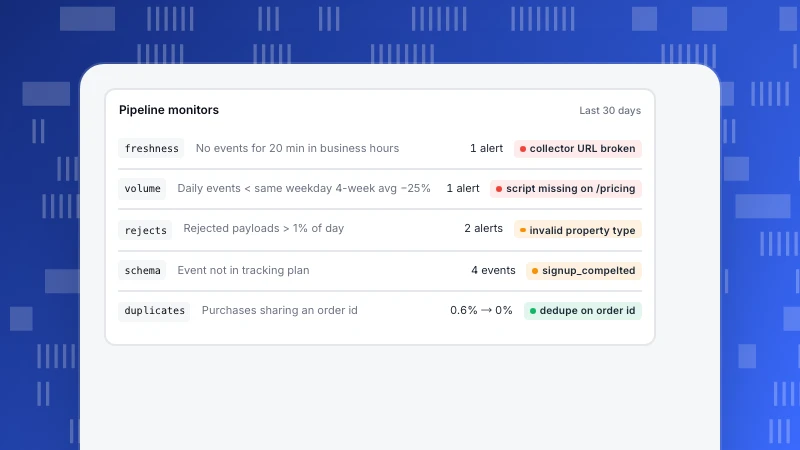
What is a data pipeline? Stages, types and an analytics example
A data pipeline moves data from where it is created to where it is used. The six stages and how each one fails, batch vs streaming, ETL vs ELT, and a worked event-pipeline example with duplicates, late data and the monitors that catch them.
Read more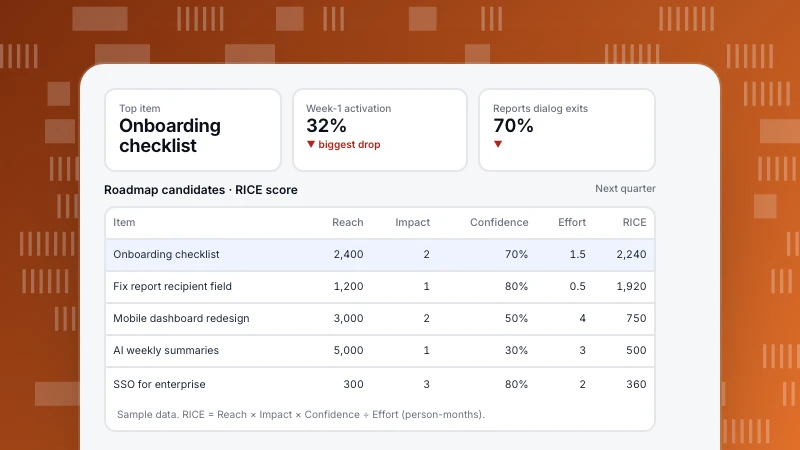
Product roadmap: types, how to build one and how to prioritize with data
A product roadmap links strategy to what gets built next. Four roadmap types compared, an 8-step process, a RICE prioritization example with reach taken from funnel data, and the mistakes that turn roadmaps into feature factories.
Read more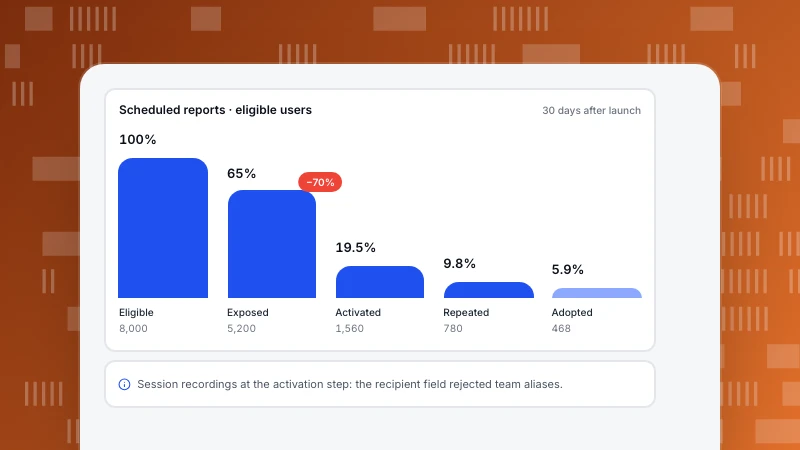
Feature adoption: the funnel, metrics and how to increase it
Feature adoption is whether users find, try and keep using a specific feature. The five-stage funnel, formulas for each metric, a worked example where 19.5% tried a feature but 5.9% adopted it, and tactics that target the real bottleneck.
Read more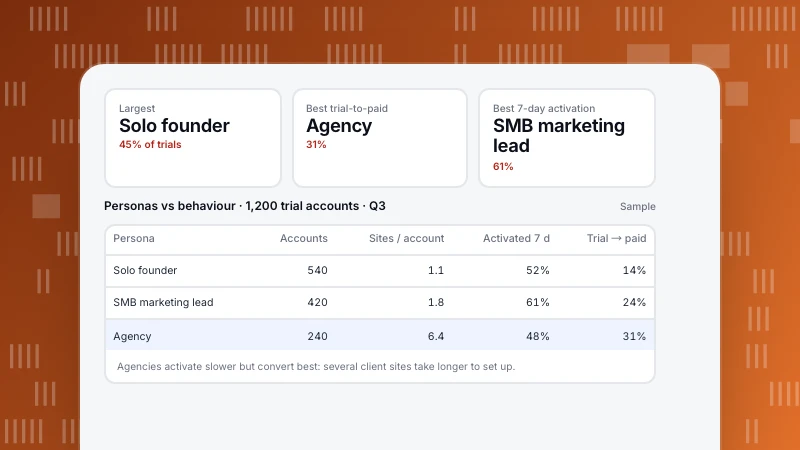
User Personas: How to Build Them From Real Data
A user persona is a short profile of a type of user, built from research. What to include, how personas differ from segments, how to check them against usage data, and a sample of three personas with real behaviour behind them.
Read more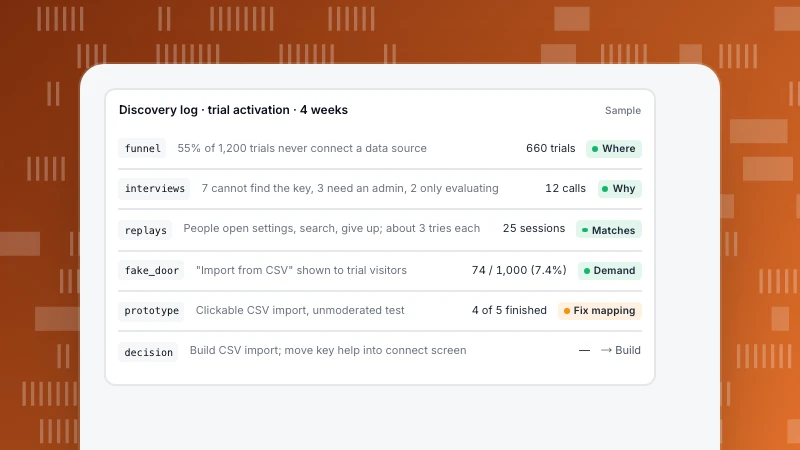
Product Discovery: How to Decide What to Build, With Evidence
Product discovery is the work of finding out what is worth building before you build it. The four risks to test, the methods for each, a worked case from usage data to a decision, and a weekly cadence that keeps it going.
Read more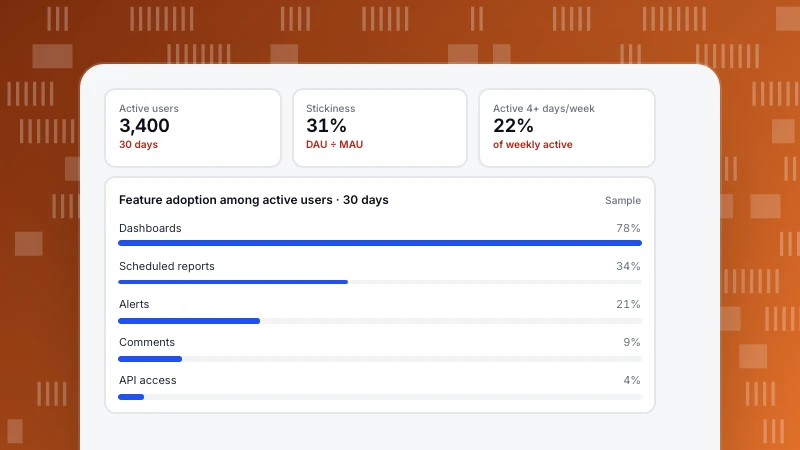
Product Usage Analytics: The Five Metrics and How to Use Them
Product usage analytics measures how people use your product: which features, how often and how deeply. Five usage metrics with formulas, user vs account views and a sample feature table that led to a decision.
Read more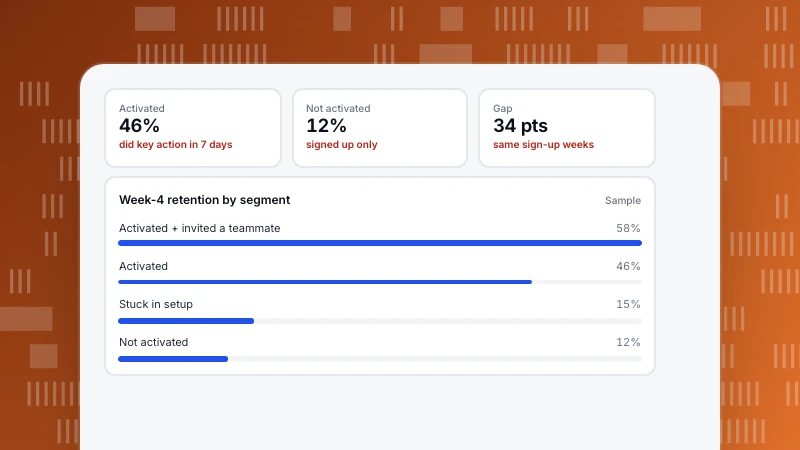
User Segmentation Examples: 12 Segments You Can Build From Event Data
Twelve user segmentation examples a product or growth team can build from event data, each with the rule and what to do with it. Plus a sample comparing two segments and how to keep segments useful.
Read more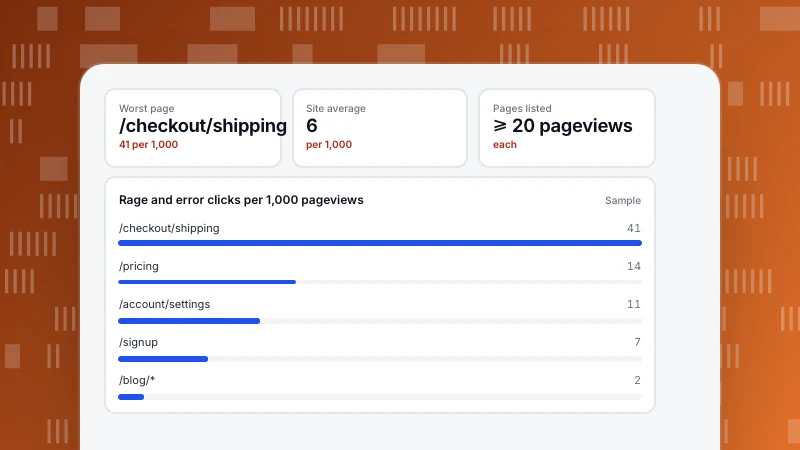
User Friction: How to Find It in Your Data and Fix It
User friction is anything that slows people down or stops them reaching their goal. The signals that reveal it in behaviour data, a sample where rage clicks pointed to the fix, and a routine for ranking friction points.
Read more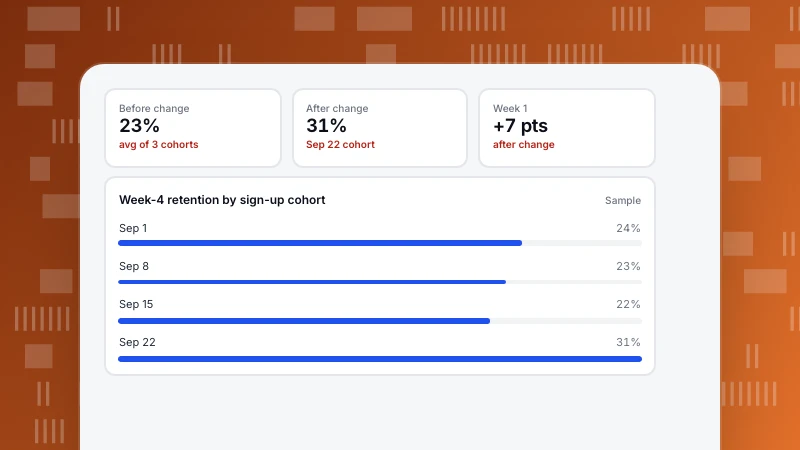
How to Do Cohort Analysis: Six Steps and How to Read the Table
A step-by-step guide to cohort analysis: choose the start and return events, the period and the counting mode, then read the table by rows, columns and diagonals. With a sample weekly cohort table.
Read more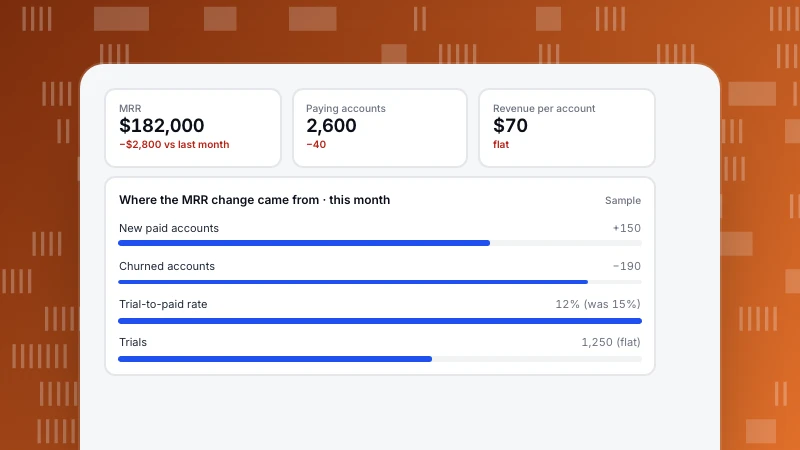
Metric Tree: How to Build One and Use It to Explain Changes
A metric tree breaks one top metric into the drivers that produce it. How to build one in five steps, a sample tree with numbers, how to use it to explain a drop, and how to keep it in your analytics.
Read more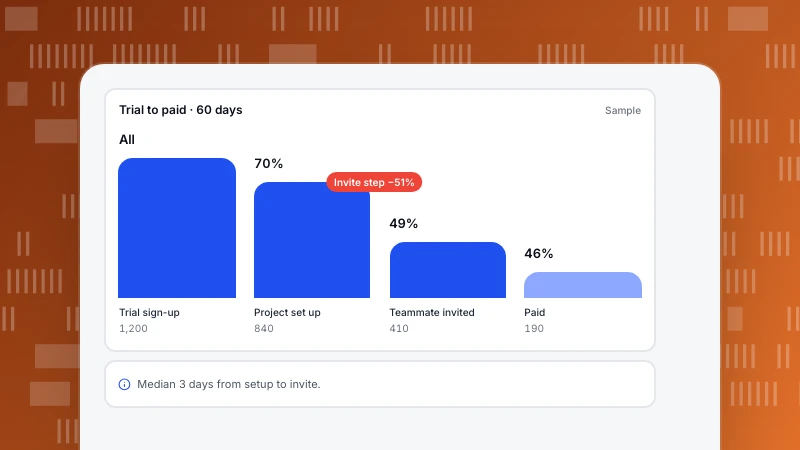
Customer Journey Analytics: From Journey Map to Measured Paths
Customer journey analytics measures how people actually move from first visit to purchase and beyond. The four analyses it is built from, which question each answers, and a sample from trial to paid.
Read more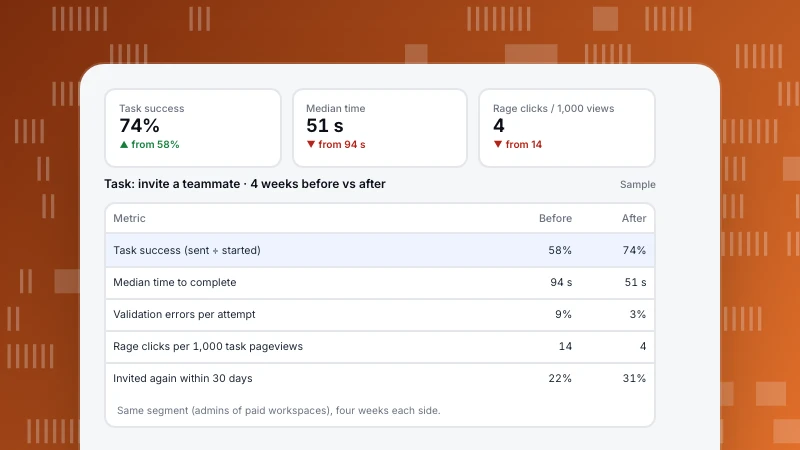
UX Analytics: Measure Whether a Task Got Easier
UX analytics uses behaviour data to measure how easy it is for people to complete tasks in your product or site. Five task metrics, how to define them in events, and a before-and-after example of a redesigned flow.
Read more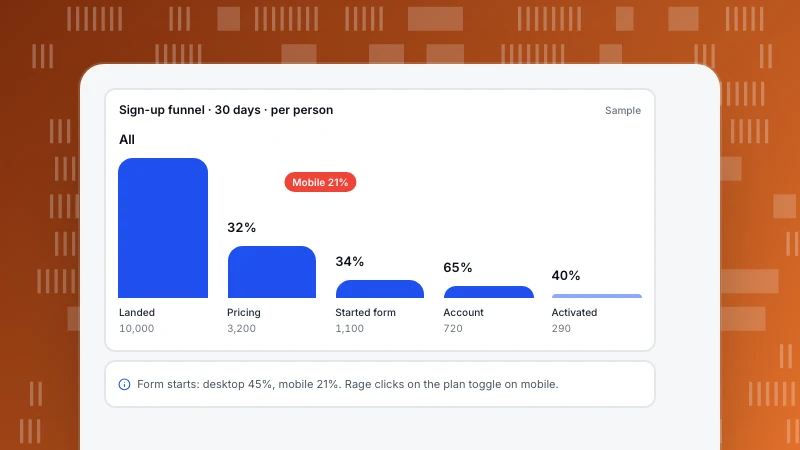
Conversion Funnel Optimization: Pick the Step You Can Move, Not the Biggest Drop
Funnel steps multiply, so a 10% lift on any step adds 10% to the end result. How that changes which step to optimise, a six-step loop from measurement to test, and a worked SaaS sign-up funnel.
Read more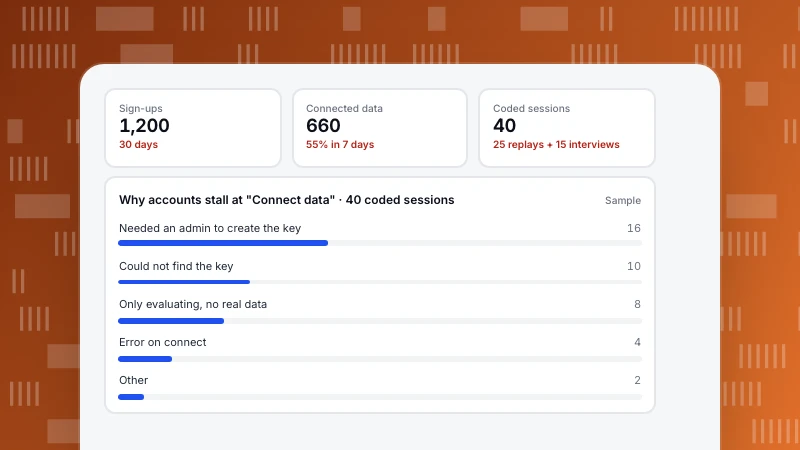
Qualitative vs Quantitative Data: What Each Tells You, and How to Use Both
Quantitative data counts and measures: how many, how often, how much. Qualitative data describes: why, how it felt, what people expected. A comparison table and a product example where numbers find a drop and interviews explain it.
Read more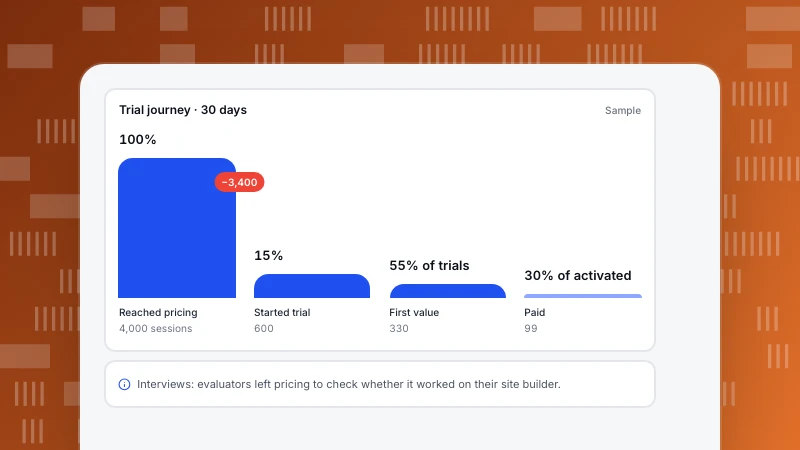
How to Create a Customer Journey Map That Uses Real Data
A customer journey map lays out the stages a customer goes through, what they do and feel at each one, and where they get stuck. Six steps to build one from research and analytics, with a filled-in SaaS example.
Read more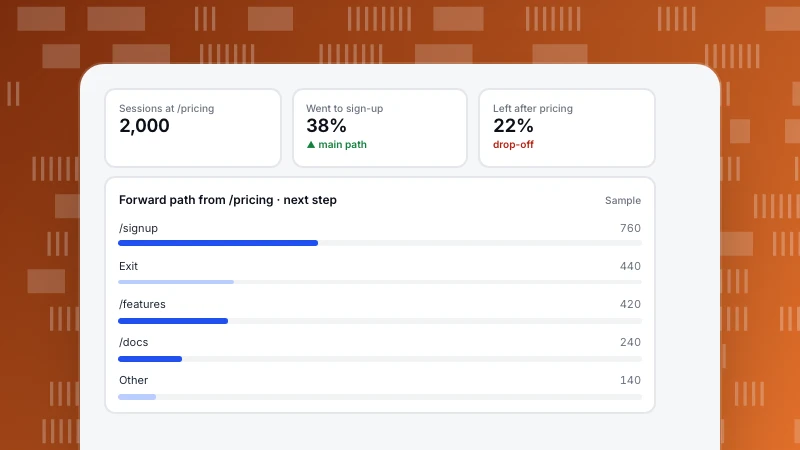
Behavioral Analytics: Five Questions, Five Analyses, and How to Start
Behavioral analytics looks at what people do on your site or product, in what order and how often, rather than how many arrived. Five questions it answers, the analysis for each, what you need tracked, and a one-week plan to start.
Read more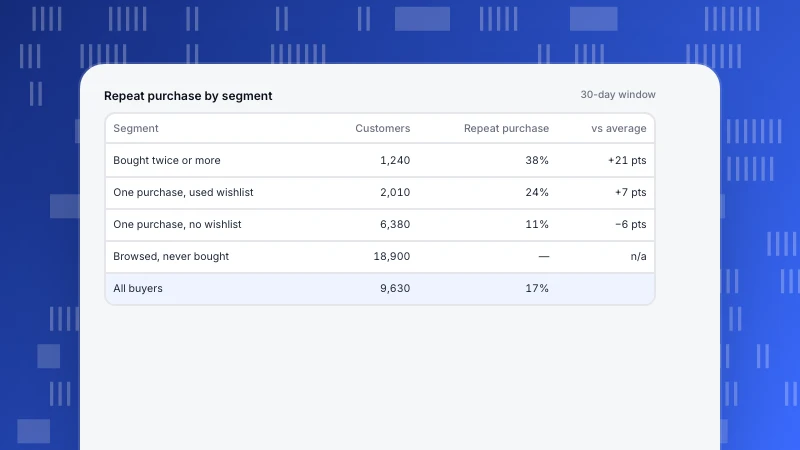
Customer Segmentation Analysis: Five Steps from Question to Action
Customer segmentation analysis in five steps: start from a decision, choose variables you can observe, compare segments on the same KPI, check size and stability, then act and measure again.
Read more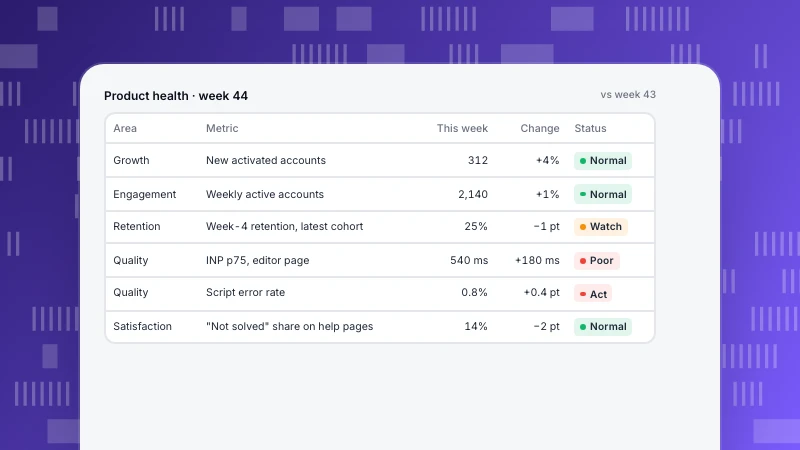
Product Health Metrics: A Weekly Scorecard That Includes Quality
Product health metrics in five areas (growth, engagement, retention, quality, satisfaction) on one weekly scorecard, with thresholds that turn a number amber or red and a routine for reviewing it.
Read more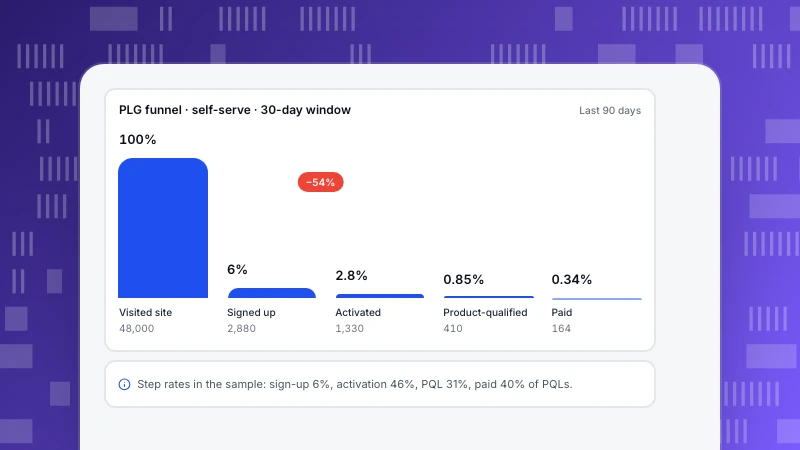
Product-Led Growth Metrics: One Funnel from Visitor to Expansion
PLG metrics as one connected funnel from visitor to expansion: the event behind each metric, how to define a product-qualified lead from usage, and how to measure team products by account.
Read more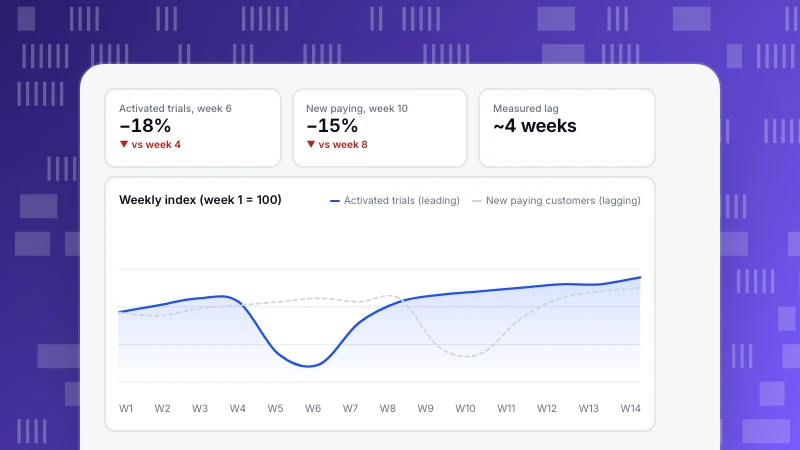
Leading vs Lagging Indicators for Product and Growth Teams
Leading vs lagging indicators with product and website examples by funnel stage, a method to find and validate a leading indicator in your own data, and how to alert on it.
Read more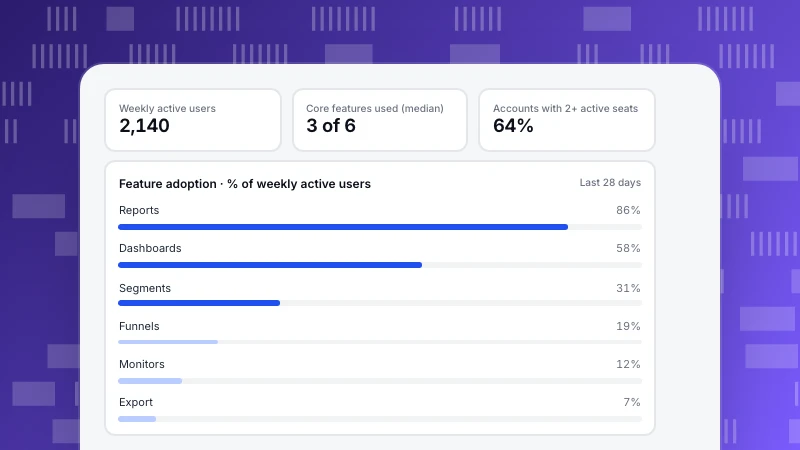
How to Measure Product Adoption, Feature by Feature
How to measure product adoption with events: how it differs from activation, the four dimensions of feature adoption, choosing the right denominator, and account-level adoption for B2B products.
Read more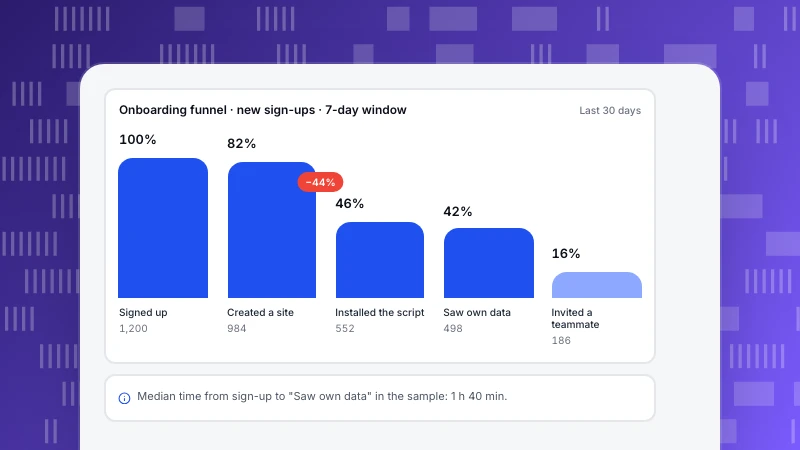
User Onboarding Metrics: Activation, Time to Value and the Funnel
Onboarding metrics for software products: how to define activation and test it, build the onboarding funnel from events, measure time to value, and tie onboarding to retention.
Read more