Try it on your own data
Every report in this article is in the free plan. One snippet for web and apps, up to 10 sites.
Start freeCohort analysis groups people by when they started and follows each group over time. It answers questions an average cannot: are newer users staying longer than older ones, did last month's change work, when do most people drop off? This guide walks through the six choices you make when building one and how to read the result.
What you will learn
- A cohort analysis needs five choices: start event, return event, period, counting mode and alignment
- Read the table three ways: rows for one cohort's life, columns for comparing cohorts, diagonals for calendar events
- Leave unfinished periods out and check cohort sizes before comparing
What cohort analysis shows
A cohort is a group of people who share a starting point, usually the week or month they signed up. Cohort analysis follows each group over time and shows what share is still active after one, two or more periods.
Because every group is measured from its own start, you can compare newer users with older ones fairly, even while the total user base is growing.
Step 1: Choose the start event
The start event decides who enters a cohort and when. Common choices:
- Sign-up for product retention.
- First purchase for repeat buying.
- First use of a feature for feature retention.
Count only the first time someone did it, so people are not counted in several cohorts. In TapCub this is the default: only people whose first start event in history falls in the cohort are included.
Step 2: Choose the return event
What counts as "still here"? Any activity is the easiest, but a meaningful action, such as creating a report or placing an order, tells you more. A return event that is too easy makes retention look better than it is.
Step 3: Choose the period
Match it to how often people should use the product. A daily app uses days; a weekly planning tool, weeks; a subscription billed monthly, months. In TapCub, days go up to 30 periods and weeks or months up to 12; the default is 14 days.
Step 4: Choose the counting mode
- Returned in period N: the classic retention table; values can rise and fall.
- Returned in period N or later: a curve that never rises, good for "how many have gone for good".
- Number of periods returned: a distribution of how often people came back.
Step 5: Choose the alignment
Align each person to their own start (day 7 means seven days after they signed up), or align to calendar weeks or months. Personal alignment is fairer for retention; calendar alignment is easier to match with reports.
Step 6: Read the table
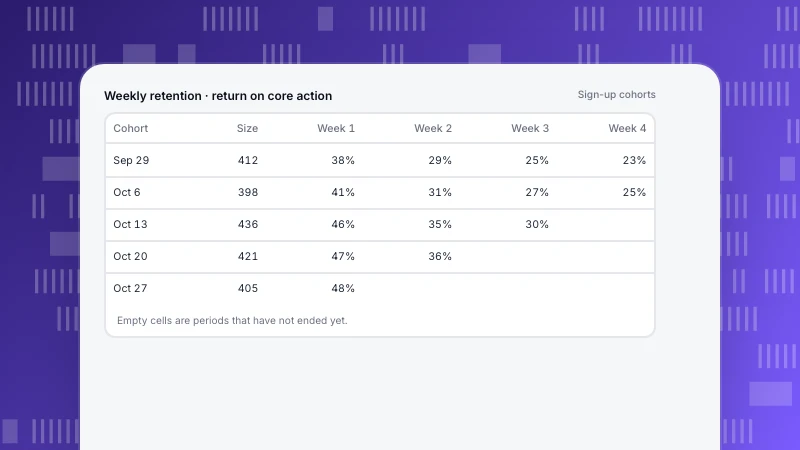
The table shows five weekly cohorts. Read it three ways:
- Rows: one cohort's life. The Sep 1 cohort falls from 42% in week 1 to 18% by week 8, and the drop slows after week 4.
- Columns: cohorts compared at the same age. Week 4 sits around 22–24% for the first three cohorts, then jumps to 31% for Sep 22.
- Diagonals: the same calendar week across cohorts. A dip along a diagonal points to something that happened that week, such as an outage or a holiday.
| Cohort (week of sign-up) | Size | Week 1 | Week 2 | Week 4 | Week 8 |
|---|---|---|---|---|---|
| Sep 1 | 820 | 42% | 31% | 24% | 18% |
| Sep 8 | 760 | 40% | 30% | 23% | 17% |
| Sep 15 | 910 | 41% | 29% | 22% | — |
| Sep 22 | 880 | 48% | 38% | 31% | — |
| Sep 29 | 840 | 49% | 39% | — | — |
Sample data. "—" means the period has not ended yet. Onboarding changed on Sep 20.
A worked example
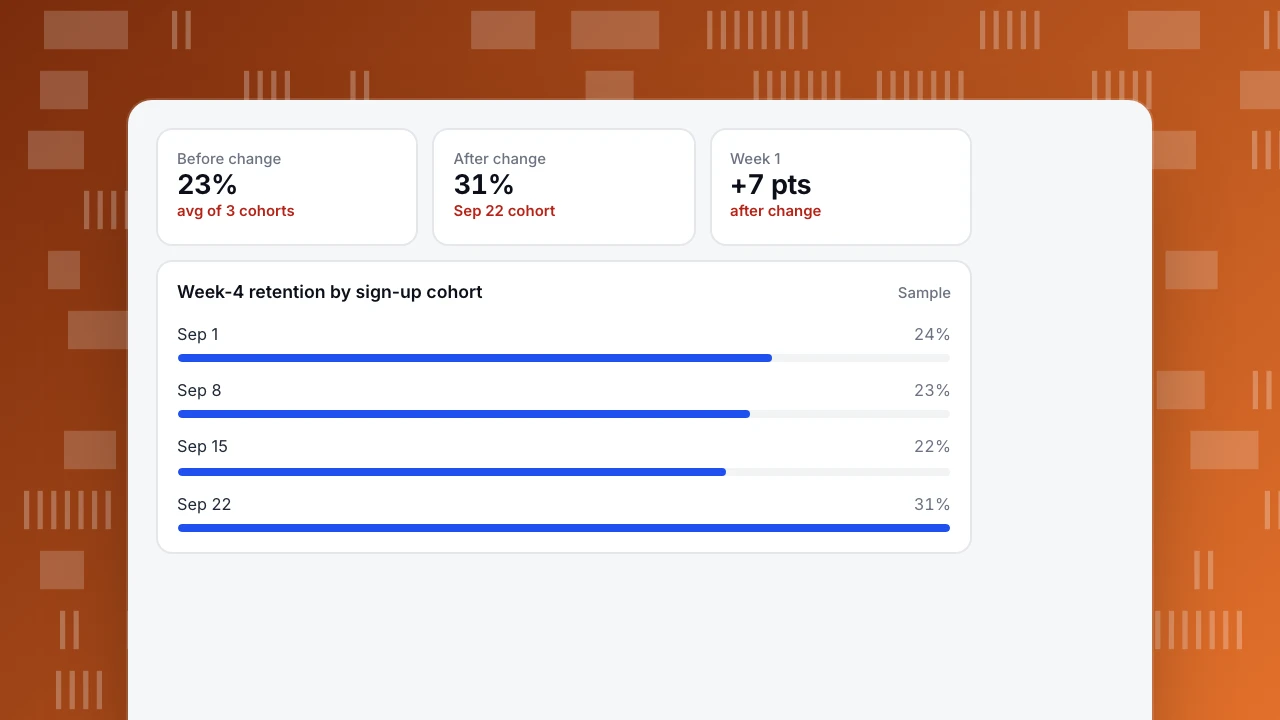
The team changed onboarding on Sep 20. The columns show the effect: the Sep 22 and Sep 29 cohorts keep 7 to 8 points more in week 1 and about 8 more in week 4. Cohort sizes are similar, so the change is not just a different mix of people. The next step is to confirm it holds at week 8.
Before change
23%
avg of 3 cohorts
After change
31%
Sep 22 cohort
Week 1
+7 pts
after change
Week-4 retention by sign-up cohort
SampleMistakes to avoid
- Counting unfinished periods as zero. A period that has not ended should be blank. TapCub leaves it empty.
- Comparing tiny cohorts. A cohort of 40 people swings by several points by chance.
- Reading only the average line. It is weighted by cohort size and can hide a change in recent cohorts.
- Changing the return event between runs. Keep the definition fixed when comparing.
FAQ
What is an example of cohort analysis?
Grouping users by sign-up week and comparing what share of each group is still active in week 4, before and after an onboarding change.
How many cohorts do I need?
At least three or four before a change and two or three after, each large enough to be stable.
What is the difference between cohort analysis and segmentation?
Cohorts group people by when they started; segments group them by who they are or what they did. You can combine both, for example cohorts filtered to one country.
Related: what is a good retention rate and cohort.
See also: Build a retention report.
See also: Behavioral cohort, Retention curve.
Was this article helpful?
We use your answers to fix and expand this page.
Couldn’t send. Please try again in a minute.
Thanks for the feedback. We’ll use it to improve this page.You’ve already sent feedback on this page. Thanks.

Product Analyst
Focuses on event analysis, conversion funnels, and retention, using clear metric definitions and structured analysis to explain product performance.