Product News
Release notes with the reasoning attached. Each article explains a new capability, the problem it solves and the setting that enables it.
Product articles accompany larger releases. Where the changelog lists what changed, these notes explain the design decisions, show the new screens with sample data, and link to the help article for setup. Smaller changes stay in the changelog.
Articles in Product News
64 articles · page 1 of 2
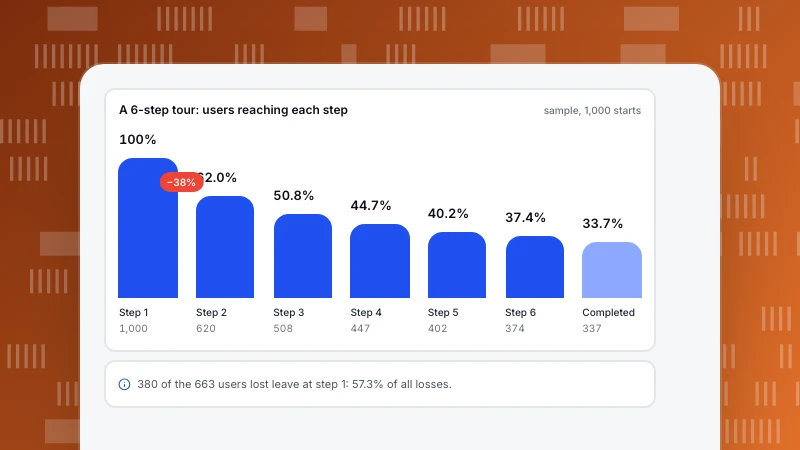
SaaS Product Tour: How Many Steps Before Completion Drops
In published benchmarks, product tour completion falls from 73% at one or two steps to 8% at nine or more. See a worked completion funnel, where users leave, what cutting steps gains and how to prove a tour works.
Read more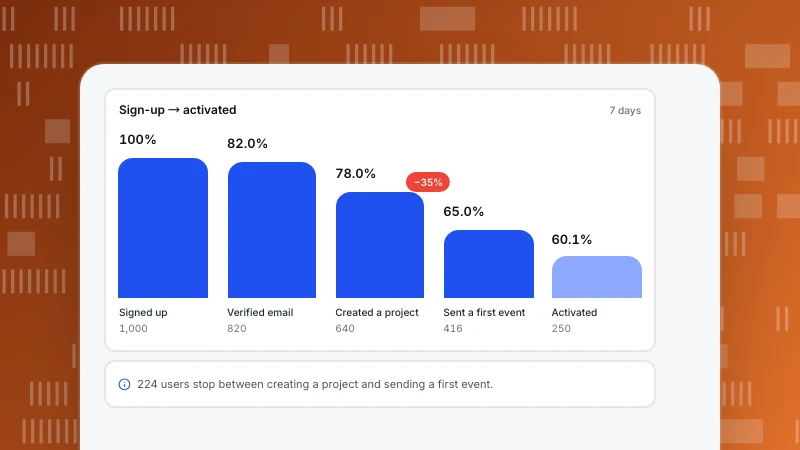
SaaS onboarding: build the flow around activation, with the funnel math
SaaS onboarding exists to get new users to activation. How to pick the activation event from your data, compute the activation funnel, estimate a fix in users, and measure it with the right metrics and an honest benchmark.
Read more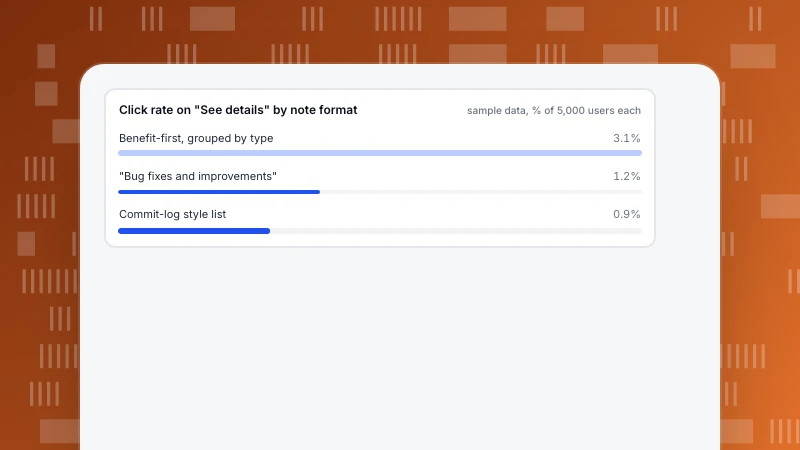
Release notes examples: annotated good and bad notes
Release notes examples with annotations: two bad ones and why they fail, two good ones and why they work, a channel length table and a sample click comparison of three formats.
Read more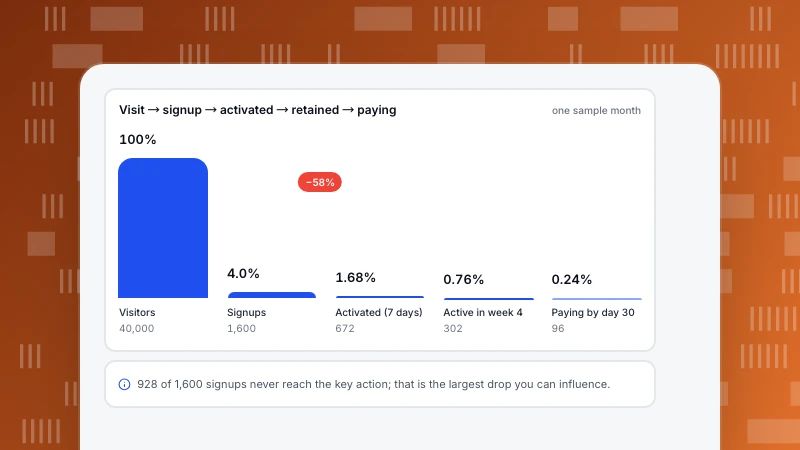
Product Metrics: The Four Groups to Track, With Formulas
Product metrics grouped by acquisition, activation, retention and revenue, each with a formula and a sample value, plus one cohort carried from visit to payment and rules for how many to track.
Read more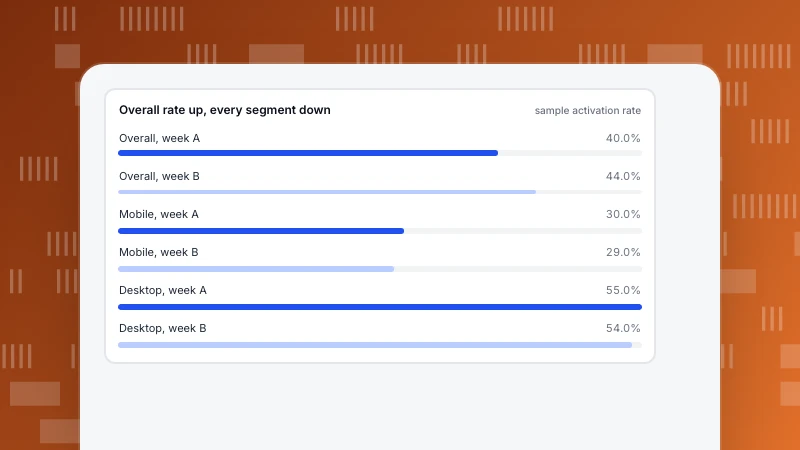
Product benchmarking: compare your usage metrics the right way
Benchmark how people use your product, not only rival features. Build a band from your own 12 weeks, test any outside number for definition and unit, and avoid a mix shift that fakes an improvement.
Read more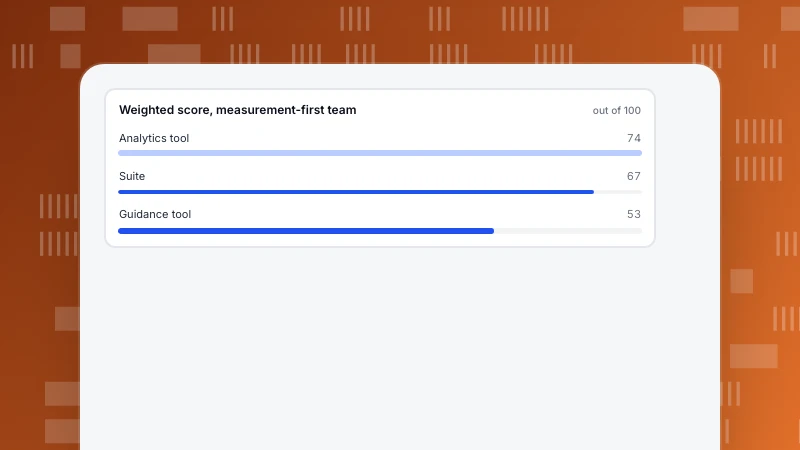
Product adoption software: how to choose and compare it
Product adoption software covers analytics, in-app guidance or both. Test any candidate against one adoption rate you computed yourself, score six criteria with your own weights, and run a one-week trial.
Read more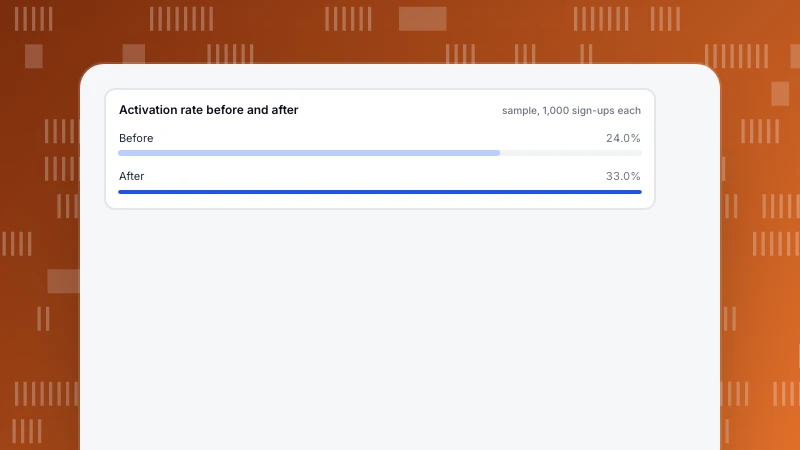
Onboarding Examples: Six Patterns and the Activation Numbers Behind Them
Six onboarding patterns, what each targets and how it fails, with a worked before-and-after funnel (24.0% to 33.0% activation), how to pick the activation event and how to roll out changes.
Read more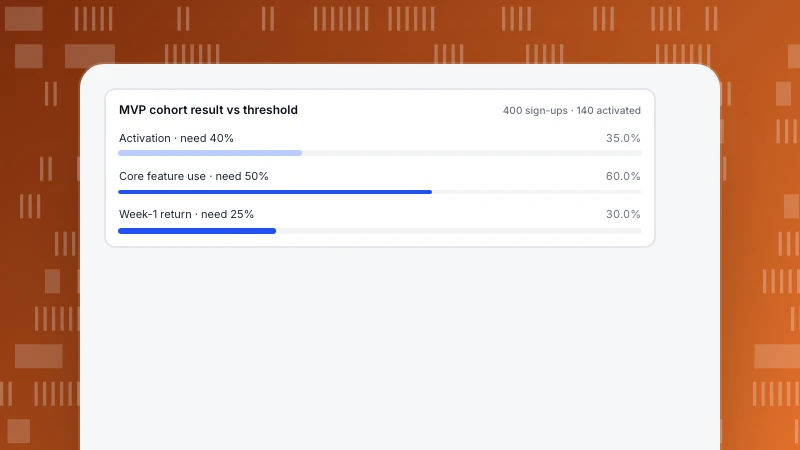
MVP Product Development: A Seven-Step Process With Metrics and a Stop Rule
MVP product development is a loop for learning, not shipping a small product. Seven steps, three metrics with thresholds fixed before launch, a worked 400-user result and a decision table for scale, iterate, pivot or stop.
Read more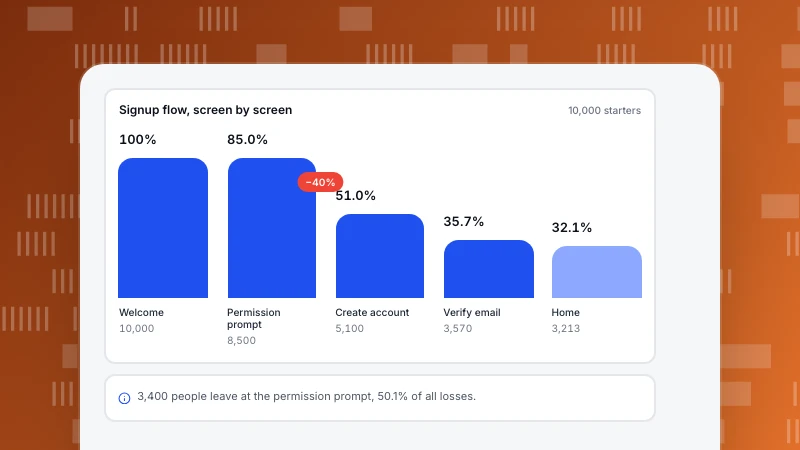
Mobile App UX Design: Principles You Can Check With Usage Data
Six mobile app UX design principles, each paired with the metric that validates it. A signup-flow example with drop-off by screen, a forecast of what a fix is worth, tap-target and stability thresholds, and what native app analytics can and cannot show.
Read more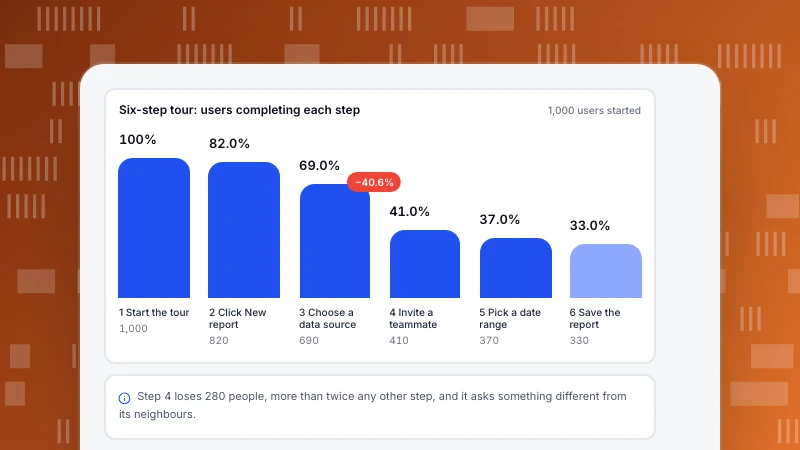
Interactive Product Tours: How to Structure Them and Measure Step Completion
Interactive product tours work when each step asks for one action and you measure the outcome. Structure rules, keyboard accessibility, five events to track and a computed six-step completion funnel.
Read more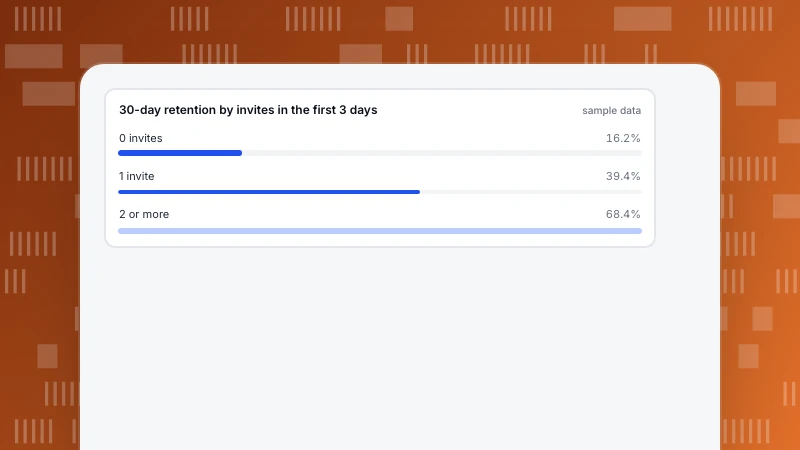
Find your aha moment with data: retained vs churned users
An aha moment is an early action that separates users who stay from users who leave. A six-step method with a worked example: compare retention per early action, find the threshold and check cause.
Read more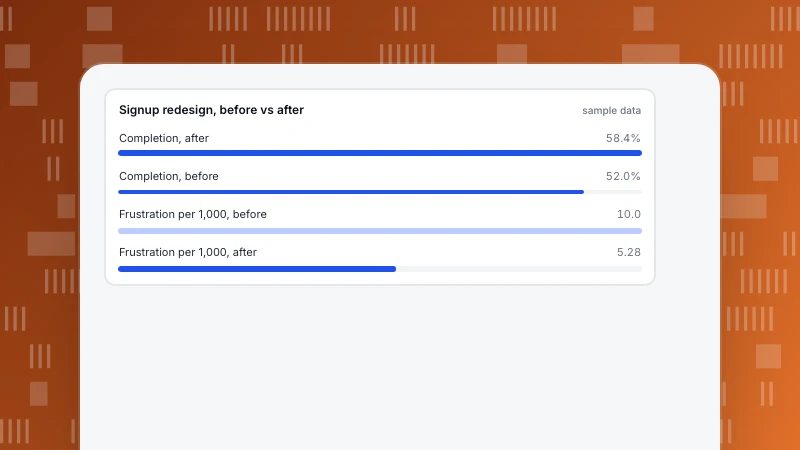
Emotional Design: Principles, Evidence and How to Measure It
Emotional design works on three levels: visceral, behavioral and reflective. Each leaves traces you can measure. A before-and-after example where completion rises significantly and retention does not yet, plus TapCub signals.
Read more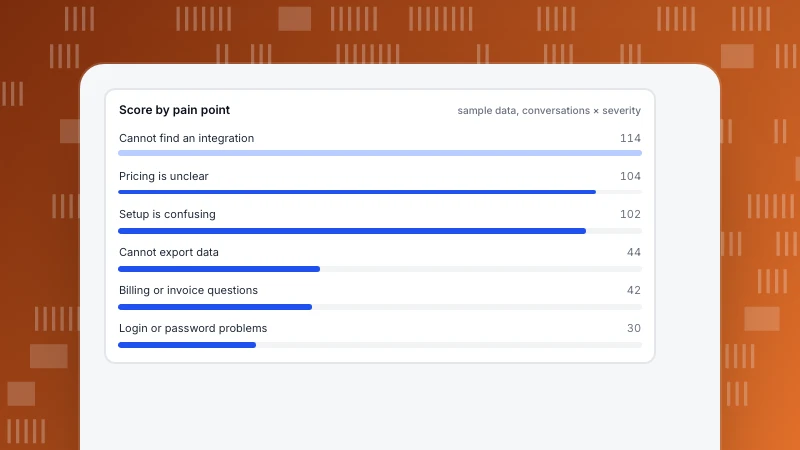
Pain points in business: how to find them in chat and behavior data
What pain points in business are and a five-step method to find them: tag 200 chat conversations, rank by frequency and severity, and confirm with behavior.
Read more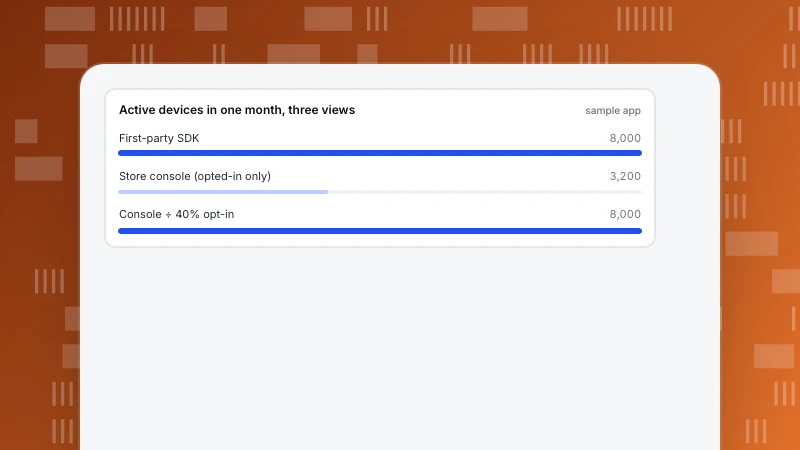
App usage analytics tools: market intelligence vs first-party data
"App usage tool" covers two different families: market-intelligence estimates for any app and first-party analytics for your own. How they compare, why their numbers differ, which metrics to track and how to evaluate a tool.
Read more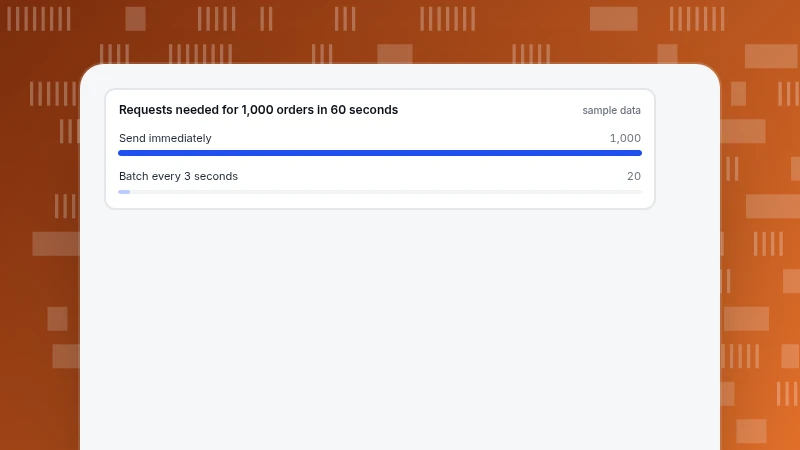
SDK vs API: Differences and When to Use Each for Tracking
SDK vs API for tracking: what each one is, the same purchase event sent three ways, a flash-sale example with retries and duplicates, and rules for choosing.
Read more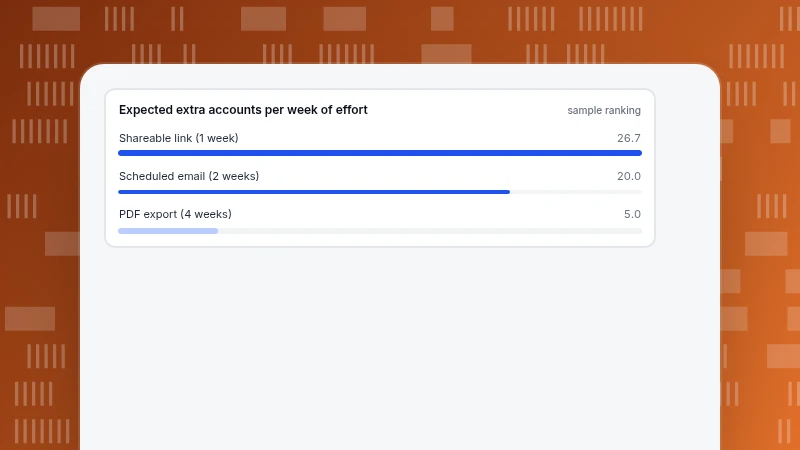
Product Thinking: How to Frame a Feature Request as an Outcome
Product thinking judges work by the customer-behaviour change it creates. One feature request run through output and outcome framing, five reframing questions, a worked ranking with numbers and how to track it.
Read more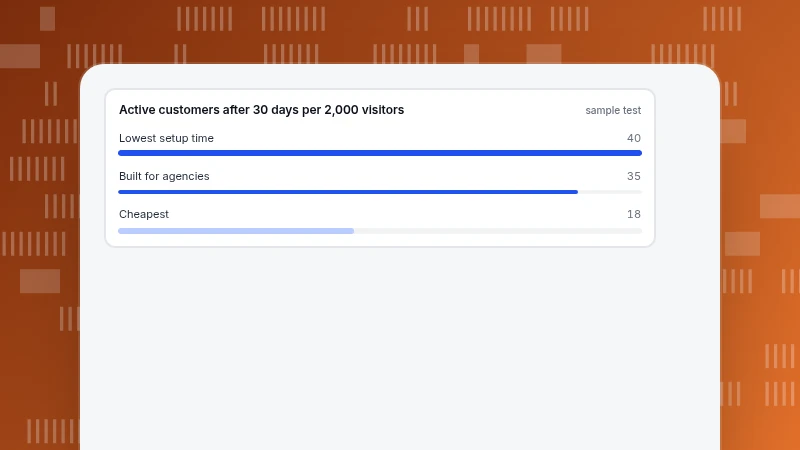
Product Differentiation Examples: 10 Companies and Their Numbers
Ten product differentiation examples sorted by price, feature, experience and niche, each with figures from the company's own filings, the ratio that shows the difference, and a way to test your own.
Read more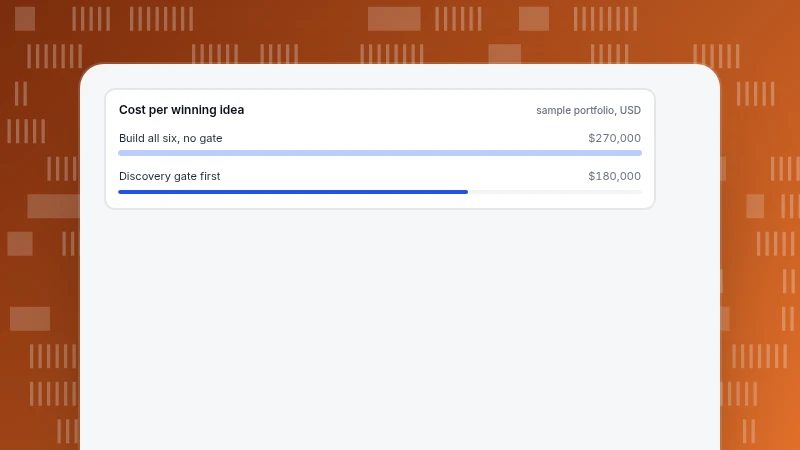
PDLC vs SDLC: How Product and Software Lifecycles Differ
PDLC decides what is worth building and whether it worked; SDLC decides how to build and ship it. A stage-by-stage table with owners and outputs, where Agile fits, and a worked example of what a gate saves.
Read more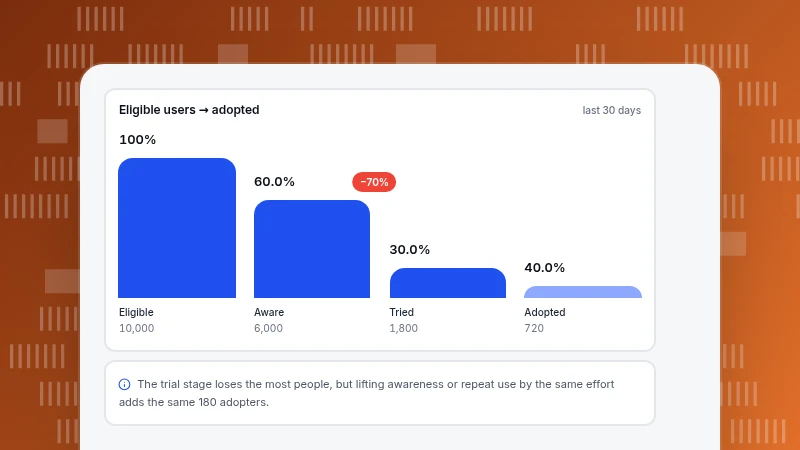
How to Increase Product Adoption: Fix the Stage That Is Blocked
Product adoption is blocked at one of three stages: never found it, tried once, or did not return. A blocker-to-tactic-to-metric table, a recomputed worked example and a sample-size rule for checking that a change worked.
Read more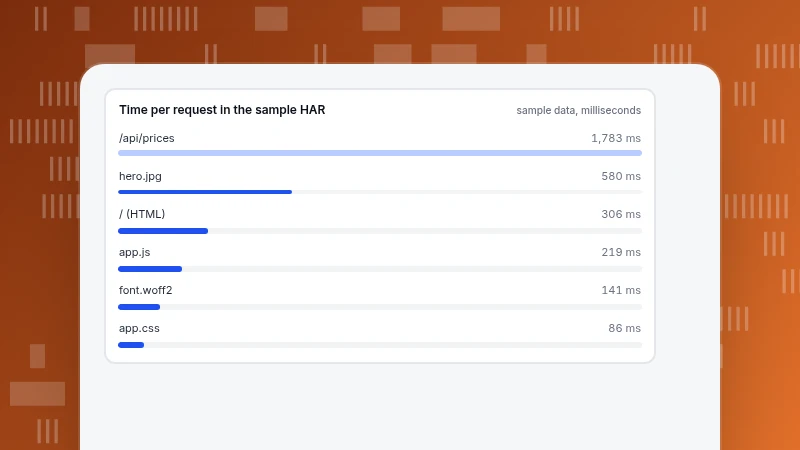
How to Open a HAR File and Find the Slow Request
How to open a HAR file in DevTools, a text editor or the command line, check it for sensitive data first, and read the timings. A six-request sample shows a slow server (92.5% wait) and a heavy image (82.8% download).
Read more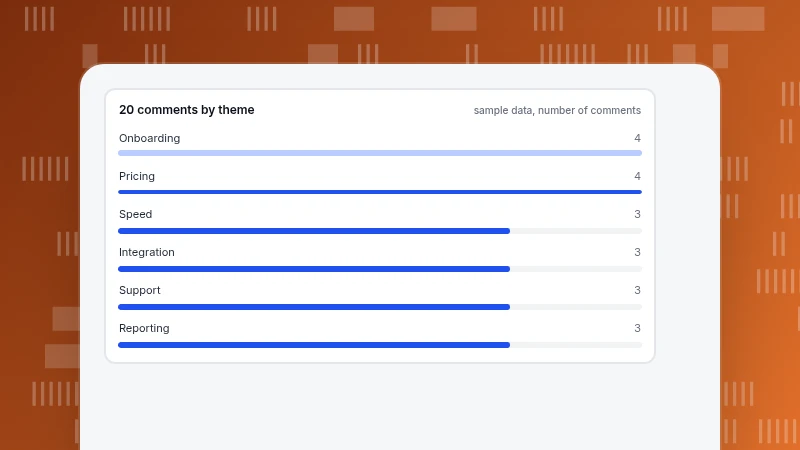
Feedback Analysis: Tag Comments Into Themes and Rank Them
Feedback analysis turns free-text comments into a ranked list of problems. A 20-comment sample is tagged into six themes with counts, ranked by blocked tasks first, and checked with a second reader and a small-sample interval.
Read more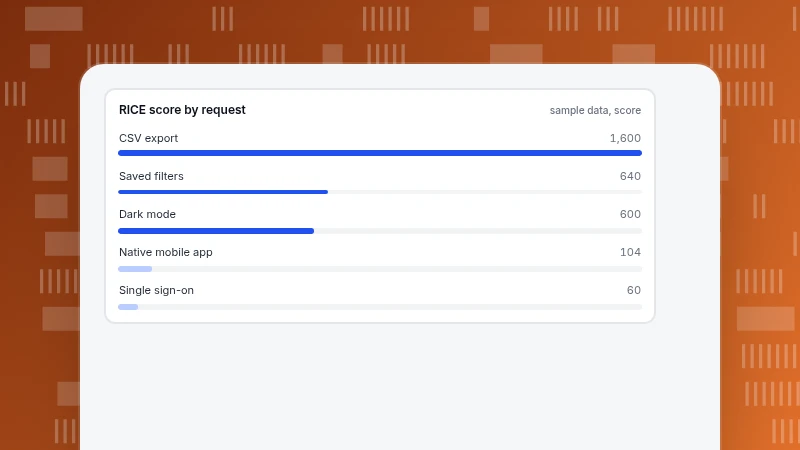
Feature Request Management: Collect and Score Requests with RICE
How to manage feature requests: record the problem, score each request with RICE, test whether the ranking survives changed estimates, and say no with a review date. Five sample requests worked through.
Read more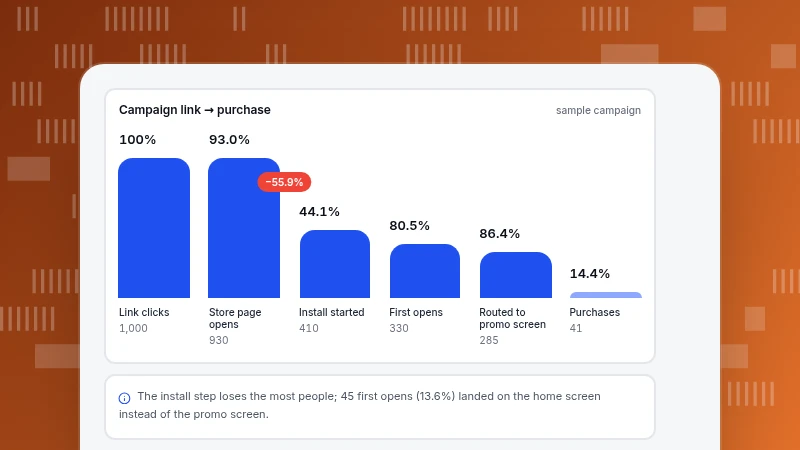
Deferred Deep Linking: How It Works and How to Track It
Deferred deep linking sends a person to a specific app screen even when the app was not installed at the tap. See the five-step flow, a sample funnel with recomputed rates, why routing fails and how to measure it.
Read more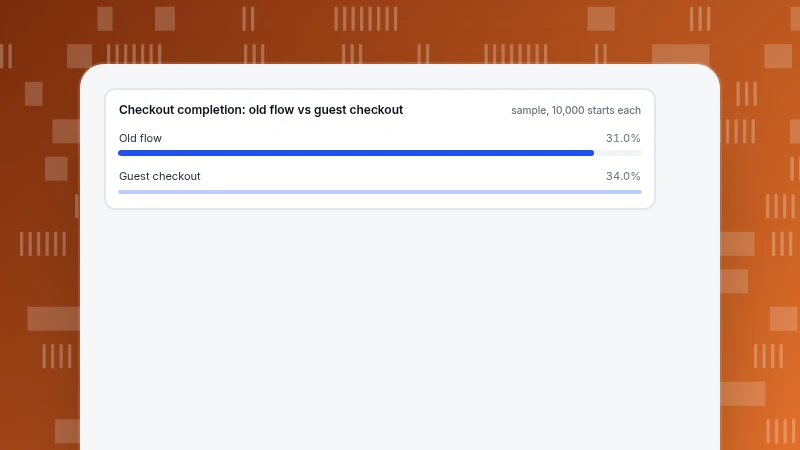
Customer Experience Examples: 10 Cases and the Metric Behind Each
Ten customer experience examples, each paired with the signal that shows it worked, with outside numbers from Baymard and web.dev and two recomputed worked examples for checkout and support.
Read more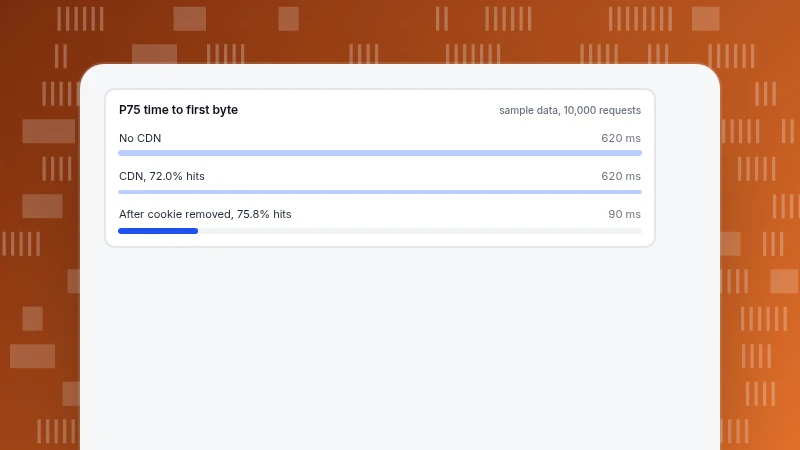
CDN cache: how it works and how to check your hit ratio
A CDN cache answers requests from a copy near the visitor. How to read cf-cache-status and Age, calculate a hit ratio from a day of requests, and why raising it from 72% to 76% cuts P75 first-byte time from 620 ms to 90 ms.
Read more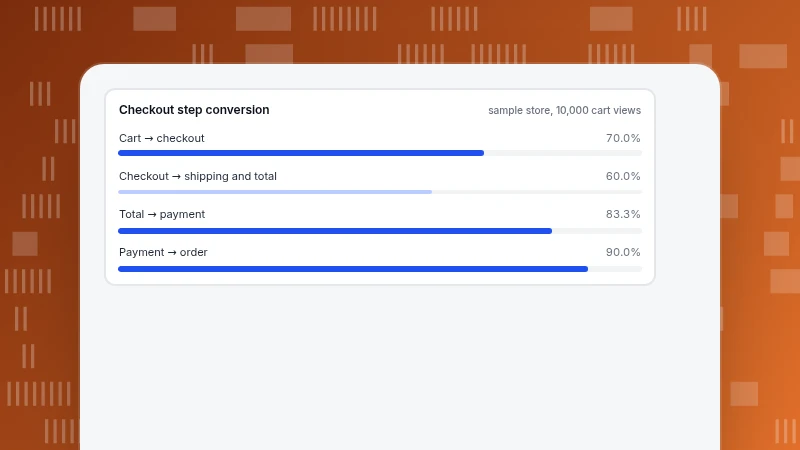
Bad UX: 10 Examples and the Metric That Exposes Each
Ten bad UX patterns, each paired with the analytics signal that exposes it and the threshold worth acting on, plus a worked checkout funnel and a way to prioritise fixes.
Read more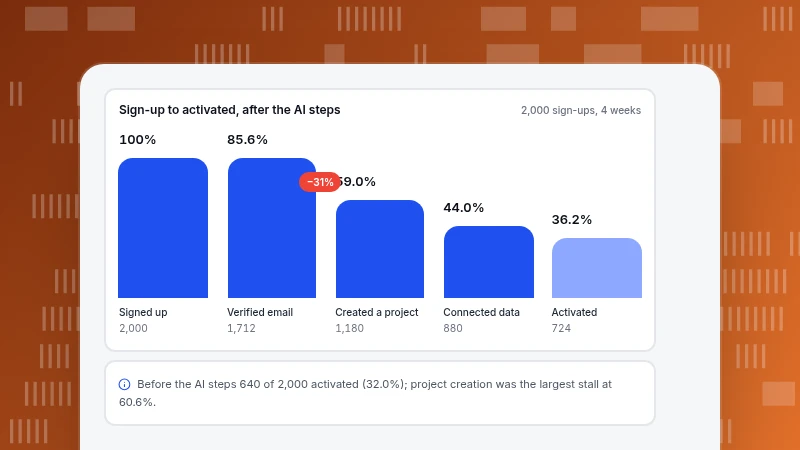
AI Onboarding: A Flow With AI Steps and Activation Before and After
AI onboarding puts AI at the steps where new users stall. A five-step flow, the activation metrics to judge it, and a worked before-and-after calculation with a confidence interval and the caveats.
Read more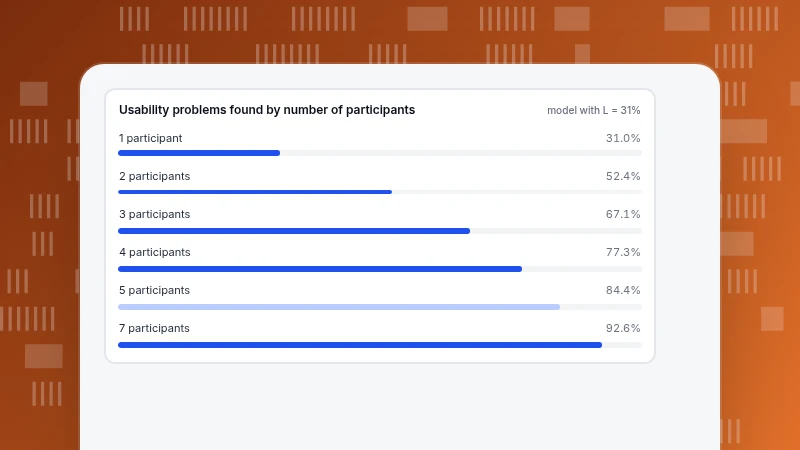
User Interface Design: 8 Principles and How to Test Each With Data
Eight user interface design principles, each paired with the published threshold behind it, the metric that tests it and the event or report that produces the number. Includes recomputed contrast ratios and a form-redesign z-test.
Read more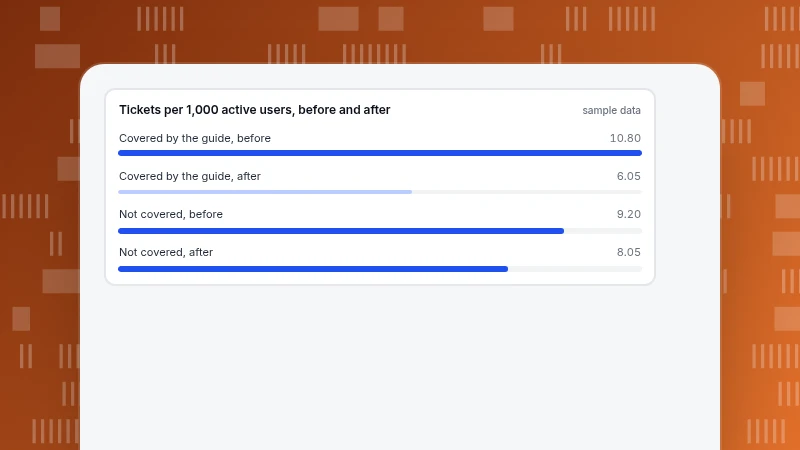
How to Write a User Guide: Structure, Annotated Outline and Testing
How to write a user guide that reduces support tickets: start from 90 days of tickets, use an annotated outline, write steps by Microsoft's rules, test with five people and measure the result per 1,000 users.
Read more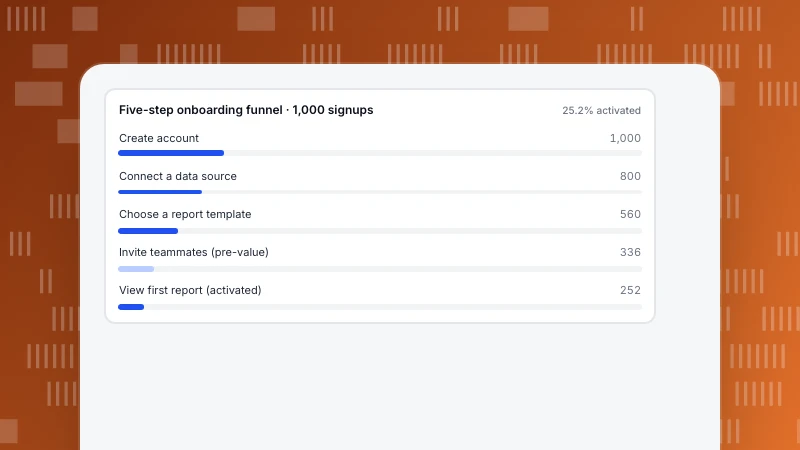
Onboarding flow: formats, design steps, and a worked funnel example
An onboarding flow ends when the user first gets value, not when they finish the tour. Compare four formats, design backward from activation, cut the biggest pre-value drop with a recomputable funnel example, and verify the change with cohorts.
Read more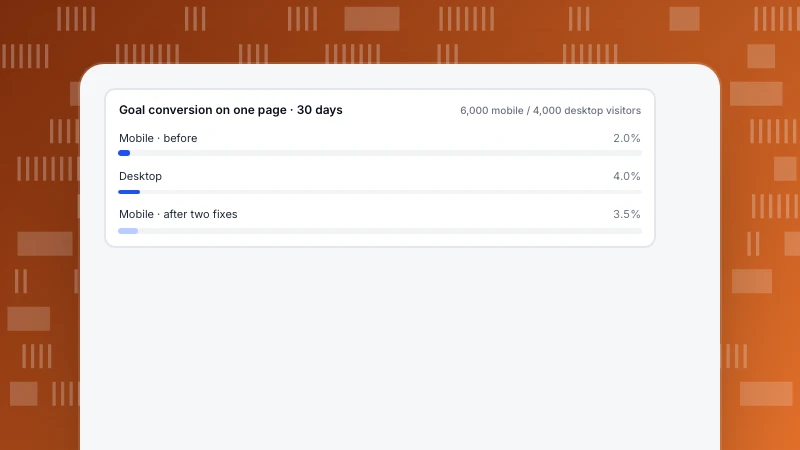
Mobile UX: Find the Problems in Your Data Before You Redesign
Mobile UX is the whole phone experience: loading, touch, navigation and error recovery. Find the five common problems in device-split data first — rage clicks, scroll cliffs, slow LCP — then fix them in priority order, with a recomputable mobile-vs-desktop example.
Read more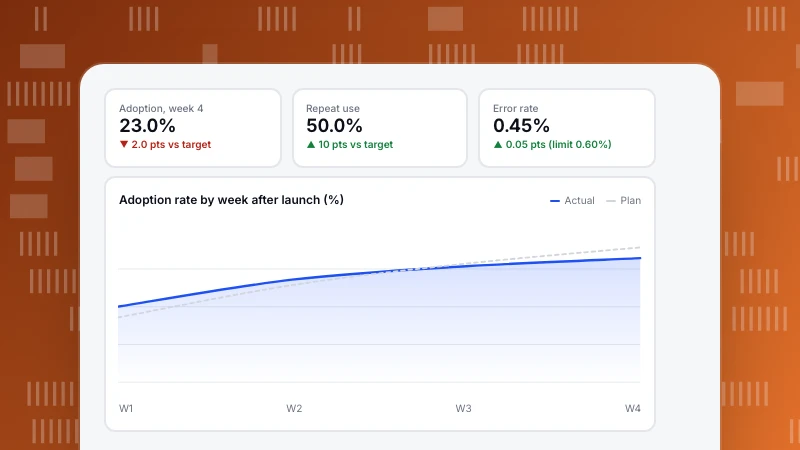
Product launch plan: decide how you will judge success before launch day
A product launch plan covers goals, audience, timeline, roles, rollout and rollback. The part most plans leave vague is how to judge the result. A timeline from six weeks before to four weeks after, a success-criteria card, and a worked review.
Read more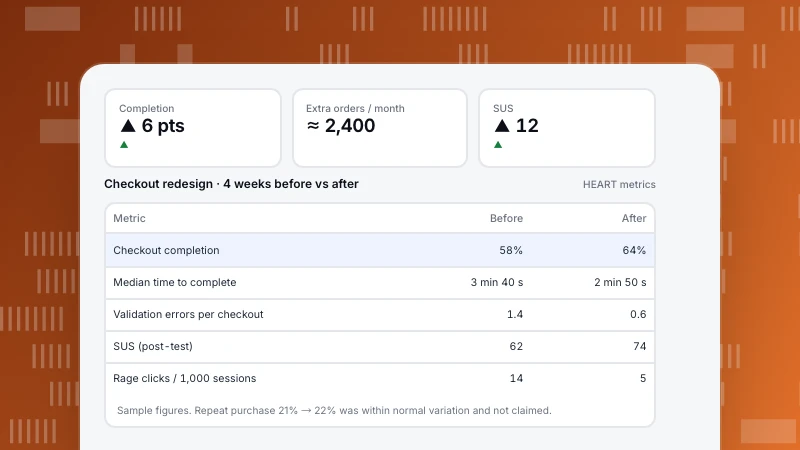
UX metrics: what to measure, the HEART framework and a worked redesign
The UX metrics that matter, behavioral and attitudinal, with how to measure each; Google’s HEART framework with goals, signals and metrics; and a worked checkout redesign measured before and after.
Read more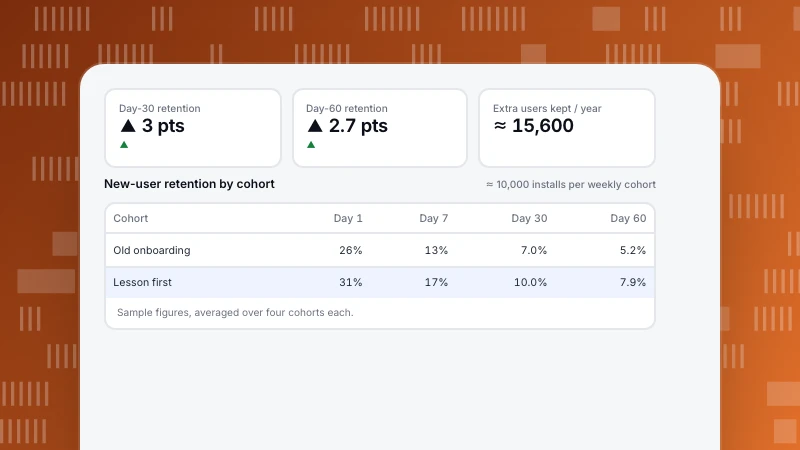
App retention rate: how to calculate it, read the curve and improve it
App retention rate is the share of new users who come back after N days. The formula, why classic, range and unbounded retention give different numbers, what a healthy curve looks like, and a worked onboarding change measured by cohort.
Read more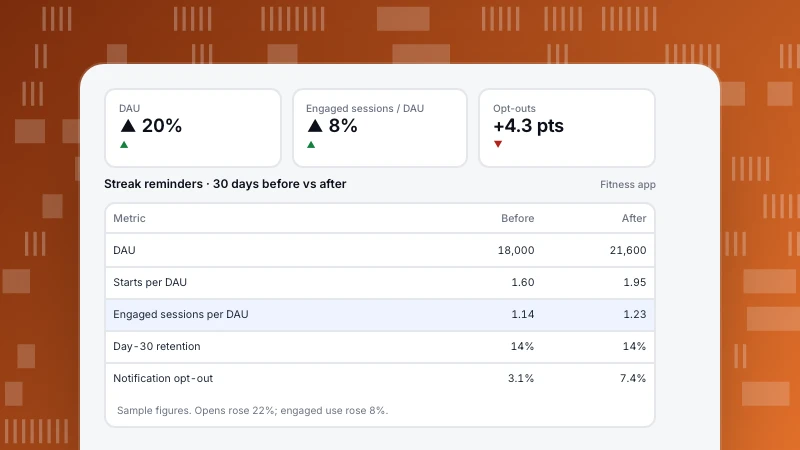
App engagement metrics: formulas, benchmarks by app type and a worked case
The app engagement metrics that matter, with formulas: DAU, MAU, stickiness, session length and interval, engaged sessions and retention. How to judge them by app type, and a worked case where opens rose 22% but real use barely moved.
Read more
What does a product engineer do? Role, skills and a feature end to end
A product engineer owns product outcomes, not just code. How the role differs from software engineers and product managers, daily responsibilities, skills, and a worked feature from support tickets to full rollout.
Read more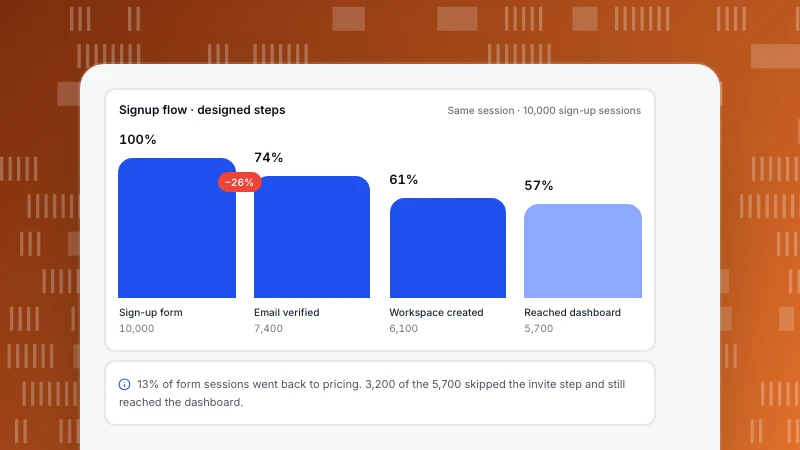
User flow: how to create one, examples and how to check it against real paths
What a user flow is, how it differs from a user journey and a wireflow, six steps to create one, four examples, and a worked signup flow compared with the paths 10,000 sessions actually took.
Read more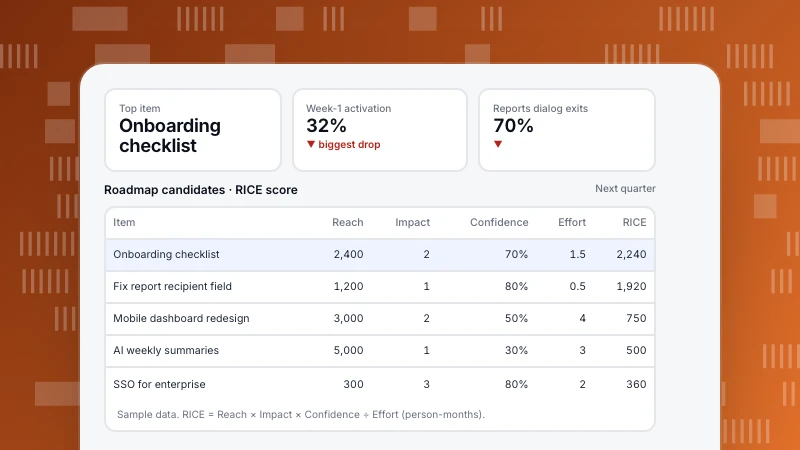
Product roadmap: types, how to build one and how to prioritize with data
A product roadmap links strategy to what gets built next. Four roadmap types compared, an 8-step process, a RICE prioritization example with reach taken from funnel data, and the mistakes that turn roadmaps into feature factories.
Read more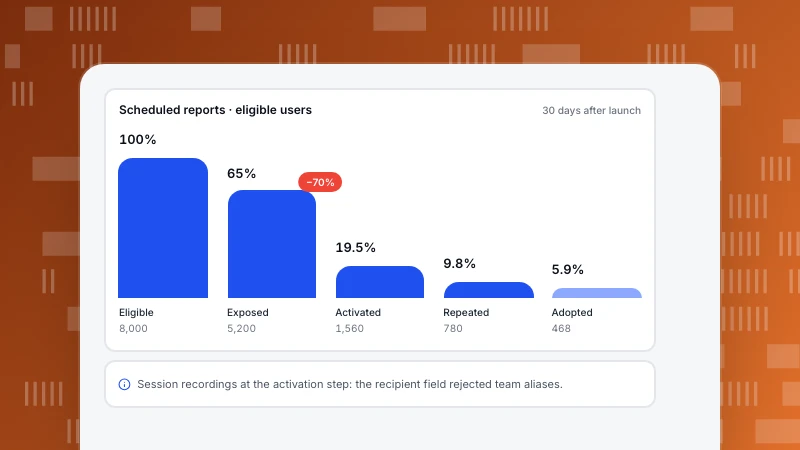
Feature adoption: the funnel, metrics and how to increase it
Feature adoption is whether users find, try and keep using a specific feature. The five-stage funnel, formulas for each metric, a worked example where 19.5% tried a feature but 5.9% adopted it, and tactics that target the real bottleneck.
Read more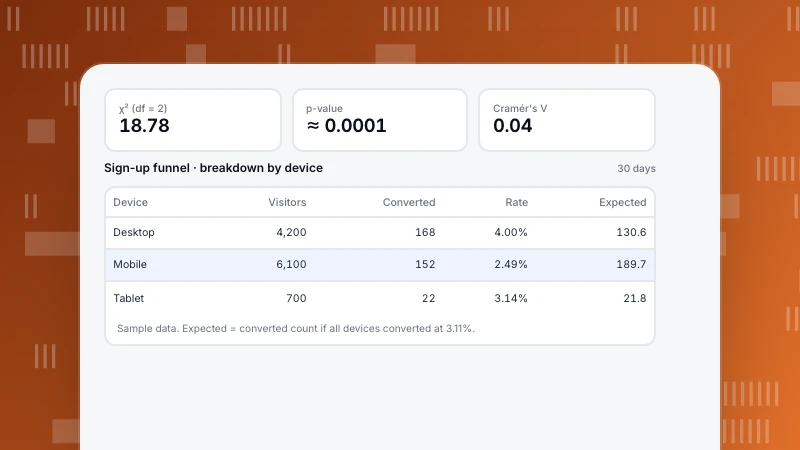
Chi-square test explained with conversion and experiment examples
The chi-square test checks whether category counts differ from chance. Two worked examples, conversion by device and a sample ratio mismatch check, with every expected count, degrees of freedom, effect size and the mistakes to avoid.
Read more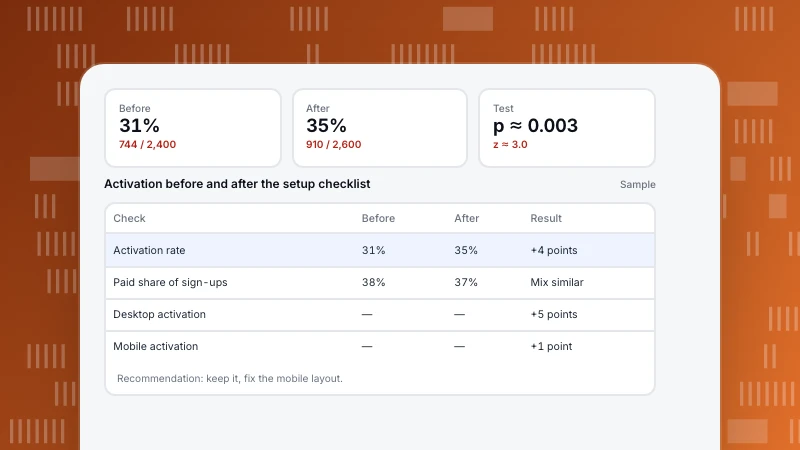
What Does a Product Analyst Do? Tasks, Skills and a Real Example
A product analyst turns product usage data into decisions: defining metrics, setting up tracking, answering questions about features and users, and checking whether changes worked. Five recurring jobs, a typical week, a worked analysis and how the role compares with related jobs.
Read more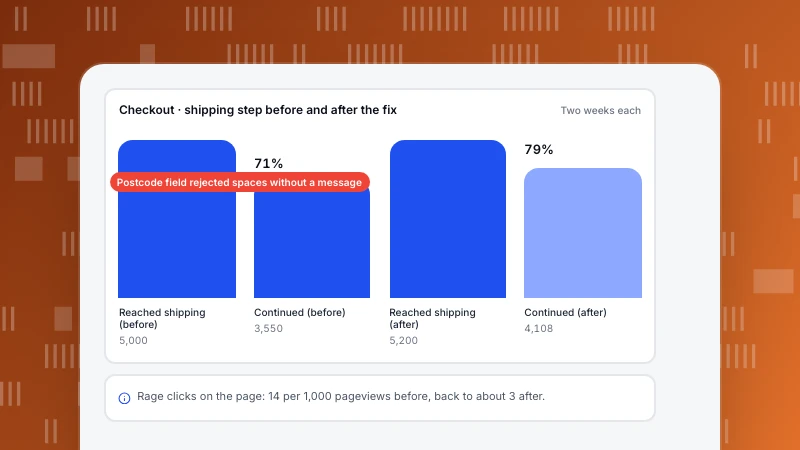
Digital Experience Analytics: What It Covers and How to Use It
Digital experience analytics (DXA) shows how people actually experience your site or app: where they click, scroll, get stuck and give up. The five parts, a worked checkout investigation from funnel drop to fix, and privacy rules for session replay.
Read more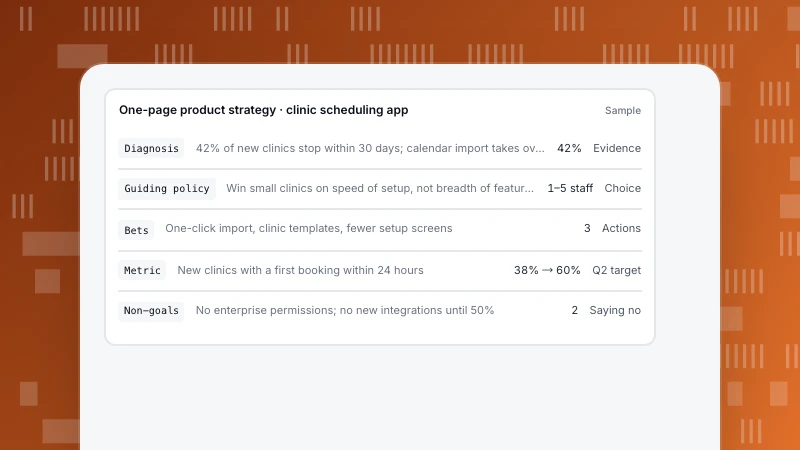
Product Strategy Framework: A One-Page Template With an Example
A product strategy explains where you will win and what you will not do. Five well-known frameworks compared, a one-page template (diagnosis, guiding policy, bets, metric, non-goals), and a filled-in example you can copy.
Read more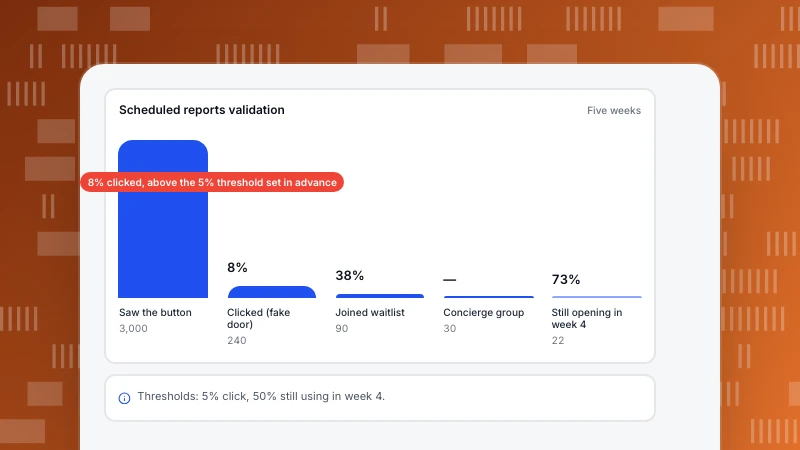
Product Validation: Test Demand Before You Build
Product validation checks that a problem is real, that people want your solution, and that they keep using it, before you spend months building. Four things to validate, methods by cost, and a worked fake-door and concierge test with thresholds set in advance.
Read more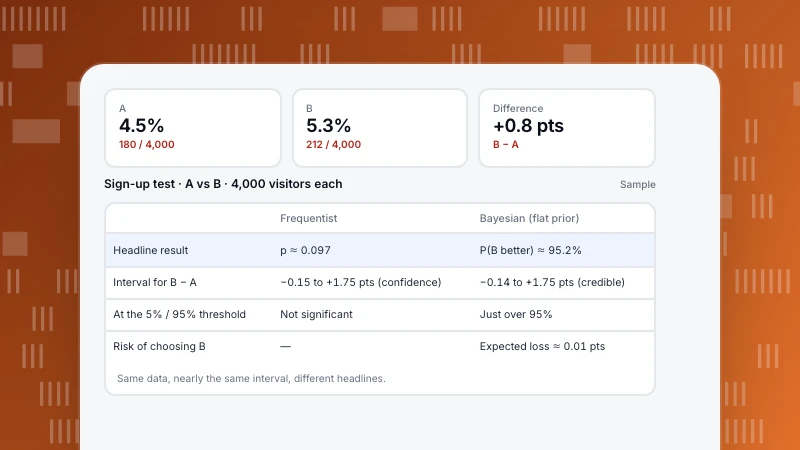
Bayesian vs Frequentist: The Same A/B Test, Analysed Both Ways
Frequentist and Bayesian statistics answer different questions about the same data. A plain explanation of both, one A/B test analysed each way (p = 0.097 vs a 95% chance B is better), and when to use which.
Read more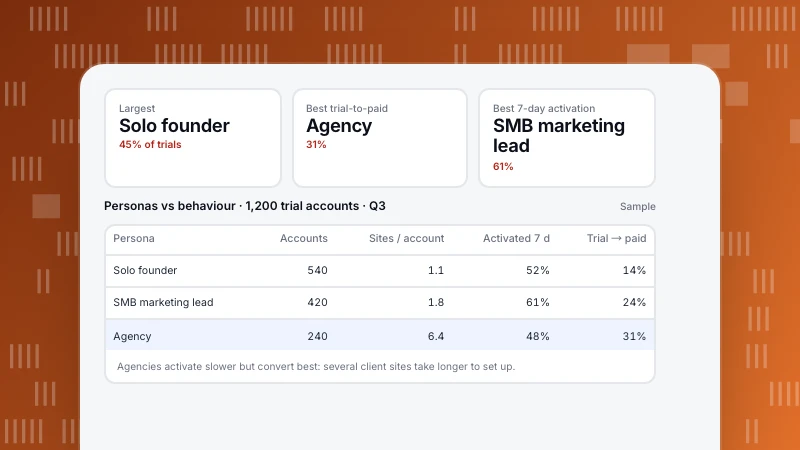
User Personas: How to Build Them From Real Data
A user persona is a short profile of a type of user, built from research. What to include, how personas differ from segments, how to check them against usage data, and a sample of three personas with real behaviour behind them.
Read more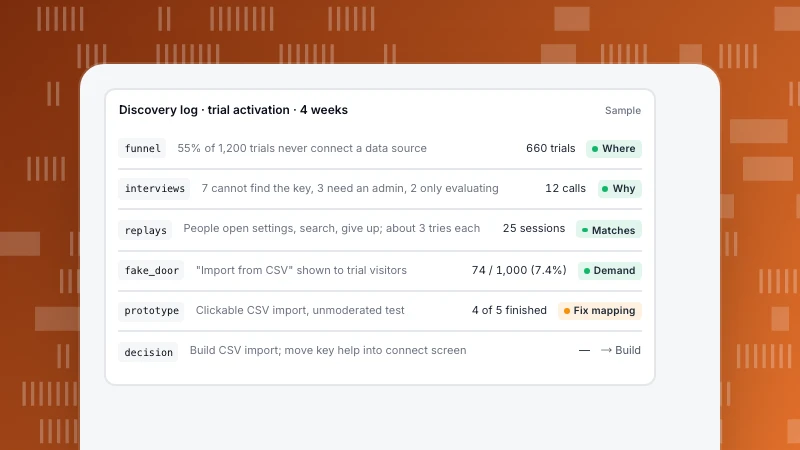
Product Discovery: How to Decide What to Build, With Evidence
Product discovery is the work of finding out what is worth building before you build it. The four risks to test, the methods for each, a worked case from usage data to a decision, and a weekly cadence that keeps it going.
Read more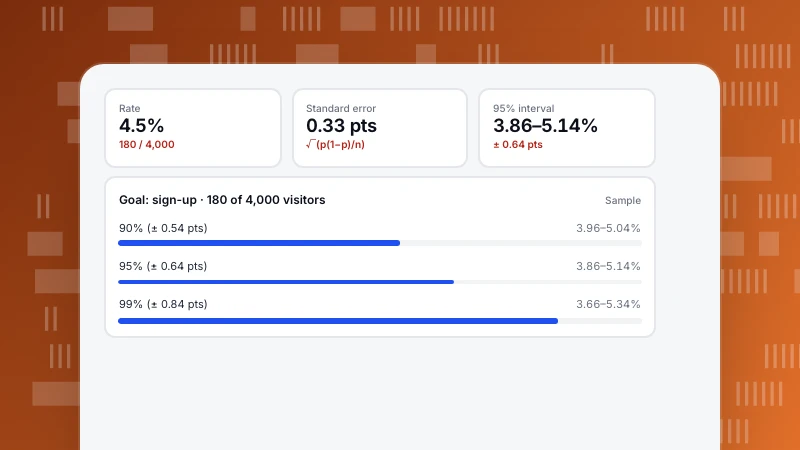
How to Calculate a Confidence Interval (With Conversion Rate Examples)
A confidence interval gives the range a true value probably sits in. The formulas for a mean, a rate and a difference between two rates, worked examples with conversion data, and what to do with small samples.
Read moreOther categories
Each category answers a recurring question we hear from customers. Start with the one closest to your job.
Analytics
Definitions, funnels, retention and the data-quality questions behind every number.
304 articlesGrowth & Marketing
Acquisition, marketing, site and app operations, and how to pick the one stage worth fixing first.
238 articlesLive Chat
Proactive invites, translation and turning support conversations into conversions.
78 articlesAI Search
GPTBot, ClaudeBot, PerplexityBot: who fetches your pages, what the files say and what comes back.
39 articles