Try it on your own data
Every report in this article is in the free plan. One snippet for web and apps, up to 10 sites.
Start freeDigital experience analytics explains why people struggle on a site or app, using journeys, heatmaps, session replay, frustration signals and performance data. This guide defines the parts in neutral terms, shows how they combine in one checkout investigation, and covers the privacy rules for replay.
What you will learn
- Funnels show where people leave; frustration signals, heatmaps and replay show why
- Start from a measured problem, then confirm the pattern across many sessions before fixing
- Mask inputs, exclude sensitive pages and tell visitors before recording sessions
What it is
Digital experience analytics (DXA) is the set of methods that show how people experience a website or app, not just what they did. Traditional analytics tells you that 29% of shoppers leave at the shipping step. DXA helps you see why: the field they tapped five times, the button below the fold, the error that appeared on one browser.
The five parts
The table below lists the parts of DXA, the question each answers and its limits.
| Part | Question it answers | Limit |
|---|---|---|
| Journeys and funnels | Where do people drop off? | Shows where, not why |
| Heatmaps (click, scroll) | What do people click and how far do they scroll? | Aggregated; split by device |
| Session replay | What exactly happened in one session? | Slow to review; privacy settings needed |
| Frustration signals | Where do people rage-click or hit dead ends? | Signals, not causes |
| Performance and errors | Is the page slow or broken for some users? | Needs a link to the affected journey |
Use them in this order: measure, locate, watch, confirm.
How the parts work together: a checkout investigation
An online shop sees fewer orders than expected. Sample numbers throughout.
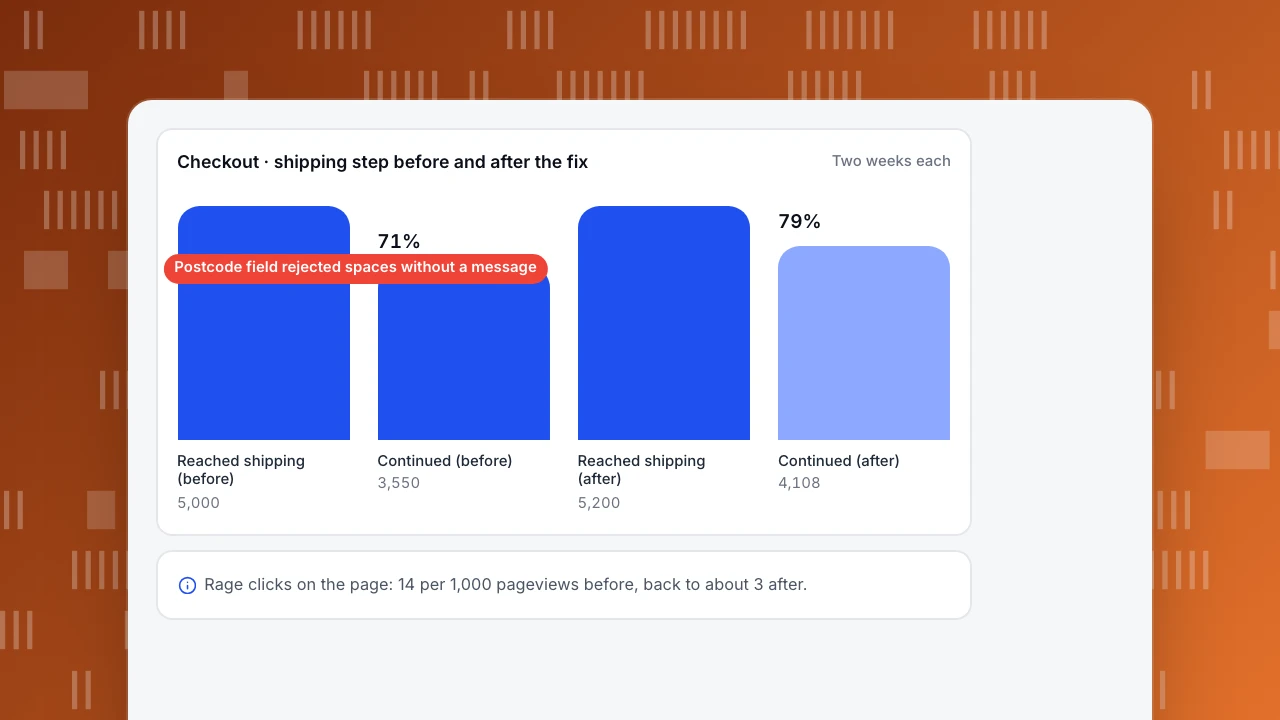
1. Find where (funnel). The checkout funnel shows the drop concentrated at the shipping step: of 5,000 sessions that reach it, 3,550 continue (71%). Other steps keep over 90%.
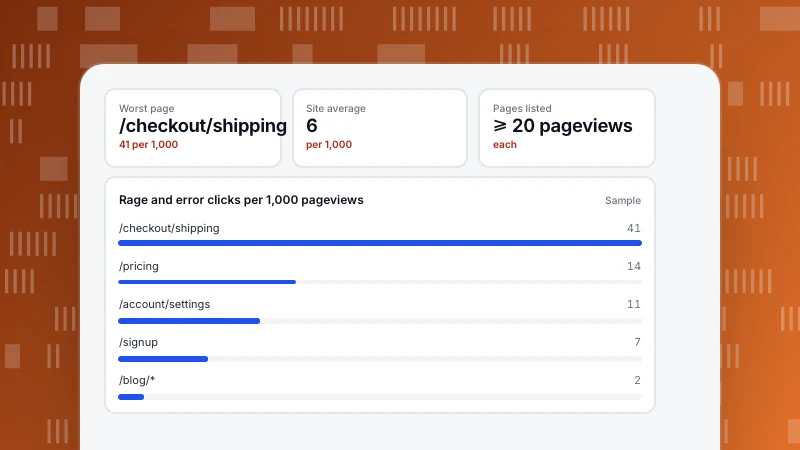
2. Find what (frustration signals). The shipping page has 14 rage clicks per 1,000 pageviews; other checkout pages have about 3. The rage clicks sit on the "Continue" button.
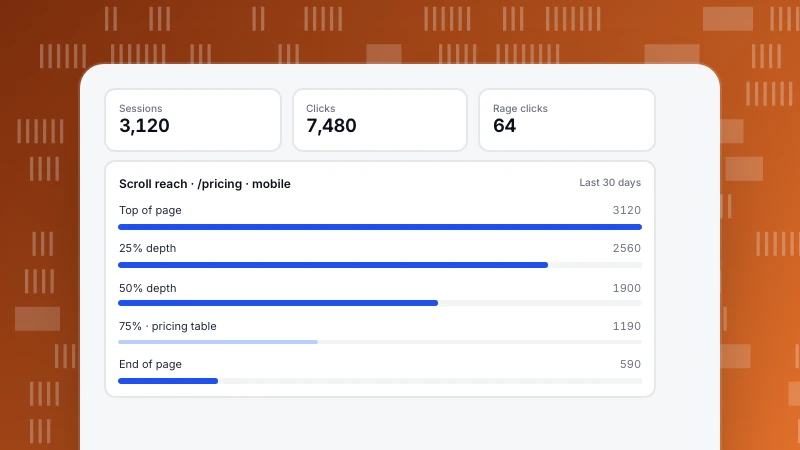
3. Find how (heatmap). On mobile, the click map shows heavy clicking on "Continue" and on the postcode field, and scroll reach shows most people do reach the button.
4. See it happen (replay). Watching 20 replays of sessions that left at this step: people type a postcode with a space ("SW1A 1AA"), press Continue, nothing happens, they press again, then leave. The validation rejects spaces and shows no message.
5. Rule out the rest (performance and errors). Page load is normal; no new JavaScript errors.
Fix and check. Accept spaces and show a message for invalid postcodes. Two weeks later: 4,108 of 5,200 sessions continue (79%), and rage clicks on the page fall to normal levels.
No single tool would have found this alone. The funnel showed where, the frustration signal pointed to the button, replay showed the cause.
Checkout · shipping step before and after the fix
Two weeks eachReached shipping (before)
5,000
Continued (before)
3,550
Reached shipping (after)
5,200
Continued (after)
4,108
Privacy rules for replay and heatmaps
- Tell visitors in your privacy policy that sessions may be recorded, why, and for how long.
- Mask input values (on by default in most tools) and exclude pages with payment, ID or medical forms.
- Sample a share of sessions; you rarely need every one.
- Limit who can watch replays, and keep retention short.
Common mistakes
- Watching replays without a question: hours of video, no conclusion. Start from a funnel drop or a frustration signal.
- Fixing what one replay showed. Check that the pattern repeats across many sessions.
- Reading heatmaps without splitting by device; desktop and mobile layouts differ.
Where each part lives in TapCub
- Journeys and funnels: All-platform analytics › Behavior › Behavior analysis (funnels and paths).
- Heatmaps: All-platform analytics › Behavior › Heatmaps, with clicks, rage clicks, scroll reach and elements by device. Needs autocapture; a rage click is the third click within 300 ms and 50 px.
- Session replay: All-platform analytics › Behavior › Session replay. Off by default; input values are masked by default, and the sample rate defaults to 10%.
- Frustration alerts: a monitor with the frustration condition alerts when rage clicks per 1,000 pageviews rise.
- Performance and errors: Monitoring › Performance for load times, and Monitoring › Errors for JavaScript errors.
See also UX analytics, user friction, how to read a heatmap and the glossary entry on rage clicks.
Was this article helpful?
We use your answers to fix and expand this page.
Couldn’t send. Please try again in a minute.
Thanks for the feedback. We’ll use it to improve this page.You’ve already sent feedback on this page. Thanks.

Product Adoption Consultant
Explores customer onboarding, live conversations, and self-service, turning common usage questions into practical guidance and improvements.