Try it on your own data
Every report in this article is in the free plan. One snippet for web and apps, up to 10 sites.
Start freeUX analytics uses behaviour data to measure how easily people complete tasks in your product or site. This guide defines five task metrics in events, lists the frustration signals worth tracking, and measures a redesigned invite flow before and after.
What you will learn
- Measure tasks with a clear start and success, not the whole product
- Track success, time, errors, frustration and return use per task
- Take a baseline, compare like with like, and use replays to explain
What UX analytics is
UX analytics is the use of behaviour data (events, clicks, errors, timings, sessions) to measure the user experience: how easily people can do what they came to do. It complements user research. Research tells you why something is hard with a handful of people; analytics tells you how often and how much, across everyone, and whether a change helped.
The common mistake is to measure the whole product with general metrics such as time on site. More time can mean more engagement or more confusion. UX analytics works when it measures tasks: specific things a person is trying to get done, with a clear start and a clear success.
Five metrics for a task
Pick one task (invite a teammate, export a report, change a plan, find an article) and measure it with the five metrics in the table. Each one is defined with events you can count.
For a whole-product view, Google's HEART framework groups metrics into Happiness, Engagement, Adoption, Retention and Task success. It is a useful checklist; for design decisions, task metrics are what move.
| Metric | Definition in events | Good direction |
|---|---|---|
| Task success rate | success event ÷ start event, per person | Higher |
| Time on task | median time from start to success | Lower, for tasks people want to finish |
| Error rate | error events ÷ attempts on the task’s pages | Lower |
| Frustration | rage clicks per 1,000 pageviews; backtracks; help opened mid-task | Lower |
| Return use | share who do the task again within 30 days | Higher, for repeat tasks |
Define start and success before the redesign; keep them stable after.
Frustration signals worth tracking
- Rage clicks: repeated clicks on the same spot in quick succession. In TapCub a rage click is the third click within 300 milliseconds and 50 pixels, decided as the clicks arrive. They usually mean something looks clickable but is not, or responds too slowly.
- Errors: validation messages, failed requests and JavaScript errors on the task's pages.
- Backtracking: going back to the previous step, or opening the help centre mid-task.
- Abandonment at a step: the last event before leaving. A funnel over the task's steps shows it.
TapCub's journey maps combine three of these per stage into a sentiment score (100 minus 1.5 × error rate, 1.5 × frustration rate and 0.5 × exit rate), and a monitor can alert when rage clicks per 1,000 pageviews pass a threshold, so a release that breaks a control is caught the same day.
A worked example: redesigning "Invite a teammate"
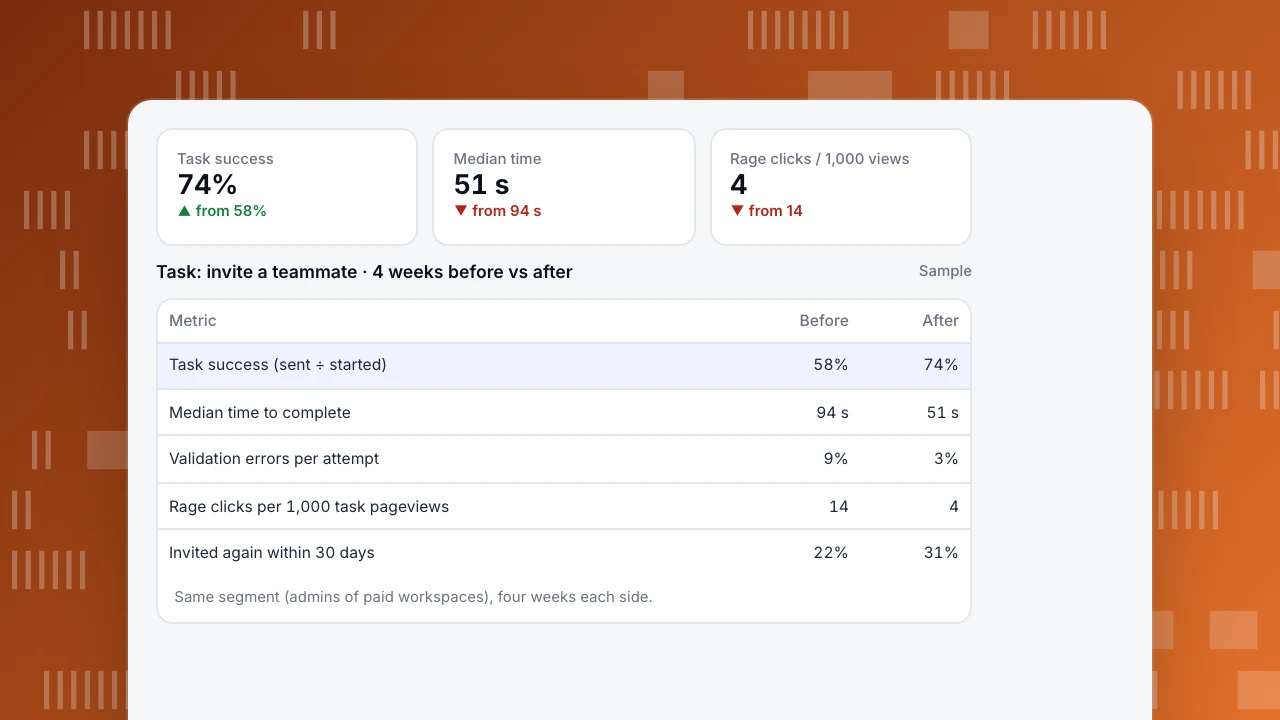
A B2B product's invite flow had three screens: a settings menu, a members page and a modal with role options. Support tickets mentioned it often. The team defined the task as opened members page → invite sent and measured it for four weeks before and after a redesign that put an "Invite" button in the top bar and preselected the most common role.
- Task success rose from 58% to 74% of people who started.
- Median time to complete fell from 94 to 51 seconds.
- Rage clicks per 1,000 task pageviews fell from 14 to 4, most of them previously on a disabled "Send" button.
- Validation errors fell from 9% to 3% of attempts.
The replays explained the old numbers: people typed several emails into a field that accepted one and clicked "Send" while it was disabled. Without the task definition, the team would have seen only "members page views went down", which sounds bad and was in fact the point.
Task success
74%
▲ from 58%
Median time
51 s
▼ from 94 s
Rage clicks / 1,000 views
4
▼ from 14
Task: invite a teammate · 4 weeks before vs after
Sample| Metric | Before | After |
|---|---|---|
| Task success (sent ÷ started) | 58% | 74% |
| Median time to complete | 94 s | 51 s |
| Validation errors per attempt | 9% | 3% |
| Rage clicks per 1,000 task pageviews | 14 | 4 |
| Invited again within 30 days | 22% | 31% |
Same segment (admins of paid workspaces), four weeks each side.
How to set it up
- List the five to ten tasks that matter most to new and paying users.
- Define start and success as events for each. Name them consistently, for example \
invite_started\and \invite_sent\. - Track errors and frustration on the same pages: turn on autocapture for rage clicks and heatmaps, and send validation errors as events with the field name, never the value.
- Take a baseline of at least two weeks before you change anything.
- Compare like with like after the change: same task, same user segment, same length of time.
- Watch a few replays of failures to explain the numbers, not to replace them. See how to read a heatmap.
FAQ
What are UX metrics?
Measures of how well an experience works for people: task success rate, time on task, error rate, frustration signals such as rage clicks, and satisfaction scores. Task-level metrics are more useful than site-wide ones.
What is the difference between UX analytics and product analytics?
Product analytics asks what people do and which features drive retention and revenue. UX analytics asks how easily they can do it. They use much of the same data; UX analytics looks at it task by task.
How do you measure UX without user testing?
With task metrics from analytics: success, time, errors, rage clicks and abandonment per step. Use them to find where to test; they cannot tell you why on their own.
Is time on task always better when shorter?
For tasks people want to finish (an invite, a payment), yes. For reading or exploring, longer can be good. Decide in advance which direction is success.
See also: UX metrics.
See also: UX optimization.
Was this article helpful?
We use your answers to fix and expand this page.
Couldn’t send. Please try again in a minute.
Thanks for the feedback. We’ll use it to improve this page.You’ve already sent feedback on this page. Thanks.

Product Adoption Consultant
Explores customer onboarding, live conversations, and self-service, turning common usage questions into practical guidance and improvements.