Try it on your own data
Every report in this article is in the free plan. One snippet for web and apps, up to 10 sites.
Start freeOnboarding dashboards often fill up with tour completions and email opens while the real question goes unanswered: do new users reach the point where the product is useful to them, and how fast? This guide defines activation, builds the onboarding funnel from events, measures time to value and ties it all to retention.
What you will learn
- Activation rate is the central onboarding metric; define the event as a result and test it against retention
- Build the onboarding funnel from events and look at the people in its biggest drop
- Report time to value as a median plus the share who activate within the target window
What onboarding metrics measure
Onboarding metrics tell you whether new users reach the point where your product becomes useful to them, and how quickly. (Search results for the term also cover employee onboarding in HR; this guide is about users of a software product.)
Onboarding sits between sign-up and retention. Its job is narrow: get each new user to their first real result. That makes the central onboarding metric the activation rate, the share of new users who reach an agreed activation event within a set time. Everything else either explains that rate (where people drop, how long it takes) or checks that it matters (do activated users stay).
Define activation before you measure it
Most onboarding dashboards fail here: "activated" is left vague, or set to whatever is easy to count. A good activation event:
- Is a result, not a step. "Saw their own data in the report" is a result; "completed the product tour" is a step.
- Happens early. Usually in the first session or first days, so you can act on it quickly.
- Predicts retention. Users who reach it should come back much more often than users who do not.
Test candidate events against retention before you commit. Take sign-ups from a few past weeks, split them by whether they did the candidate event in their first week, and compare week-4 retention of the two groups. The event with the largest gap that most users can still reach is your activation event. Write it into your tracking plan with a clear name and time window, as in the event tracking guide.
Build the onboarding funnel
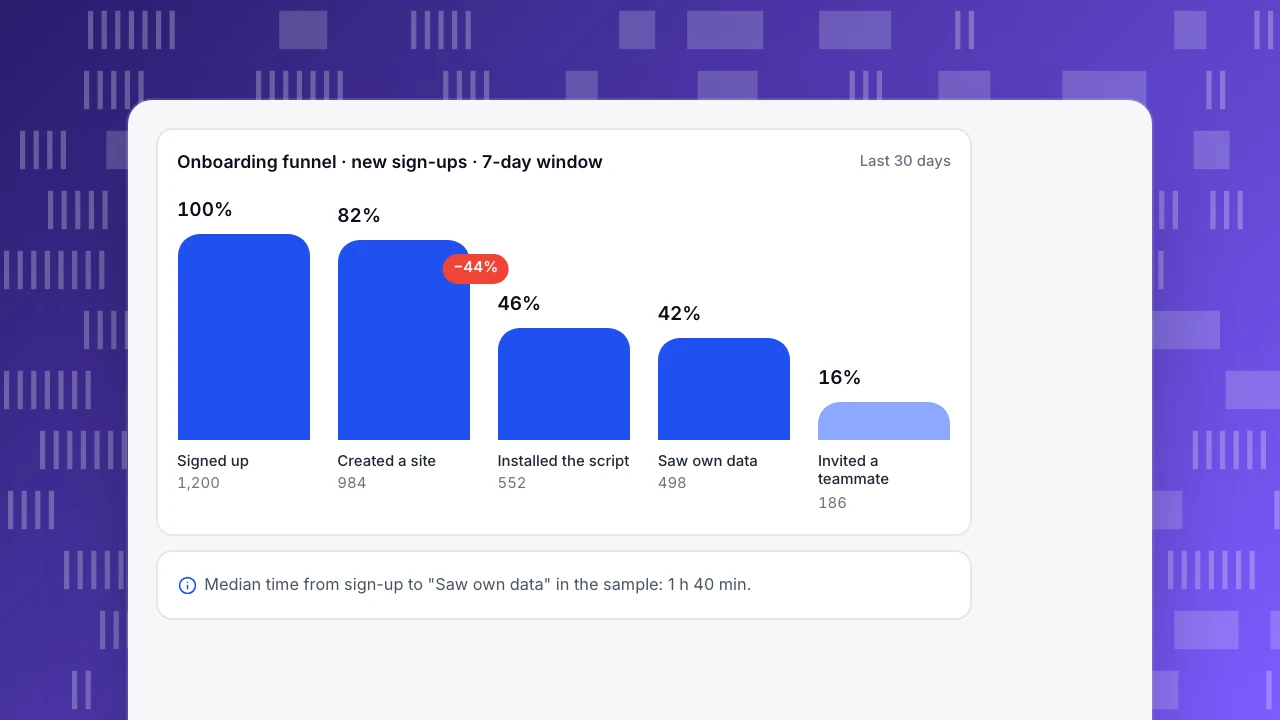
The onboarding funnel lists the steps between sign-up and activation as events, in order. Each step's rate shows where new users stop. In the example, for an analytics product, the biggest drop is not at sign-up but between creating a site and installing the tracking code: people who have to involve a developer stall there.
Two practical rules for this funnel:
- Use a window that matches reality. If activation normally takes days, a one-hour window will report most users as lost.
- Click into the drop. The people who stopped at the biggest drop are the best source of what to fix: check what they did instead, and where they came from. The funnel mistakes article covers the usual reading errors.
Onboarding funnel · new sign-ups · 7-day window
Last 30 daysSigned up
1,200
Created a site
984
Installed the script
552
Saw own data
498
Invited a teammate
186
The onboarding metrics
The table lists the onboarding metrics worth tracking and the event each one needs. Keep the set small. Tour completion, checklist completion and "onboarding emails opened" measure your onboarding material, not whether users succeeded; report them only next to activation.
| Metric | Definition | Event needed |
|---|---|---|
| Activation rate | New users reaching activation within the window ÷ new users | Activation event |
| Step rate | Users at a step ÷ users at the previous step | One event per step |
| Time to value | Median time from sign-up to activation | Sign-up and activation |
| Activated within target | Share activating within e.g. 1 day | Sign-up and activation |
| Early retention | Activated users active in week 4 ÷ activated users | Any active event |
| Activation by source | Activation rate split by sign-up channel | Source on sign-up |
Tour or checklist completion belongs next to these, not in place of them.
Measure time to value
Time to value (TTV) is the time from sign-up to activation. Report it as a median, not an average: a few users who activate weeks later drag the average up and hide improvements for everyone else. Also report the share who activate within your target window (for example, within one day), because a median only covers the users who activated at all.
Ways to shorten time to value usually remove steps rather than explain them: sample data so the report is never empty, defaults instead of settings, sending the install instructions to a teammate in one click.
Connect onboarding to retention
Onboarding is only as good as the retention that follows. Compare activated and non-activated users in a cohort retention chart every month. If the gap between them shrinks, your activation event has drifted away from real value (for example, after a product change), and it is time to test candidates again.
Segment the onboarding funnel by sign-up source too. A channel that brings many sign-ups with a low activation rate is an acquisition problem, not an onboarding one; the AARRR guide shows how to tell which stage leaks.
Onboarding metrics in TapCub
In TapCub, the onboarding funnel is a funnel analysis: 2 to 20 steps, each an event name or page path with its own filters, and a conversion window of up to 180 days. Each step shows its count, rate against step one and the previous step, drop-off and the median time from the previous step; the summary shows the median time to complete, which is your time to value. Click a step to see the people who dropped there (funnels).
Retention analysis compares how many of a group return in later periods, so you can test an activation event by comparing those who did it with those who did not (retention). The steps for setting up the first funnel are in build a funnel.
FAQ
What are user onboarding metrics?
Measurements of how new users get to value: activation rate, the step rates of the onboarding funnel, time to value, and early retention of activated users.
What is a good activation rate?
It depends on how you define activation and on traffic quality. Track it against your own history and segment it by sign-up source before comparing.
How do you calculate activation rate?
New users who reach the activation event within the window, divided by all new users in the same sign-up period.
What is time to value?
The time from sign-up to the activation event. Report the median and the share of users who activate within your target window.
Is completing the product tour a good onboarding metric?
Not on its own. It measures whether people finished your material, not whether they got value. Report it next to activation, not instead of it.
See also: App onboarding.
Was this article helpful?
We use your answers to fix and expand this page.
Couldn’t send. Please try again in a minute.
Thanks for the feedback. We’ll use it to improve this page.You’ve already sent feedback on this page. Thanks.

Product Adoption Consultant
Explores customer onboarding, live conversations, and self-service, turning common usage questions into practical guidance and improvements.