Try it on your own data
Every report in this article is in the free plan. One snippet for web and apps, up to 10 sites.
Start freeRevenue can grow for months while a product gets slower, buggier and less used. Product health metrics are the early view: a small weekly scorecard across growth, engagement, retention, quality and satisfaction, each with a threshold that turns it green, amber or red. This guide shows what to put on it and how to keep it useful.
What you will learn
- Track about ten metrics across five areas, including quality (speed, errors, crashes)
- Give every metric a written threshold so the scorecard shows status, not just numbers
- Read reds and ambers weekly, assign owners, and prune metrics nobody acts on
What product health means
Product health metrics answer one question each week: is the product getting better or worse for the people who use it? They are not the same as business metrics. Revenue can grow for months while the product gets slower, buggier and less used, because contracts lag behind experience. Product health is the early view.
Most guides cover growth, engagement and retention. That misses a large part of what users feel: speed, errors and crashes. A product that loads slowly or breaks is unhealthy whatever its active-user count says.
Five areas of product health
The table groups product health metrics into five areas, with one or two metrics each and the kind of threshold that makes sense. Fewer metrics is better: a scorecard of ten numbers gets read; one of forty does not. The breakdown follows the same logic as many product analytics frameworks, such as Sequoia's guide to measuring product health, with quality added as its own area.
| Area | Metrics | Threshold logic |
|---|---|---|
| Growth | New activated users or accounts | Own 8–12 week range |
| Engagement | Weekly active users on the core action, DAU/MAU | Own range |
| Retention | Week-4 retention of the latest cohort | Own range, red at a clear break |
| Quality | LCP and INP by key page, error rate, crash-free users | External standard (Core Web Vitals), before vs after release |
| Satisfaction | Help-page "not solved" share, support contacts per 100 active users | Own range |
One or two metrics per area; write the threshold next to each.
A weekly product health scorecard
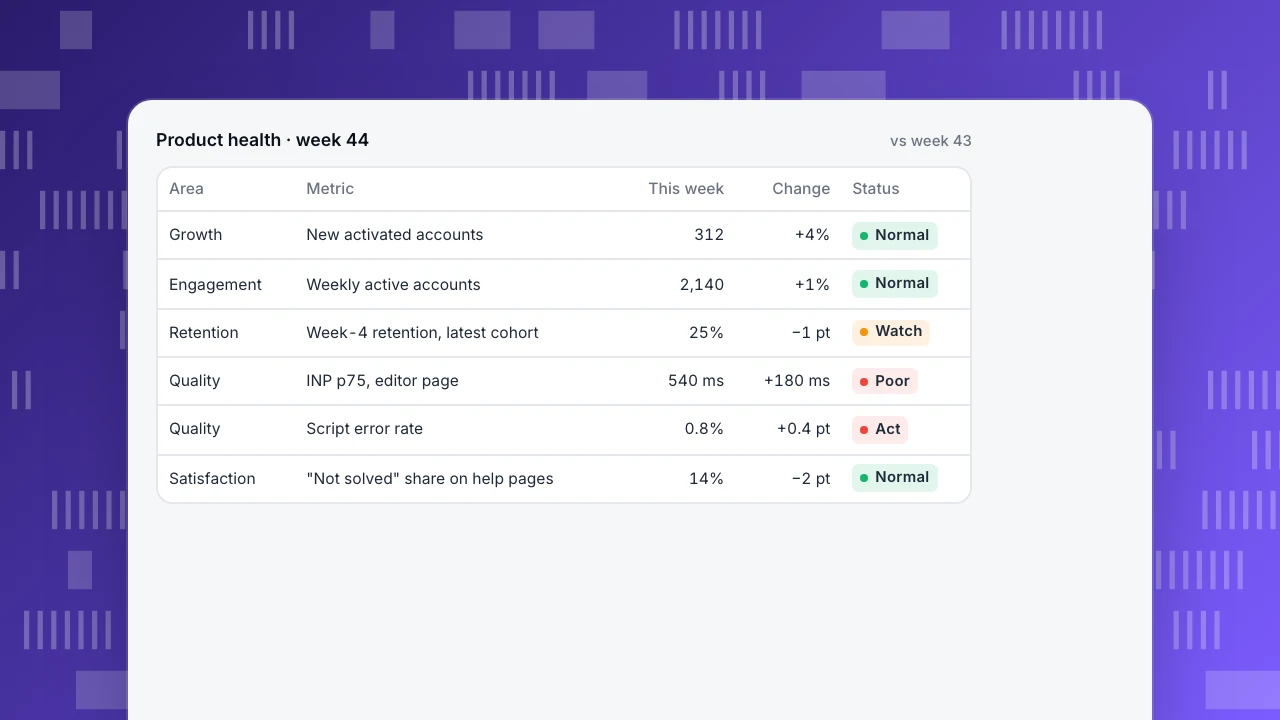
The example scorecard puts each metric on one row with this week's value, the change from last week and a status. Status is what makes it usable: green means within the normal range, amber means outside it but not yet a problem, red means act now. In the sample week, growth and engagement are fine, but the interaction delay on the editor page crossed the "poor" threshold and the error rate doubled after a release. Those two rows are the agenda for the week; the rest needs no discussion.
Product health · week 44
vs week 43| Area | Metric | This week | Change | Status |
|---|---|---|---|---|
| Growth | New activated accounts | 312 | +4% | Normal |
| Engagement | Weekly active accounts | 2,140 | +1% | Normal |
| Retention | Week-4 retention, latest cohort | 25% | −1 pt | Watch |
| Quality | INP p75, editor page | 540 ms | +180 ms | Poor |
| Quality | Script error rate | 0.8% | +0.4 pt | Act |
| Satisfaction | "Not solved" share on help pages | 14% | −2 pt | Normal |
Set thresholds for each metric
A threshold turns a number into a status. Three ways to set one:
- External standards, where they exist. Core Web Vitals define good and poor ranges for loading, interactivity and layout stability (web.dev).
- Your own normal range. For retention or DAU/MAU, take the last 8–12 weeks and mark amber outside the usual range and red at a clear break.
- Targets you committed to. If the team agreed on 40% activation, amber below that and red at a level that would miss the quarter.
Write the threshold next to each metric. A status nobody can explain becomes noise, and a scorecard that is always amber teaches people to ignore it.
Quality is part of product health
Quality metrics are the easiest to collect and the most often left out:
- Speed: largest contentful paint and interaction to next paint, measured from real visits, by page. A product can be fast on average and slow on the one page people use most.
- Errors: script errors per page view on the web, crash-free users in apps. Compare before and after each release.
- Reliability: share of key actions that succeed (saves, exports, payments). Track failures as events.
When an engagement metric drops, check quality first. A slower editor or a failing export explains many engagement drops faster than any user research.
A weekly routine
- Open the scorecard on the same day each week; read the reds and ambers only.
- For each red, name an owner and the next step before the meeting ends.
- For ambers, check whether they were amber last week too. Two weeks in a row becomes red.
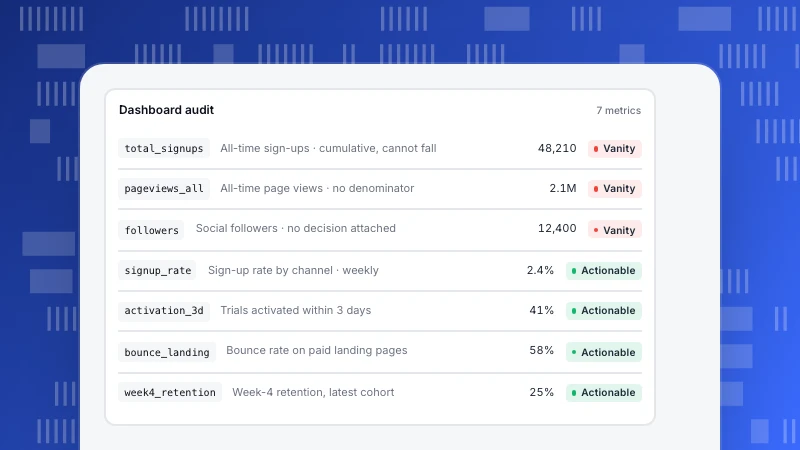
- Once a month, review whether any threshold is wrong, and remove metrics nobody has acted on in a quarter. The actionable metrics test helps decide what stays.
Product health in TapCub
A product health scorecard in TapCub is a dashboard of saved analyses: active users and retention from product analytics, engaged rate from web analytics, and quality from the monitoring reports. The performance report collects Core Web Vitals from real loads; largest contentful paint is good up to 2.5 seconds and poor above 4, interaction to next paint good up to 200 ms and poor above 500 ms (performance). Error rate is script errors divided by page views (web metrics), and app analytics reports crash-free users as 1 − crash users ÷ active users (app metrics).
To get red rows without opening the board, add a monitor on the metrics that matter most; built-in measures include error rate, bounce rate and visitors. The web vitals glossary page explains each speed metric.
FAQ
What are product health metrics?
A small set of metrics, reviewed weekly, that show whether the product is getting better or worse for its users: growth, engagement, retention, quality and satisfaction.
What is the difference between product health and business metrics?
Business metrics such as revenue and churn reflect what already happened in contracts. Product health metrics react earlier, because they measure use and experience directly.
How many product health metrics should I track?
Around ten, one or two per area. More than that and the scorecard stops being read.
Should performance be part of product health?
Yes. Slow pages and errors reduce engagement and retention, and they are among the easiest problems to fix once measured.
How often should product health be reviewed?
Weekly for the scorecard, with alerts for the most important metrics, and a monthly review of thresholds and metric choice.
See also: Product analytics dashboard.
Was this article helpful?
We use your answers to fix and expand this page.
Couldn’t send. Please try again in a minute.
Thanks for the feedback. We’ll use it to improve this page.You’ve already sent feedback on this page. Thanks.

Product Analyst
Focuses on event analysis, conversion funnels, and retention, using clear metric definitions and structured analysis to explain product performance.