Try it on your own data
Every report in this article is in the free plan. One snippet for web and apps, up to 10 sites.
Start freeProduct-led growth moves most of the customer journey into the product, which means most of the important numbers live in event data. This guide lays out PLG metrics as one funnel from visitor to expansion, gives the event behind each metric, shows how to define a product-qualified lead from usage, and explains why team products need account-level metrics.
What you will learn
- Treat PLG metrics as one connected funnel, each stage with one metric, one event and one owner
- Define a PQL from usage signals that preceded past upgrades, and test it every quarter
- Measure accounts as well as users; falling account activity warns of churn early
What makes PLG metrics different
In a product-led growth (PLG) company, the product does the work that marketing and sales do elsewhere: people sign up on their own, find value, invite colleagues and upgrade. Product-led growth metrics therefore track one continuous path, from visitor to paying, expanding account, and most of that path happens inside the product, where only event data can see it.
Lists of fourteen SaaS metrics miss the point. What a PLG team needs is a connected funnel where each stage has one metric, one event that defines it and one team that owns it.
The PLG funnel
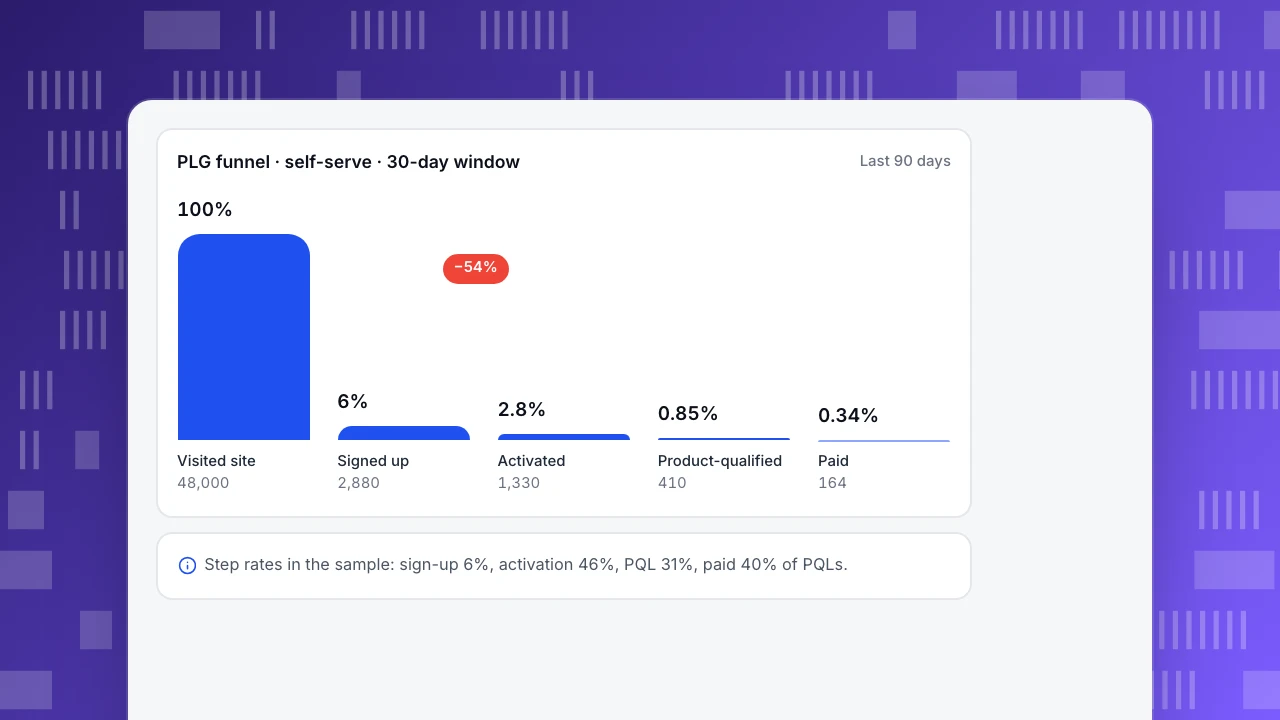
The example shows a typical self-serve funnel over 30 days. The steepest drop is between sign-up and activation; that is common, and it is why activation is usually the first lever in PLG. The step from activated to product-qualified is where team adoption begins: a single user becomes an account with several active people.
Read the funnel as a set of conversion rates, not as absolute numbers. Doubling traffic without changing the rates doubles the bottom only if the new traffic is as good as the old, which it rarely is.
PLG funnel · self-serve · 30-day window
Last 90 daysVisited site
48,000
Signed up
2,880
Activated
1,330
Product-qualified
410
Paid
164
Metrics and events by stage
The table pairs each stage with its metric and the event that defines it. Events are the part most teams leave vague; without them, "activation rate" or "PQL" means whatever the person presenting the number decided that week. Define them in your tracking plan, as in the event tracking guide.
Two revenue metrics complete the picture after conversion: ARPU to see whether accounts upgrade to larger plans, and net revenue retention to see whether existing accounts grow faster than they leave (see churn rate vs retention rate).
| Stage | Metric | Event that defines it |
|---|---|---|
| Acquisition | Sign-up rate by channel | sign_up (with source) |
| Activation | Activation rate, time to value | Your activation event, e.g. first report viewed |
| Adoption | Weekly active accounts, feature adoption | Core feature events |
| Team | Accounts with 3+ active members | Any active event per member + group call |
| PQL | PQL rate, PQL-to-paid conversion | Rule on usage signals |
| Revenue | Free-to-paid rate, ARPU | subscription_started, plan |
| Expansion | Net revenue retention, seats added | plan_upgraded, seat_added |
Event names are examples; define yours in the tracking plan.
Define a product-qualified lead
A product-qualified lead (PQL) is a user or account whose product usage suggests they are ready to buy or upgrade. Unlike a marketing-qualified lead, it is based on what people did in the product, not on what they downloaded.
A practical way to define one:
- Pick candidate signals that precede upgrades: the account hit a plan limit, three or more members were active in a week, the core feature was used on several days, an admin visited the pricing or billing page.
- Test them against past conversions. For accounts that upgraded in the last quarter, check which signals they showed in the weeks before; compare with accounts that did not upgrade.
- Combine into a rule, for example "at least 3 active members in 7 days and the core feature used on 4 of the last 7 days". Keep it simple enough that sales and product can both read it.
- Track the PQL conversion rate (PQLs that become paying within 30 days) and revisit the rule each quarter.
Measure accounts, not just users
Most PLG products are bought by teams. A single enthusiastic user is not an account that will pay. Track account-level metrics alongside user-level ones: members active in the last 30 days, the share of active days, the number of core features used across the account, and seats added. Falling activity in a paying account is the earliest sign of churn, often months before renewal.
Who owns which PLG metric
- Marketing: visitors and sign-ups by channel, sign-up rate (see acquisition metrics).
- Product and growth: activation rate, time to value, feature adoption (see onboarding metrics and product adoption).
- Sales or customer success: PQL volume, PQL conversion, expansion.
- Leadership: free-to-paid conversion, net revenue retention, LTV to CAC.
PLG metrics in TapCub
The PLG funnel in TapCub is a funnel analysis with up to 20 steps, each an event or page with its own filters, and a window of up to 180 days (funnels). Website stages (visit, pricing view, sign-up) and in-product stages (activation, invite, upgrade) sit in one funnel once the visitor is identified at sign-up.
For account-level metrics, calling tapcub.group(type, id) attaches identified users to an account. The accounts report shows accounts active in 30 days, members and traits, and a health score from 0 to 100: the share of members active in 30 days contributes 40 points, the share of active days 30, and recency up to 30 (accounts). That score is a useful starting signal for a PQL rule. The SaaS solution page shows how these pieces fit together.
FAQ
What are product-led growth metrics?
Metrics that follow users and accounts from first visit through sign-up, activation, product-qualified lead, paid conversion and expansion, mostly measured with product events.
What is a product-qualified lead (PQL)?
A user or account whose usage signals readiness to buy or upgrade, such as hitting a plan limit or several teammates using the core feature in the same week.
What is a good free-to-paid conversion rate?
It depends heavily on whether you run a free plan or a time-limited trial and on traffic quality. Compare your own cohorts over time before comparing with published figures.
Which PLG metric matters most?
Usually activation rate early on, because it gates everything below it. Later, net revenue retention shows whether accounts keep growing after they pay.
Do PLG companies still need sales metrics?
Often yes. Many PLG companies add sales for larger accounts; PQLs are how product usage hands those accounts to sales.
See also: Freemium model.
Was this article helpful?
We use your answers to fix and expand this page.
Couldn’t send. Please try again in a minute.
Thanks for the feedback. We’ll use it to improve this page.You’ve already sent feedback on this page. Thanks.

Growth Strategist
Explores acquisition channels, activation, and conversion experiments, turning data insights into actionable growth hypotheses and evaluation methods.