Growth & Marketing
Frameworks are cheap. These notes are about turning one of them into a measured experiment, with the reports to prove it worked.
Growth articles start from a model (AARRR, a funnel, a retention curve) and end with a concrete experiment and the report that judges it. They also cover acquisition and marketing (SEO, ads, UTM, attribution) and the day-to-day operations of a website, app or mini program. We write them for marketers, growth and product people who have more ideas than engineering time and need a way to rank them.
Articles in Growth & Marketing
238 articles · page 1 of 5
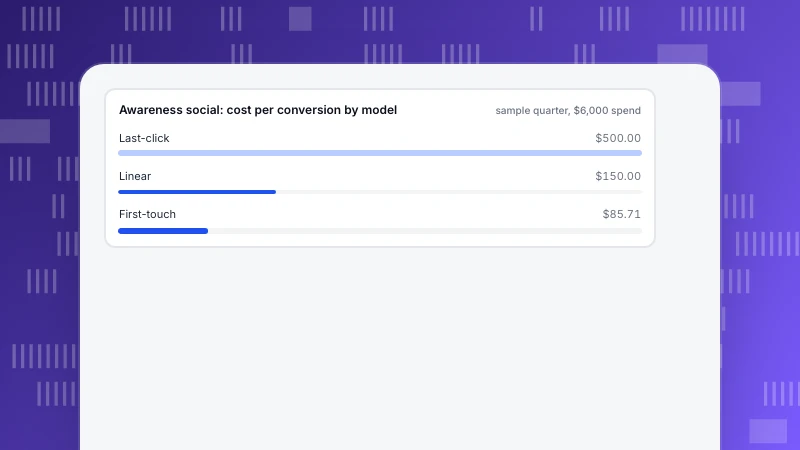
Upper Funnel Marketing: Tactics and the Metrics That Prove They Work
Upper funnel marketing is judged by reach, engaged sessions and assisted conversions, not last-click sales. A metric table by stage and a three-channel example where awareness costs $500 or $85.71 per conversion depending on the model.
Read more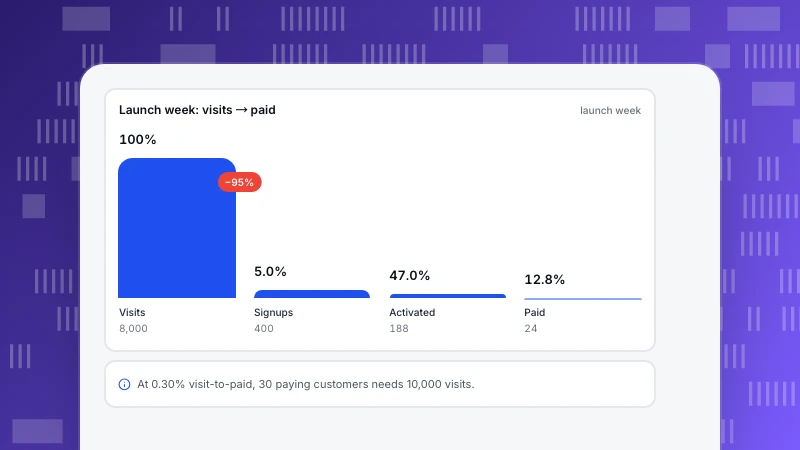
SaaS product launch checklist: what to measure before, during and after
How to launch a SaaS product with numbers: back-solve traffic from a goal, pass-condition checks before launch, a by-source launch-week table and week 2–4 checks.
Read more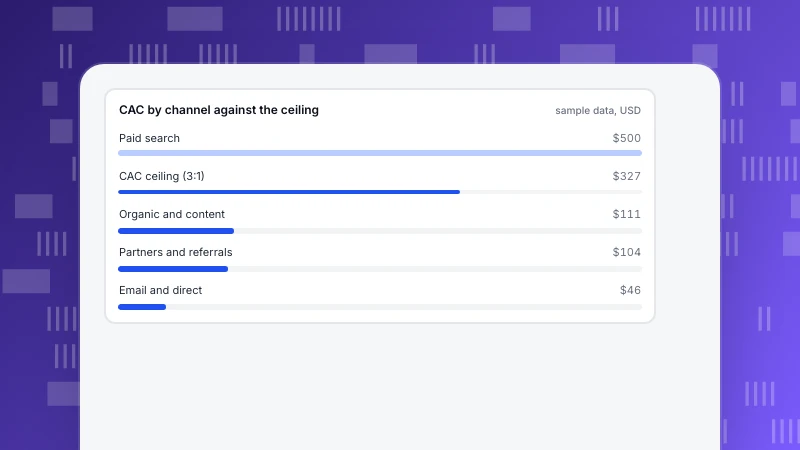
SaaS marketing plan: a metrics-first template with funnel math
A SaaS marketing plan built backward from the revenue target: customers to sign-ups to visitors, a CAC ceiling from LTV, channel budgets checked one by one, KPIs and a 90-day calendar, with every number recalculated.
Read more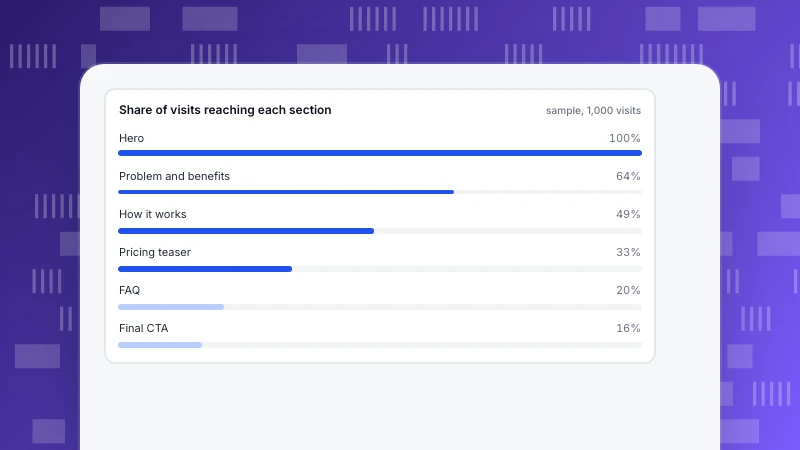
SaaS Landing Page Examples: The Structure Behind Pages That Convert
SaaS landing page examples broken into nine sections, three composite structures and a scroll-reach table you can recompute, with what each section must prove and the number that shows it works.
Read more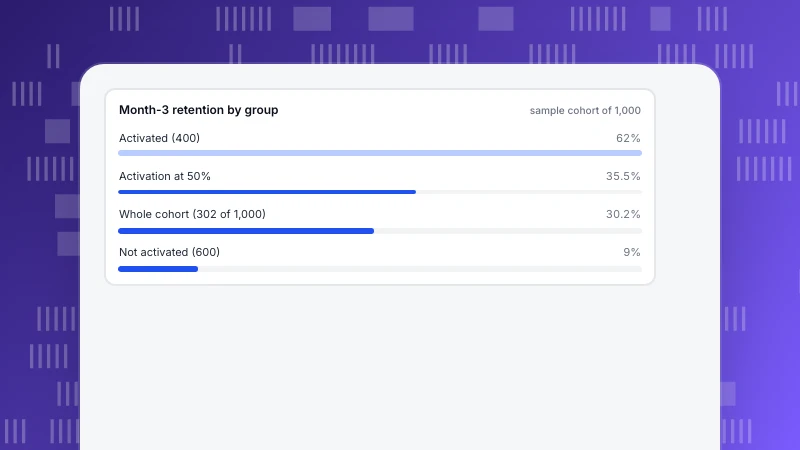
SaaS customer retention strategies, tied to usage and cohort data
SaaS retention is decided early. A cohort split by activation prices each strategy in customers: raise activation, reach stalled signups, flag usage drops, track B2B accounts and keep billing failures separate.
Read more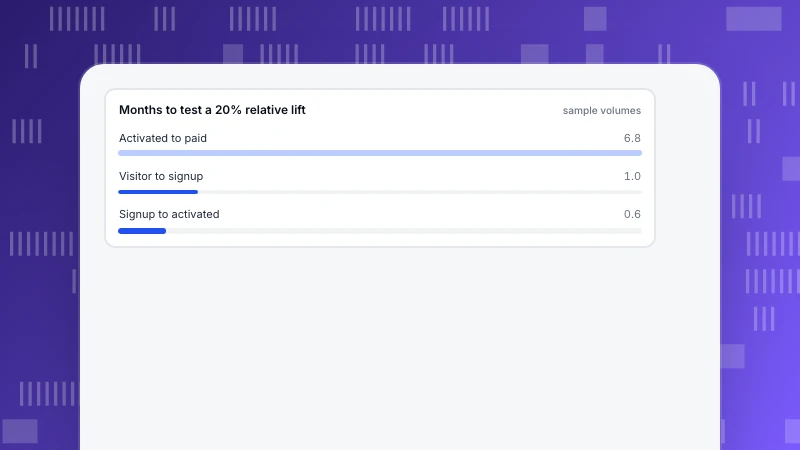
SaaS CRO: Fixing the Visitor-to-Signup-to-Paid Funnel
SaaS CRO means measuring four funnel stages and working on the one you can actually test. A worked funnel, a sample-size table showing paid conversion needs 6.8 months to test, fixes per stage and TapCub steps.
Read more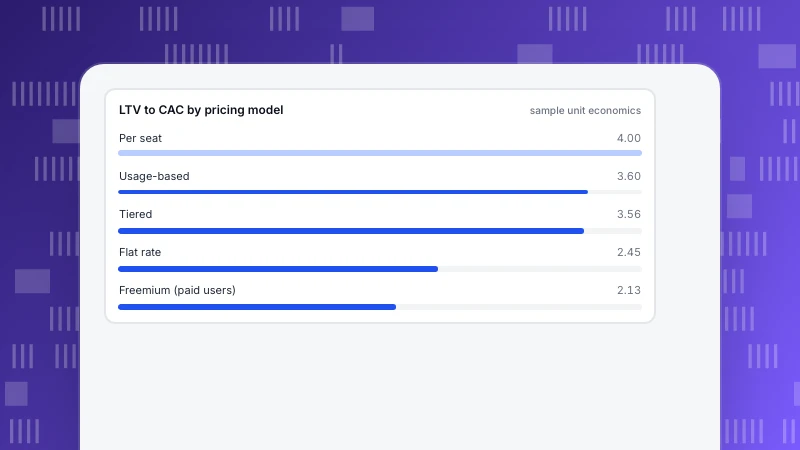
SaaS business model examples, compared on unit economics
Five SaaS pricing models compared on one set of formulas: LTV, LTV to CAC and CAC payback for flat rate, per seat, tiered, usage-based and freemium, plus how sensitive LTV is to churn.
Read more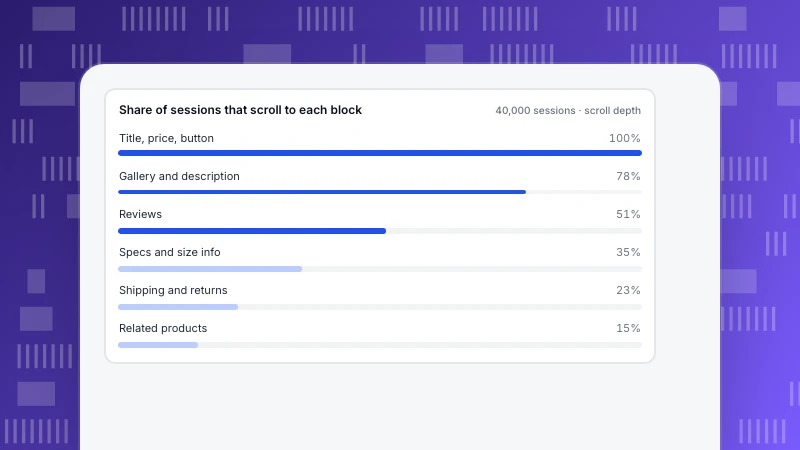
Ecommerce Product Page Optimization: Fix the Highest-Reach Element First
Rank product page changes by how many shoppers see them, how much you think each could add and how hard it is. A worked example turns six ideas into an order of work in extra orders per effort.
Read more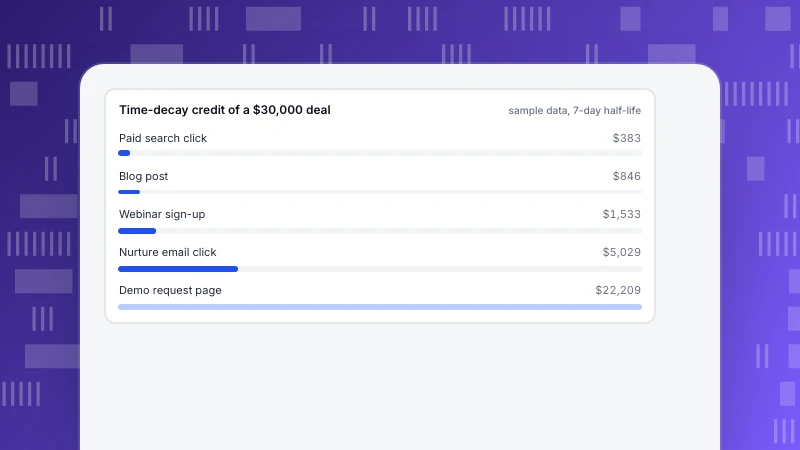
Pipeline attribution: opportunity-level vs lead-level credit with a worked deal
Pipeline attribution credits the touches behind each opportunity. One $30,000 deal credited under five models, why lead-level credit ignores nurture and double counts contacts, and how long the lookback window must be.
Read more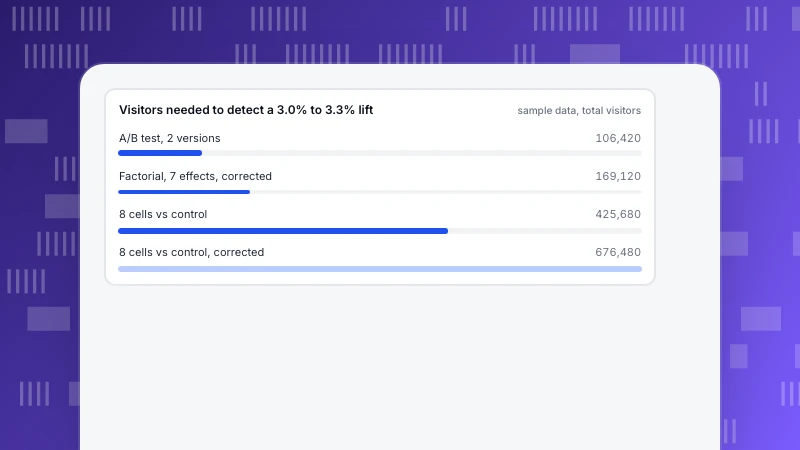
Multivariate testing: the traffic math that decides whether it beats A/B testing
A multivariate test shows every combination of several page elements. Count the combinations, size the sample (53,210 per version in our example) and see when testing effects instead of cells makes it practical.
Read more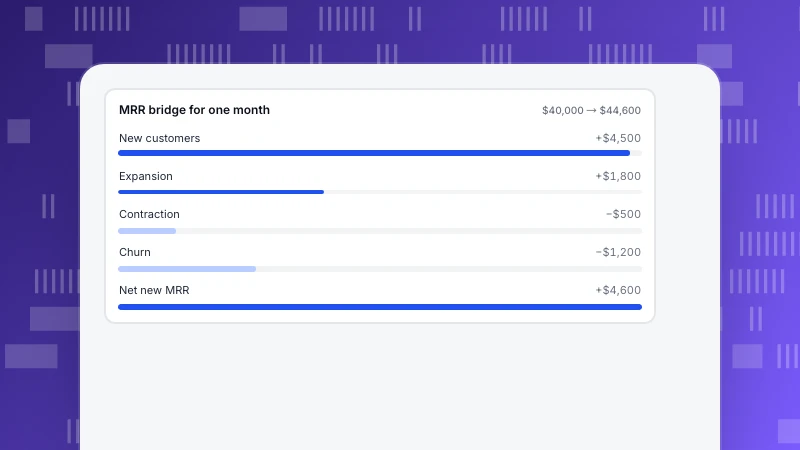
MRR vs ARR: differences, conversion and when to use each
ARR is MRR × 12, but the choice and the conversion are not trivial. An MRR bridge with expansion and churn, a mixed monthly and annual example, why churn cannot be multiplied by 12 and how to audit the number.
Read more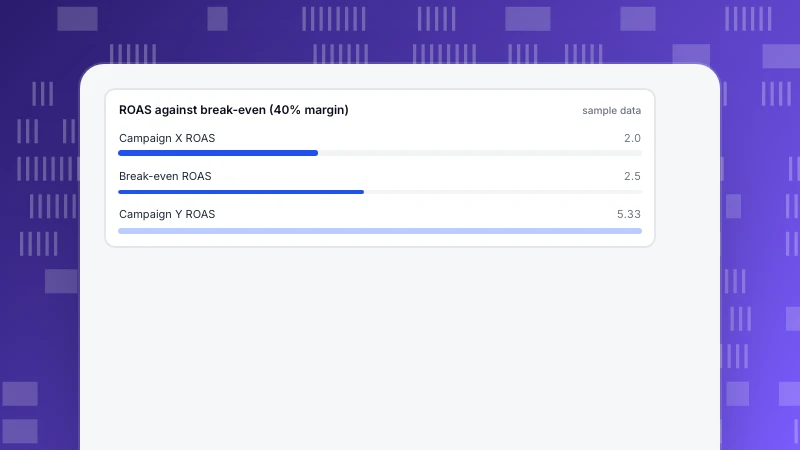
Most important PPC metrics: the path from spend to profit, with break-even math
The PPC metrics that matter sit on one path from spend to profit. One campaign with every number, how to find break-even ROAS, CPA and CPC from margin, and why the campaign with the best CTR can lose money.
Read more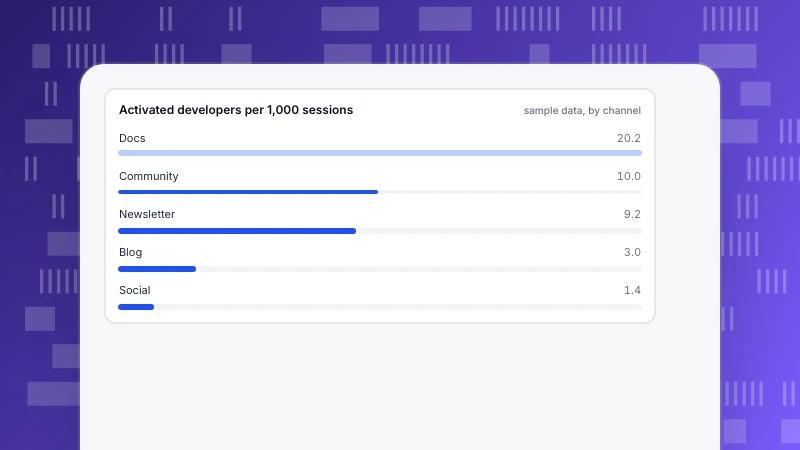
Marketing to developers: docs-led tactics and the metrics that prove them
Five docs-led, trust-first tactics for marketing to developers, with Stack Overflow survey data on where developers learn and a channel table of signup and activation rates.
Read more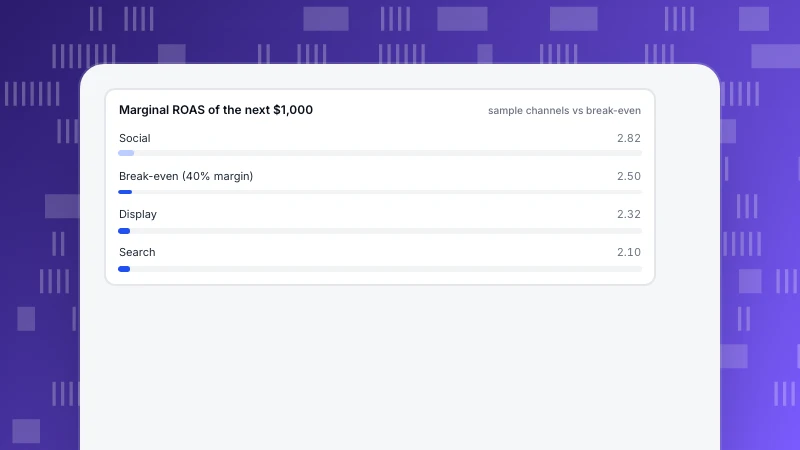
Marketing Budget Optimization: Allocate Spend by Marginal Return
Marketing budget optimization means moving a fixed budget to where the next dollar returns the most. Compare average and marginal ROAS, check against break-even, reallocate in small steps and verify with a holdout.
Read more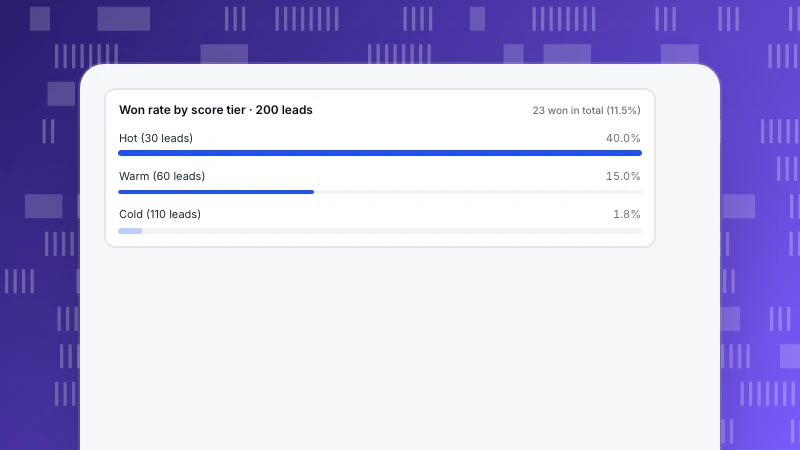
How to Qualify a Lead: Behavioral Signals and a Points Rule
Qualify leads by what they do, not only what they say. A points table built from page, event and chat signals, three scored examples, and a check against 200 outcomes.
Read more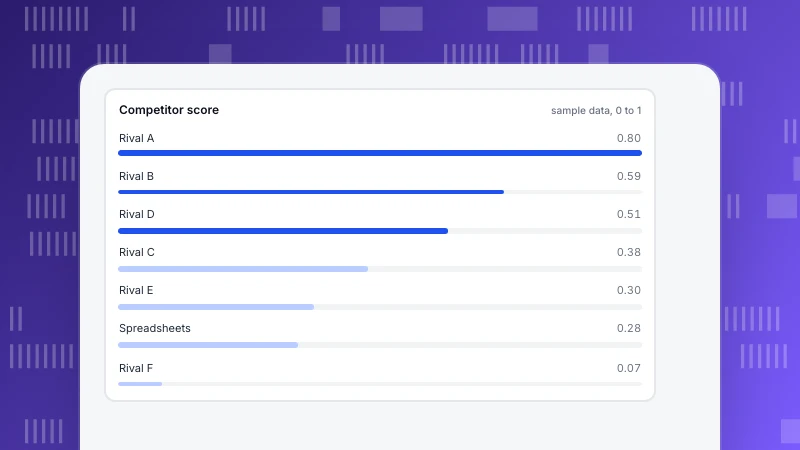
How to identify your competitors: direct, indirect and search rivals
Find your competitors with evidence instead of memory: search results, customer conversations, ad auctions and referrals, combined into one score with core, watch and ignore tiers. Includes a worked example.
Read more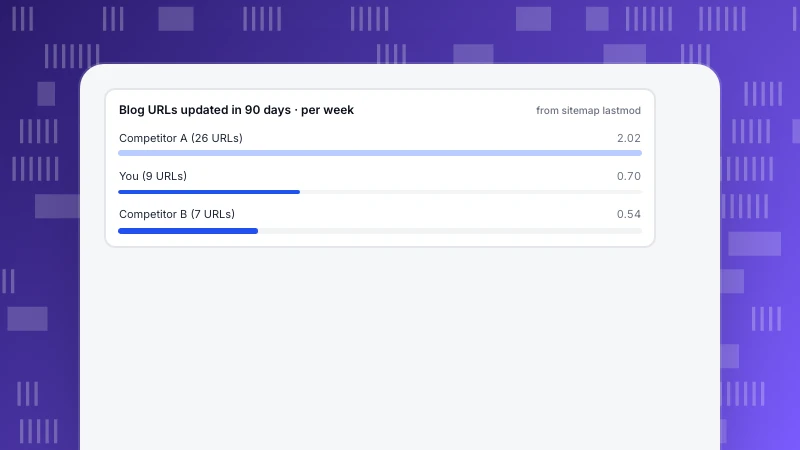
How to find out a competitor's marketing strategy, channel by channel
Public data shows what a competitor does, not what works for them. Read their ads, content cadence, source mix and positioning, and turn each finding into a hypothesis with a test and a number to watch.
Read more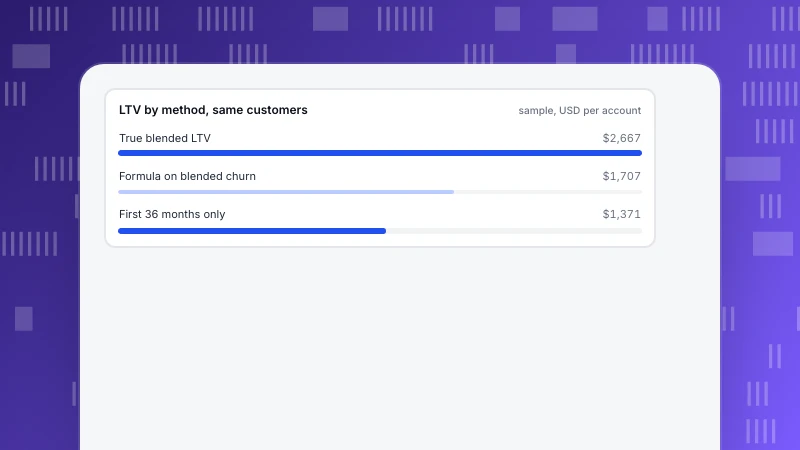
How to Calculate LTV for SaaS: ARPA, Gross Margin, Churn and the Cohort Gap
The SaaS LTV formula with a worked example, a churn sensitivity table and a two-segment case where the simple formula is 36% below the true value, plus LTV to CAC and payback checks.
Read more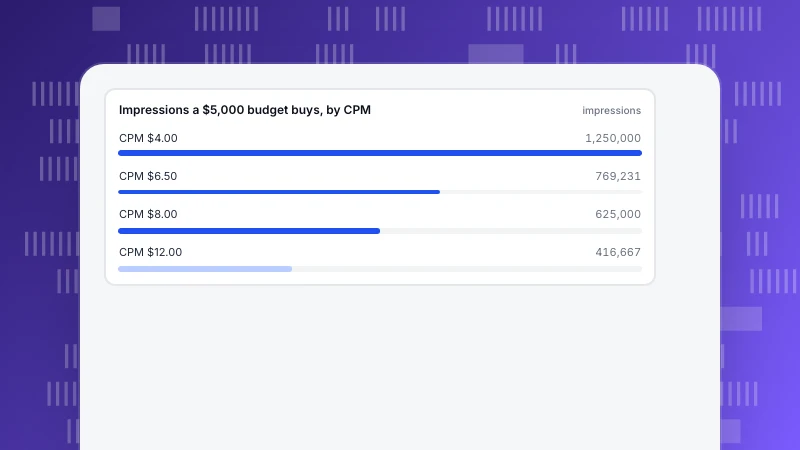
Impressions Formula: How to Calculate Ad Impressions From Reach, Frequency and CPM
The impressions formulas worked on one campaign: reach × frequency, budget ÷ CPM × 1,000, clicks ÷ CTR, plus served versus viewable impressions and how to verify the clicks that reach your site.
Read more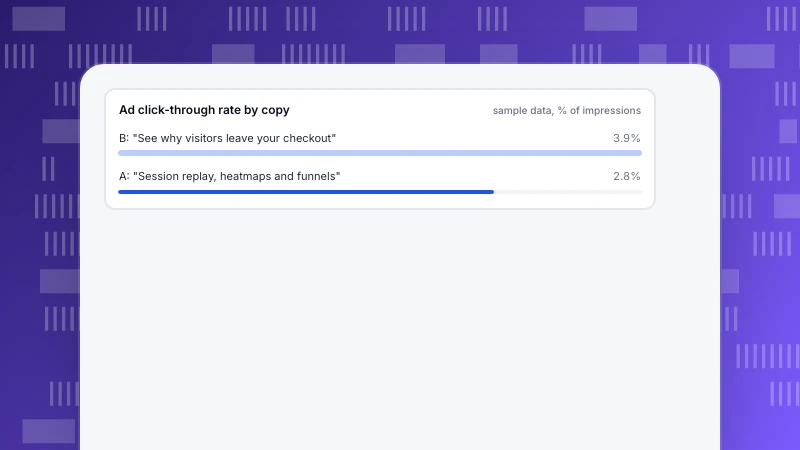
Features and benefits: how to write both, with before-and-after copy and a test
Features describe the product, benefits describe the customer's gain. How to translate one into the other with a repeatable test, before-and-after copy and a click-through experiment with sample size.
Read more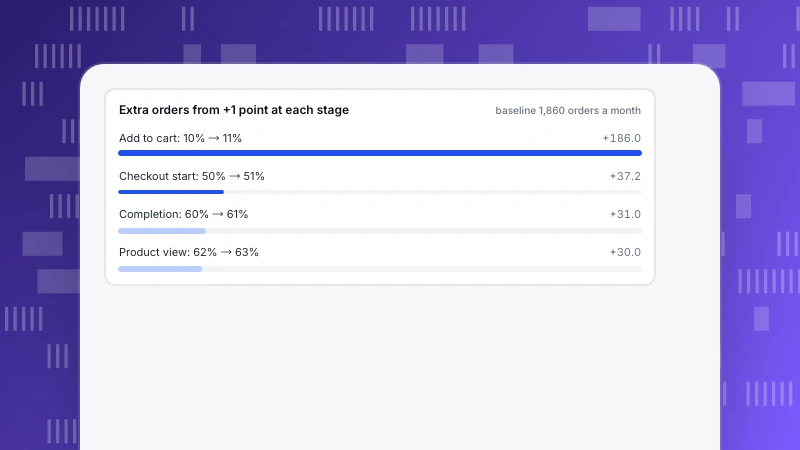
Ecommerce Strategies That Move the Numbers: A Funnel-Stage Playbook
Group ecommerce strategies by funnel stage and tie each to the metric it moves. A worked funnel shows why you choose by absolute points and effort, not by the biggest percentage.
Read more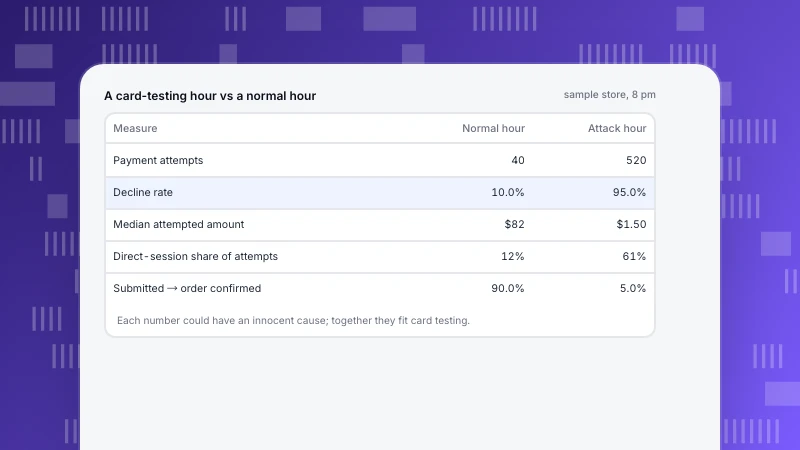
Ecommerce Fraud Prevention Techniques and the Traffic Signals Behind Them
Analytics cannot approve or decline payments, but it can show an attack early. Learn the signals (attempt spikes, decline surges, direct-traffic shifts, funnel breaks), thresholds and matched countermeasures.
Read more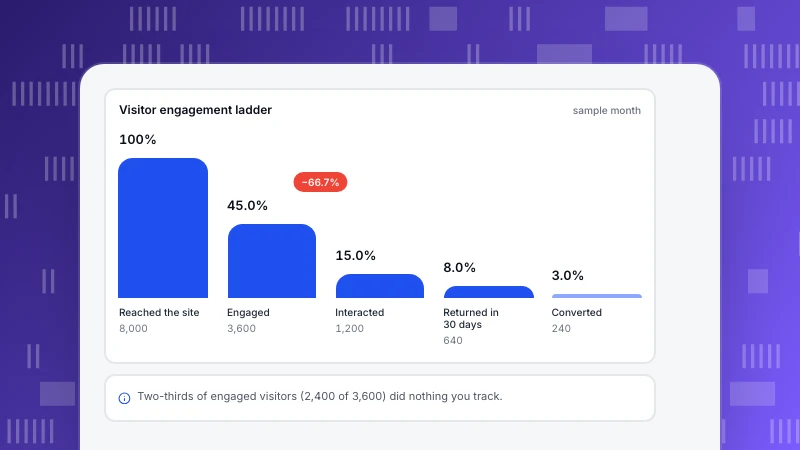
Digital Engagement Marketing: What to Measure and How
Digital engagement marketing is only worth reporting as behavior you can count: a five-rung ladder from reach to value, a worked visitor ladder, cost per engaged session instead of cost per click, and what attention research says about placement.
Read more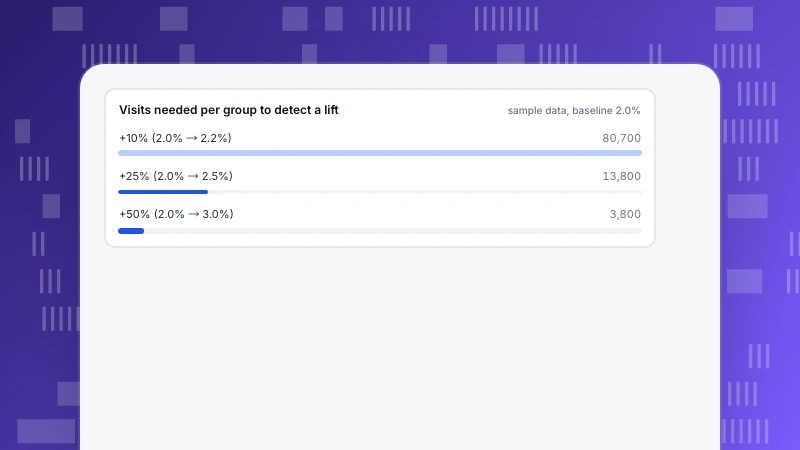
CRO tips: eight changes, each with the metric that proves it
Eight CRO tips in metric-and-check form, the sample size you need to see a result, and how to rank tips by expected conversions.
Read more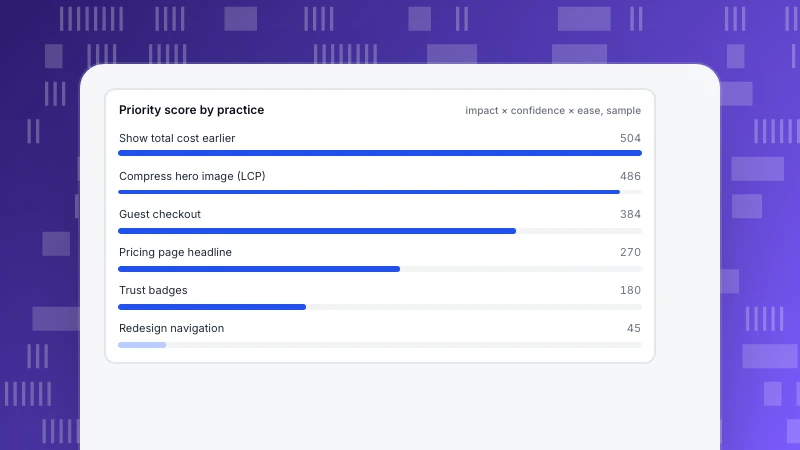
CRO Best Practices: Seven Practices Ranked by Evidence and Effort
Seven CRO best practices ranked with an impact, confidence and ease score, the evidence and metric for each, and how many visitors you need to detect a lift at a 3.0% baseline.
Read more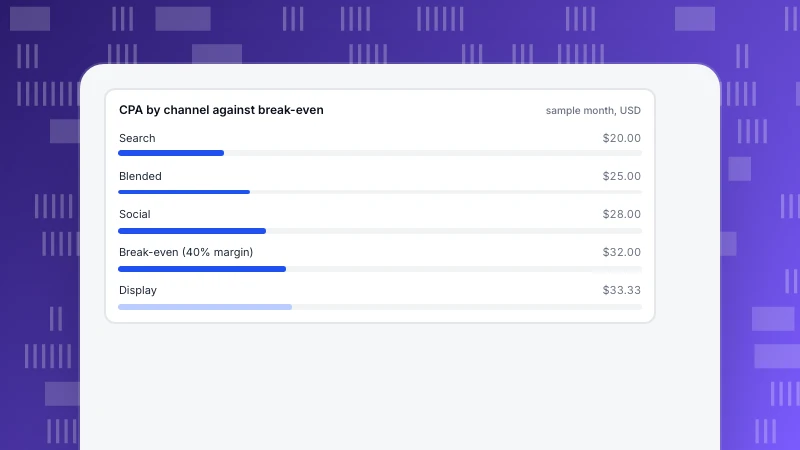
CPA Formula: How to Calculate Cost Per Acquisition With Examples
The CPA formula is total cost divided by acquisitions. Learn how CPA differs from CAC, why blended CPA hides channel and marginal CPA, and how to set a break-even target with a worked table.
Read more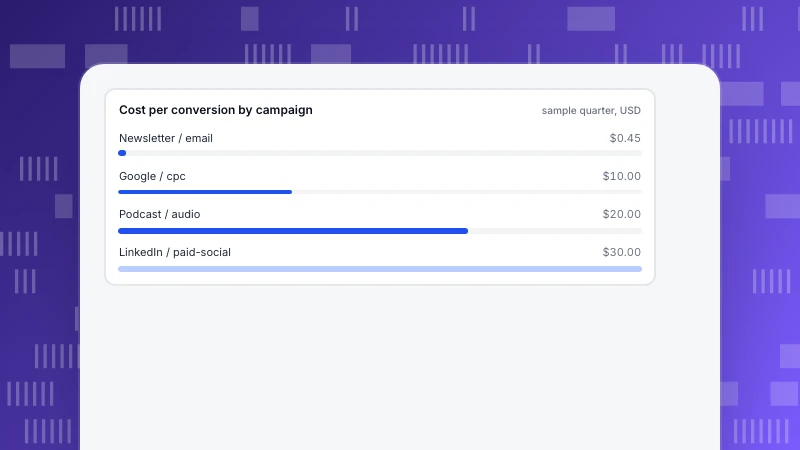
Campaign Tracker: Build One With UTM Naming and a Sheet Template
A campaign tracker joins plan, tags and outcomes in one row per campaign and source. UTM naming rules, a column template, a filled example with every rate recomputed, and the mistakes that split one campaign into many rows.
Read more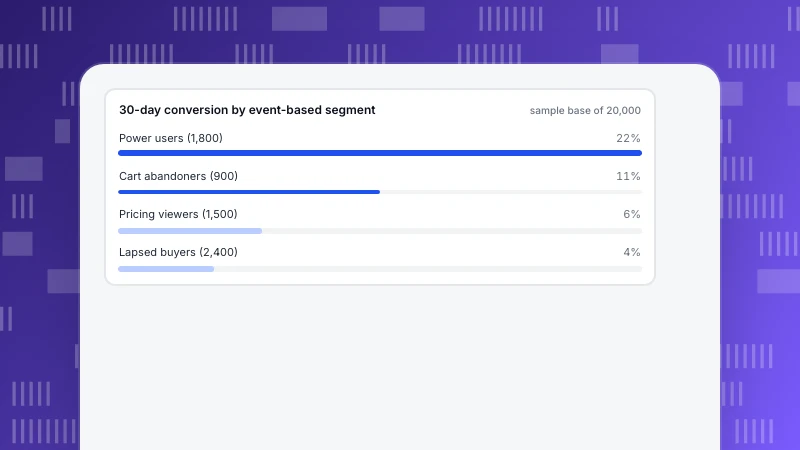
Audience Segmentation Tools: Ten Criteria to Compare Before You Choose
Ten criteria with a pass test each, a weighted comparison matrix, five segments built from events with sizes and intervals, a one-hour trial and the privacy checks for profiling.
Read more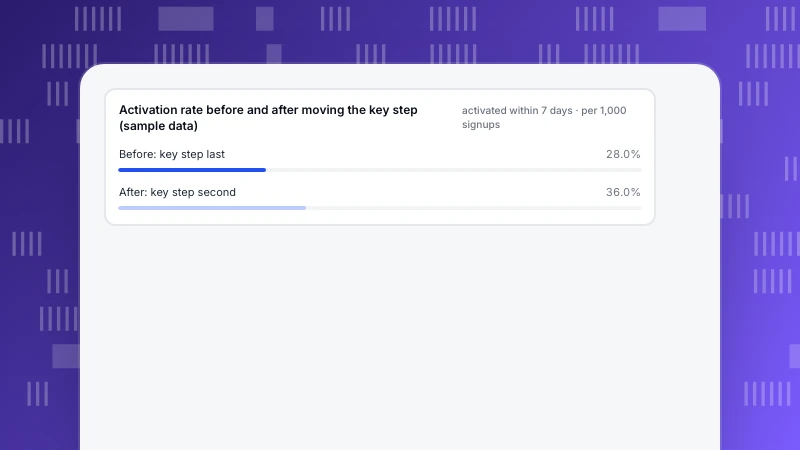
User Activation Rate: How to Define, Measure and Improve It
Activation rate is the share of new users who reach a key early milestone. How to pick the activation event from data, build the funnel, find where users stall and lift the rate.
Read more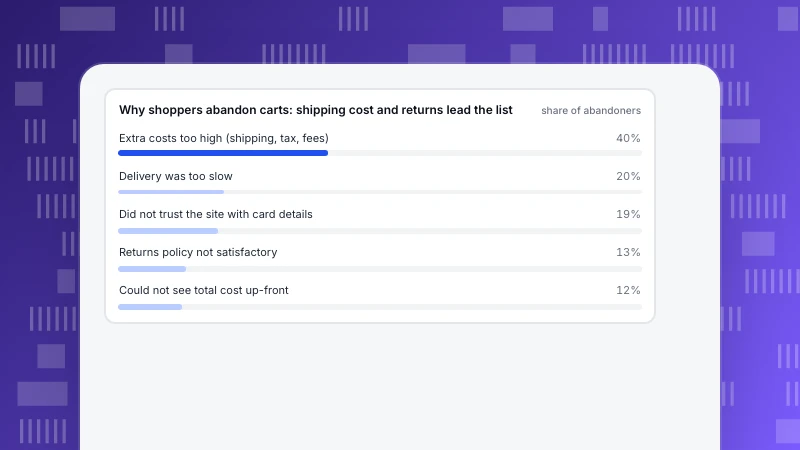
Return Policy Template: Copy-Paste Return and Shipping Policies for Ecommerce
Copy-paste return policy and shipping policy templates for apparel, electronics, final-sale and digital stores, the clauses each needs, where to show them before checkout, and a 12-point checklist.
Read more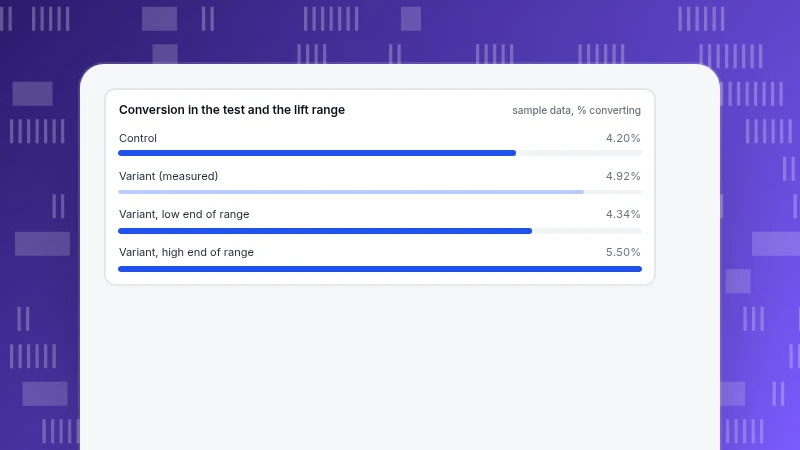
Web Personalization Steps: From Segment to Measured Lift
The six steps of web personalization, run on one worked example from segment to a holdout test, with sample size, significance and a lift range turned into money.
Read more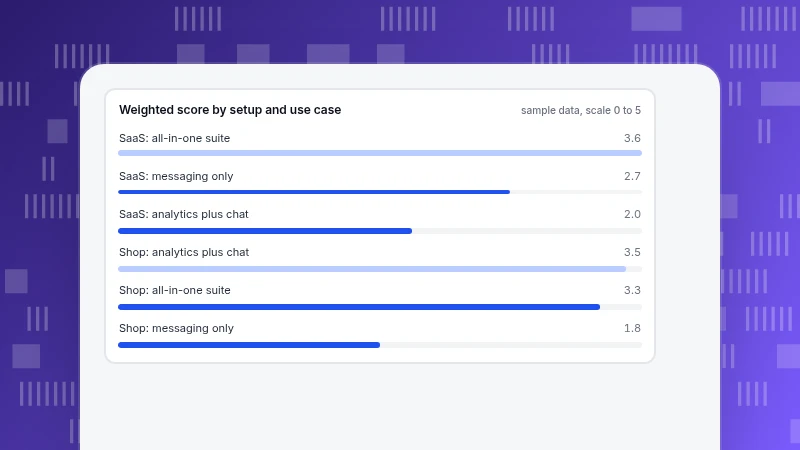
User Engagement Platform: Capabilities by Use Case
What a user engagement platform does, which of four capability families you need for your use case, how to score options and what lift a monthly price has to deliver.
Read more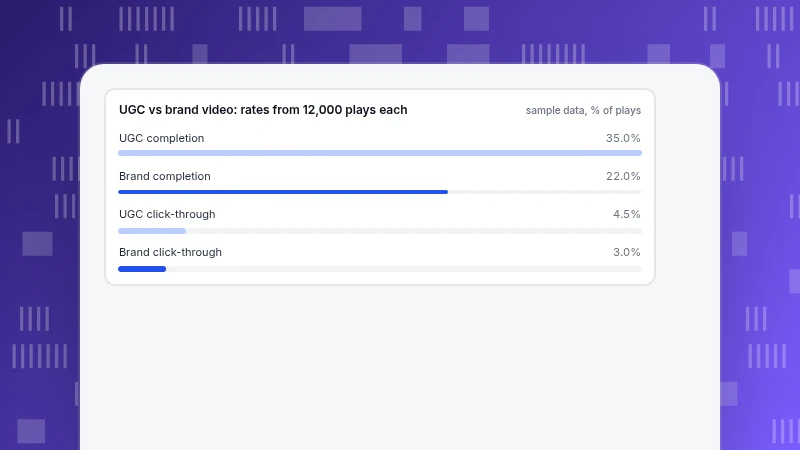
What Are UGC Videos? Types and How to Measure Them
UGC videos are made by customers or creators rather than your team. Five types, a UGC versus brand video metric table with recomputed rates, and the rules on permission and disclosure.
Read more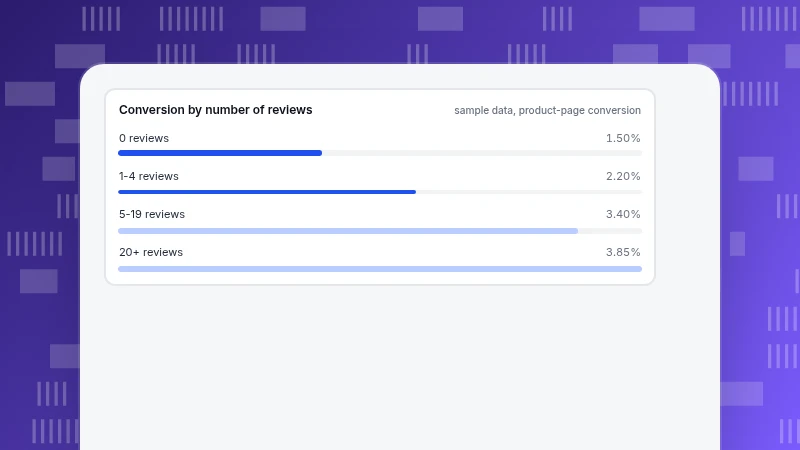
UGC Examples: 8 Types and the Metric Each One Tracks
Eight examples of user-generated content, each paired with the metric it tracks and where it is measured, with recomputable sample data for reviews and a photo contest.
Read more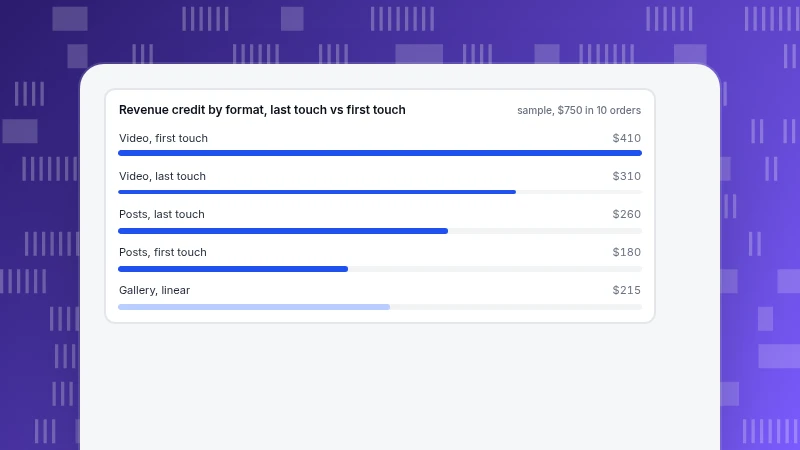
Shoppable Content Examples and How to Track Revenue From Each
Five shoppable content formats with examples, a UTM naming table for each, and a recomputed ten-order example that credits revenue four ways and shows why margin return can be below 1 when revenue return looks fine.
Read more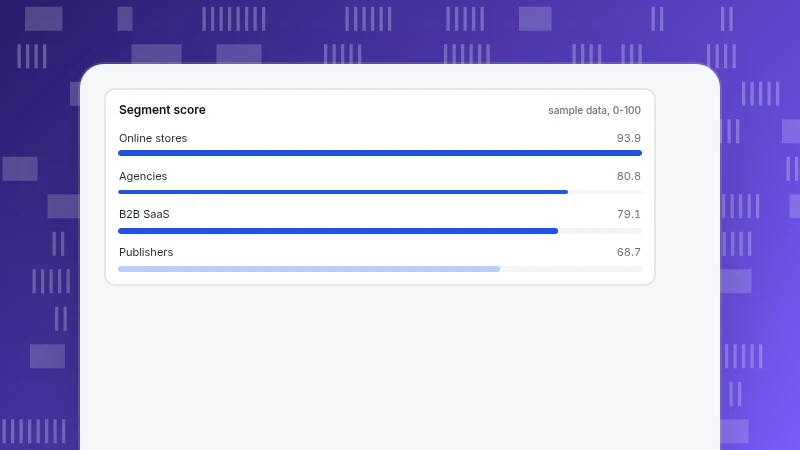
Segmentation, Targeting and Positioning (STP): A Worked SaaS Example
A worked example of segmentation, targeting and positioning for an analytics SaaS: four segments scored on activation, conversion, plan value and retention, confidence intervals, and a positioning statement with proof.
Read more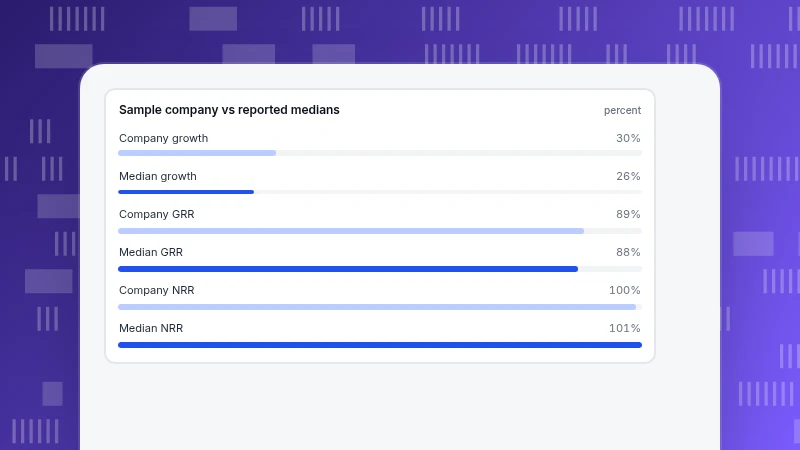
SaaS Benchmarks by Stage: Growth, Retention and CAC Payback
What public reports say about SaaS growth, churn, NRR and CAC payback, sliced the way each report slices them, with a worked $3M ARR example and a rule for choosing the right comparison.
Read more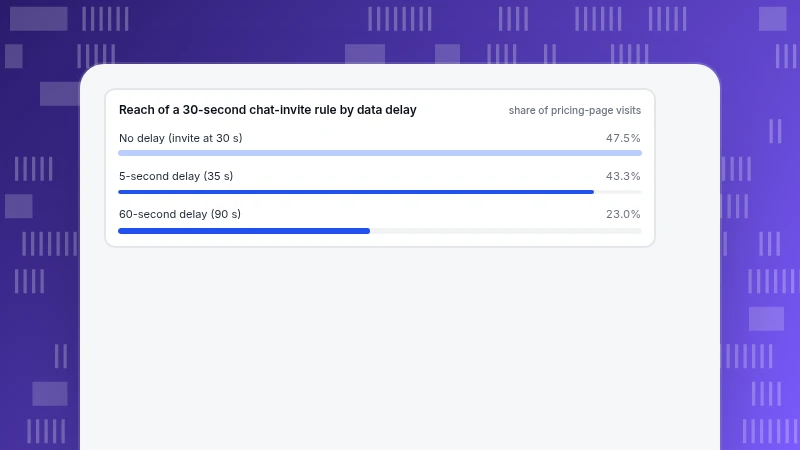
Real-Time Customer Engagement: Triggers, Data and Examples
Real-time customer engagement is acting while the opportunity lasts. See a latency budget, four event-to-action examples and a worked example of how data delay shrinks a chat invite's audience.
Read more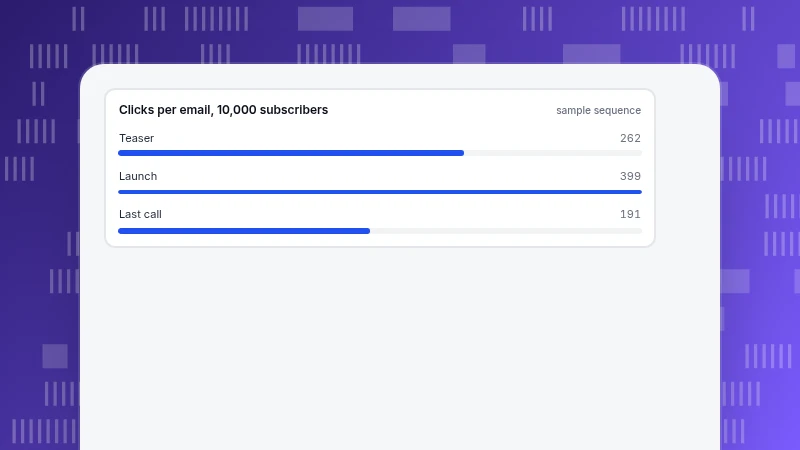
Product Launch Email: Three-Email Sequence and Benchmarks
A three-email product launch sequence with a structure for each message, Mailchimp benchmark rates with caveats, a worked 10,000-subscriber example and the compliance rules to check before sending.
Read more
Overlay Popup Best Practices: Types and Google Rules
How to use overlay popups without losing orders or search visibility: trigger types with measured signup rates, what Google's interstitial guidance says, accessibility checks and a break-even example.
Read more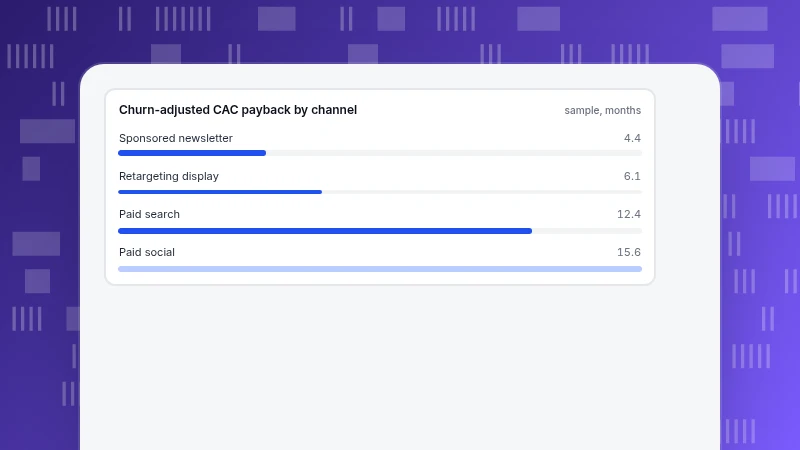
Paid User Acquisition: Channels Costs and CAC Payback
How to judge paid user acquisition by CAC payback: formulas, published benchmarks, a four-channel worked example with churn-adjusted payback, a month-by-month cohort and decision rules.
Read more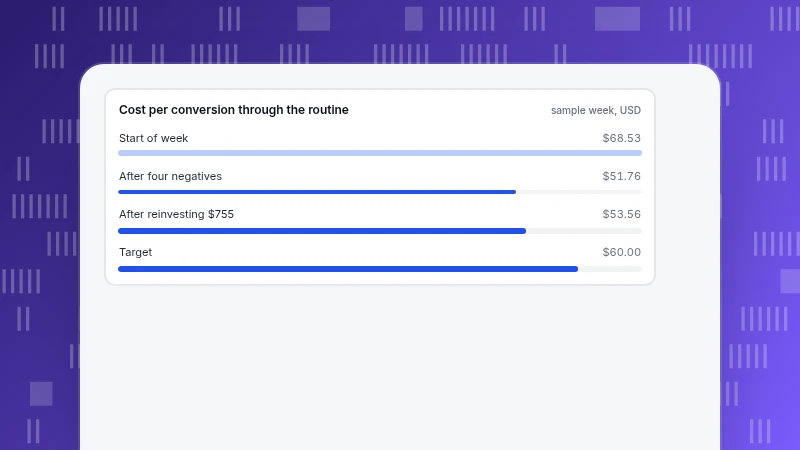
Paid Search Optimization: A Six-Step Weekly Routine With Numbers
Use a sample search terms report to decide which negative keywords to add, when you have enough clicks to judge a term, and how to adjust bids, budget and pages each week.
Read more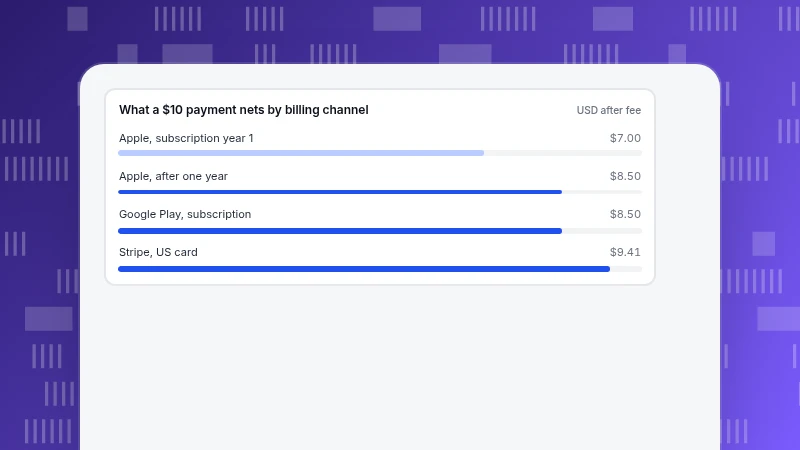
Monetization Models: Seven Types and the Metric for Each
Seven monetization models side by side, each with a revenue formula, the one metric that tells you it works, a recomputed sample, and what app stores and payment processors take.
Read more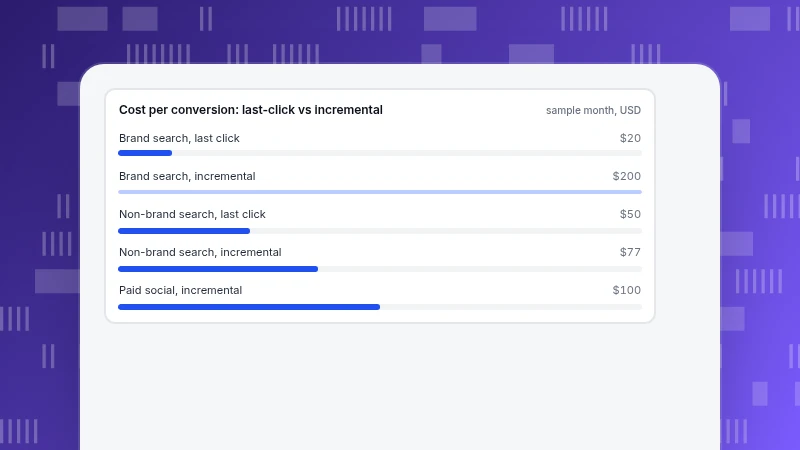
Marketing Effectiveness: Measuring Incremental Results Beyond Clicks
Marketing effectiveness is how much of a result your marketing caused. Read one budget as last-click and as incremental conversions, see the ranking flip, and learn how to test it.
Read more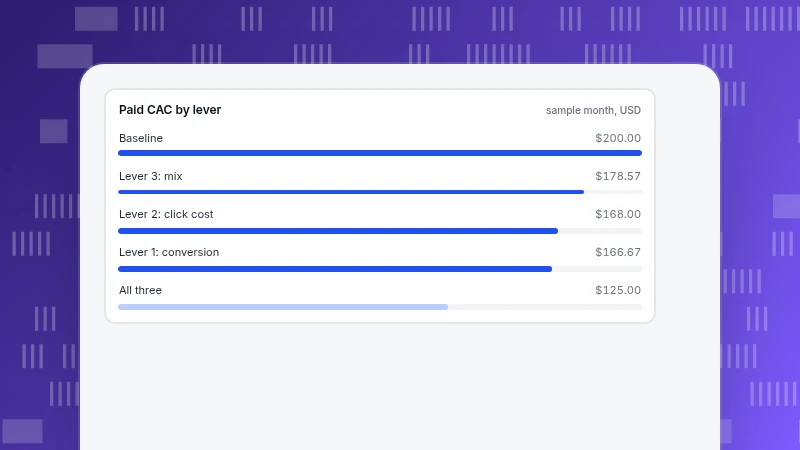
How to Lower Customer Acquisition Cost: Three Levers With the Math
CAC equals cost per click divided by conversion rate. Work through three levers on one baseline: conversion, click cost and channel mix, and see how they combine.
Read more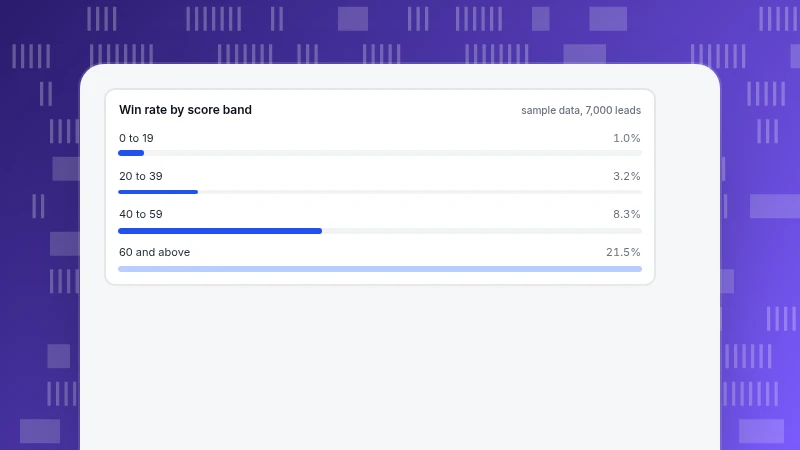
How to Use Intent Data for Sales: From Signals to Scores to Routing
Turn first-party intent signals into a score you can defend: a signal-to-points table, a worked score for four visitors, a recomputed backtest by score band and a sample routing rule with a capacity check.
Read more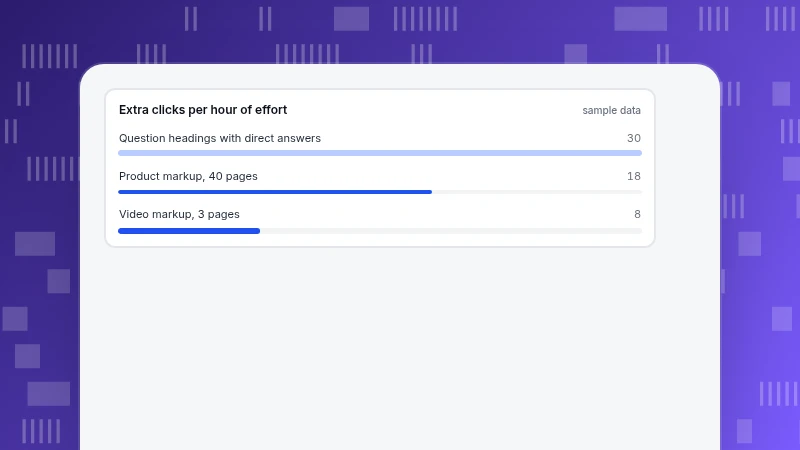
How to Get SERP Features: Which Ones You Can Earn and How to Measure Them
How to get SERP features in 2026: which ones you can earn with content, which need structured data, which Google has retired, and how to prove a feature raised clicks with a before-and-after calculation.
Read more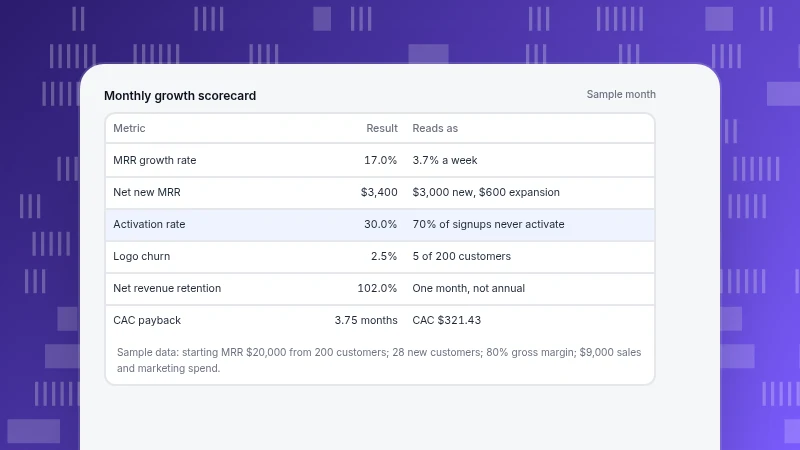
Growth Metrics: 10 Numbers With Formulas and a Worked Month
Ten growth metrics with formulas, all calculated from one month of sample data: revenue growth, activation, churn, retention, CAC payback and the Rule of 40, with period conversion rules and a pick-by-stage guide.
Read moreOther categories
Each category answers a recurring question we hear from customers. Start with the one closest to your job.
Analytics
Definitions, funnels, retention and the data-quality questions behind every number.
304 articlesLive Chat
Proactive invites, translation and turning support conversations into conversions.
78 articlesAI Search
GPTBot, ClaudeBot, PerplexityBot: who fetches your pages, what the files say and what comes back.
39 articlesProduct News
What shipped, why we built it that way, and how to turn it on.
64 articles