Try it on your own data
Every report in this article is in the free plan. One snippet for web and apps, up to 10 sites.
Start freeGrowth metrics are the numbers that show whether a business is getting bigger and whether that growth will repeat: revenue growth, activation, churn, retention and payback. Ten of them are calculated here from one sample month, where MRR grew 17.0% but only 30% of signups activated, which is the step to fix first.
What you will learn
- Ten metrics answer four questions: are we adding, does it convert, do customers stay, can we afford it
- One sample month: MRR +17.0% (3.7% a week), NRR 102.0%, CAC payback 3.75 months, but only 30.0% of signups activate
- Convert periods before comparing and pick metrics by the earliest question you cannot yet answer
What makes a number a growth metric
A growth metric is a number that tells you whether the business is getting bigger and whether that growth is repeatable. A big total is not enough: 10,000 signups mean little if nobody activates and half of the paying customers leave within a year. So the useful set answers four questions, in order:
- Are we adding? Revenue growth, new customers, signups.
- Does what we add turn into customers? Activation and paid conversion.
- Do customers stay and spend more? Churn and retention.
- Is the growth affordable? Payback on acquisition cost and the balance of growth against profit.
This guide gives ten metrics, one per row, with the formula and the question it answers. It then calculates all ten from a single month of sample data, so you can see how they connect. Revenue growth alone is covered in more detail in revenue growth rate, and the metrics a product-led business adds are in product-led growth metrics.
The ten metrics, with formulas
| # | Metric | Formula | Question it answers |
|---|---|---|---|
| 1 | MRR growth rate | (ending MRR − starting MRR) ÷ starting MRR | How fast is recurring revenue growing? |
| 2 | Net new MRR | new + expansion − contraction − churned MRR | How much did revenue change in dollars? |
| 3 | Visitor-to-signup rate | signups ÷ visitors | Is the site turning attention into accounts? |
| 4 | Activation rate | signups who reach the first-value action ÷ signups | Do new accounts get value? |
| 5 | Signup-to-paid rate | new paying customers ÷ signups | Does value turn into revenue? |
| 6 | Logo churn rate | customers lost in the period ÷ customers at the start | How many customers leave? |
| 7 | Gross revenue retention (GRR) | (starting MRR − contraction − churned MRR) ÷ starting MRR | How much revenue do we keep, ignoring upsell? |
| 8 | Net revenue retention (NRR) | (starting MRR + expansion − contraction − churned MRR) ÷ starting MRR | Does the existing base grow or shrink? |
| 9 | CAC payback (months) | CAC ÷ (new MRR per customer × gross margin) | How long to win back the acquisition cost? |
| 10 | Rule of 40 | annual revenue growth % + profit margin % | Is growth balanced with profit? |
SaaS Capital defines the retention pair precisely: NRR is the monthly recurring revenue today from customers who were customers twelve months ago, divided by their MRR then, and it includes upsells, cross-sells and price increases. GRR uses the same formula without those, so it cannot exceed 100%. Retention is conventionally a twelve-month measure, which matters when you calculate it from one month, as the example below does.
Worked example: one month, ten numbers
Sample data: a subscription product, one calendar month.
| Input | Value |
|---|---|
| Starting MRR | $20,000 from 200 customers |
| New MRR | $3,000 from 28 new customers |
| Expansion MRR | $600 |
| Contraction MRR | $50 |
| Churned MRR | $150 from 5 customers |
| Sales and marketing spend | $9,000 |
| Gross margin | 80% |
| Visitors, signups, activated, new paying | 20,000, 600, 180, 28 |
Ending MRR = 20,000 + 3,000 + 600 − 50 − 150 = $23,400, from 200 + 28 − 5 = 223 customers.
| # | Metric | Calculation | Result |
|---|---|---|---|
| 1 | MRR growth rate | (23,400 − 20,000) ÷ 20,000 | 17.0% |
| 2 | Net new MRR | 3,000 + 600 − 50 − 150 | $3,400 |
| 3 | Visitor-to-signup | 600 ÷ 20,000 | 3.0% |
| 4 | Activation | 180 ÷ 600 | 30.0% |
| 5 | Signup-to-paid | 28 ÷ 600 | 4.7% |
| 6 | Logo churn | 5 ÷ 200 | 2.5% |
| 7 | GRR (one month) | (20,000 − 50 − 150) ÷ 20,000 | 99.0% |
| 8 | NRR (one month) | (20,000 + 600 − 50 − 150) ÷ 20,000 | 102.0% |
| 9 | CAC payback | CAC = 9,000 ÷ 28 = $321.43; new MRR per customer = 3,000 ÷ 28 = $107.14; 321.43 ÷ (107.14 × 0.80) | 3.75 months |
| 10 | Rule of 40 (company, twelve months) | 60% growth + (−25%) free cash flow margin | 35 |
The numbers connect. Net new MRR of $3,400 is mostly new customers ($3,000) with expansion adding $600 and losses taking $200. The funnel shows the weakest step: 70% of signups never activate (180 of 600), and only 15.6% of activated accounts pay (28 of 180). Fixing activation changes the paid number directly.
The tenth metric uses a different time scale, so it takes its own sample inputs: the whole company over twelve months, with revenue growth of 60% and a free cash flow margin of −25%. 60 + (−25) = 35, below the 40 threshold. It is not derived from the monthly figures above.
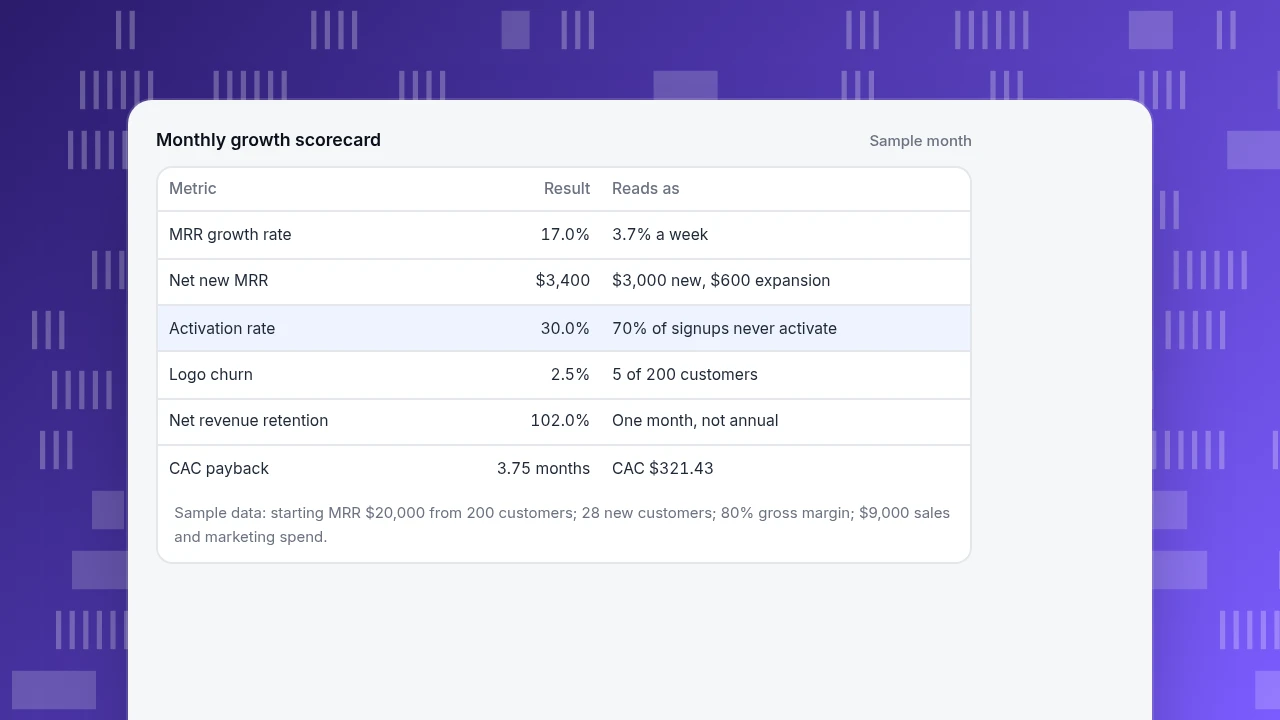
Monthly growth scorecard
Sample month| Metric | Result | Reads as |
|---|---|---|
| MRR growth rate | 17.0% | 3.7% a week |
| Net new MRR | $3,400 | $3,000 new, $600 expansion |
| Activation rate | 30.0% | 70% of signups never activate |
| Logo churn | 2.5% | 5 of 200 customers |
| Net revenue retention | 102.0% | One month, not annual |
| CAC payback | 3.75 months | CAC $321.43 |
Sample data: starting MRR $20,000 from 200 customers; 28 new customers; 80% gross margin; $9,000 sales and marketing spend.
Is 17% a month fast? Compare in the same period
Growth rates only make sense in the same unit. Paul Graham wrote that a good growth rate for a startup in Y Combinator is 5–7% a week, and that 10% a week is exceptional. To compare, convert: 17% a month is (1.17)^(7 ÷ 30.4375) − 1 = 3.7% a week, below his 5–7% range, though it is a different kind of business from the early startup he describes. Compounding shows why the unit matters. Graham notes that 5% a week is about 12.6 times in a year and 1% a week about 1.7 times; checking: 1.05^52 = 12.6 and 1.01^52 = 1.68. The sample's 17% a month, held for twelve months, is 1.17^12 = 6.6 times.
Two rules for reading growth rates:
- Convert before comparing. Weekly, monthly and annual rates are not interchangeable; compound them, do not multiply.
- One month is a point, not a trend. If a single large customer made up the $3,000 of new MRR, the 17% says little about next month. Look at three or more months and at the median, not only the best one.
Retention: the part growth depends on
New customers fill a bucket; retention is the size of the hole in it. In the sample, one-month GRR is 99.0% and NRR is 102.0%, so the existing base grew on its own. Annualizing one month is crude, but 1.02^12 = 126.8% shows the scale. Bessemer's published benchmarks put median net retention at 125% for companies with $1–10 million in ARR, 117% at $10–25 million and 115% above $100 million. A one-month figure is not comparable with these twelve-month ones, so use the sample number as an illustration of the formula, not as a claim of being above benchmark.
Rules that avoid common retention errors:
- Report logo churn and revenue churn together. Losing 5 of 200 customers is 2.5% of logos but only $150 of $20,000, 0.75% of revenue. Both are true.
- Do not let expansion hide churn. NRR above 100% can coexist with losing customers; always show GRR beside it.
- Cohort, do not blend. A single blended churn number hides whether recent signups leave faster than older ones.
Efficiency: payback and the Rule of 40
Growth that costs more than it returns is not healthy growth. Two metrics test it:
CAC payback answers how long a customer takes to repay what it cost to win them. The sample's 3.75 months compares with Bessemer's targets of under 12 months for companies selling to small businesses, under 18 for mid-market and under 24 for enterprise. David Skok describes profitability as anemic when recovering CAC takes more than 12 months. Both are guidelines; gross margin and churn change what is acceptable, as the churn benchmarks guide shows.
Rule of 40 adds annual revenue growth and profit margin and looks for 40 or more. Bessemer reports that in late 2023 the BVP Cloud Index averaged about 31% and the top decile of public cloud companies about 48%. The profit margin used varies between sources, such as free cash flow margin or EBITDA margin, so state which one you use and keep it the same when comparing periods.
Which growth metrics to track at your stage
Ten numbers are too many for a weekly review. Pick by what you do not yet know:
| Stage | Question you cannot yet answer | Track first |
|---|---|---|
| Before steady revenue | Do new people get value and come back? | Activation rate, retention of early cohorts |
| First paying customers | Does revenue grow and stick? | MRR growth, logo churn, signup-to-paid rate |
| Repeatable acquisition | Can we afford more growth? | CAC payback, GRR, NRR |
| Scaling | Is growth balanced with profit? | Rule of 40, NRR by segment |
Decision rule: if the earliest metric that has not been answered is weak, do not move to the next row. Fixing a 70% activation drop-off is worth more than adding spend to a leaky funnel.
| Stage | Question you cannot yet answer | Track first |
|---|---|---|
| Before steady revenue | Do new people get value and come back? | Activation rate, retention of early cohorts |
| First paying customers | Does revenue grow and stick? | MRR growth, logo churn, signup-to-paid rate |
| Repeatable acquisition | Can we afford more growth? | CAC payback, GRR, NRR |
| Scaling | Is growth balanced with profit? | Rule of 40, NRR by segment |
If the earliest unanswered metric is weak, fix it before moving down a row.
In TapCub: which of the ten you can read directly
Take the sample's weakest step: only 30% of signups activate. TapCub measures the behaviour side of growth and does not read your billing, so MRR, NRR and GRR still come from your subscription system.
- See the funnel. Open All-platform analytics › Business › AARRR growth to see acquisition, activation, retention, revenue and referral side by side. Set the activation event under the AARRR tab of business settings (for example, "finished onboarding"); the default is empty, and the page lists unmapped stages.
- Find where visitors come from. Web analytics › Sources splits visitors, sessions and conversions by channel, referrer and UTM, which gives the visitor-to-signup rate per source.
- Compare spend to results. In All-platform analytics › Business › Channel ROI, import spend by day, channel, source or campaign. The page computes cost per click (spend ÷ sessions) and cost per acquisition (spend ÷ purchases in orders). That is the order-based version of CAC; for subscription CAC divide your spend by new paying customers from billing, as in the example.
- Check retention. All-platform analytics › Behavior › Behavior analysis shows retention for a group by period, and the AARRR page shows day-7 retention of new users.
TapCub does not compute MRR, NRR or the Rule of 40, and it does not forecast growth; it shows whether people arrive, activate and come back.
FAQ
What are growth metrics?
Growth metrics are numbers that show whether a business is getting bigger and whether the growth is repeatable. Useful sets cover adding (revenue growth, signups), converting (activation, paid rate), keeping (churn, retention) and affordability (CAC payback, Rule of 40). The ten above are calculated from one sample month.
What are the most important growth metrics?
It depends on stage. Early on, activation and retention of new cohorts; with paying customers, MRR growth, churn and signup-to-paid rate; once acquisition repeats, CAC payback and net revenue retention. Track the earliest unanswered question first.
How do you calculate growth rate?
Growth rate = (ending value − starting value) ÷ starting value. In the sample, (23,400 − 20,000) ÷ 20,000 = 17.0% for one month. To compare across periods, convert: 17% a month is about 3.7% a week.
What is a good monthly growth rate?
There is no single figure. Paul Graham describes 5–7% a week as good for a startup in Y Combinator, which compounds to roughly 12.6 times a year. Slower rates can be healthy for larger businesses, so compare with your own stage and past months.
What is the difference between GRR and NRR?
Gross revenue retention counts only losses (cancellations and downgrades) and cannot exceed 100%. Net revenue retention also includes upsells, cross-sells and price increases and can be above 100%. In the sample month, GRR is 99.0% and NRR 102.0%.
Sources
- Paul Graham. Startup = growth: 5–7% a week as a good growth rate and the compounding figures. Checked 2026-11-20.
- SaaS Capital. SaaS retention benchmarks for private B2B companies: definitions of NRR and GRR. Checked 2026-11-20.
- Bessemer Venture Partners. Scaling to $100 million: net retention medians and CAC payback targets. Checked 2026-11-20.
- Bessemer Venture Partners. The Rule of X: Rule of 40 definition and late-2023 BVP Cloud Index averages. Checked 2026-11-20.
- David Skok. SaaS metrics 2.0: CAC recovery within 12 months as a guideline. Checked 2026-11-20.
Was this article helpful?
We use your answers to fix and expand this page.
Couldn’t send. Please try again in a minute.
Thanks for the feedback. We’ll use it to improve this page.You’ve already sent feedback on this page. Thanks.

Product Analyst
Focuses on event analysis, conversion funnels, and retention, using clear metric definitions and structured analysis to explain product performance.