Try it on your own data
Every report in this article is in the free plan. One snippet for web and apps, up to 10 sites.
Start freeRevenue growth rate is one number, but it is the sum of several movements: new customers, expansion, downgrades and churn. This guide gives the formula and its variants, shows when to use compound rates, sets out common benchmarks, and walks through a quarter where sales grew and the growth rate still fell.
What you will learn
- Growth rate = (this period − last period) ÷ last period × 100
- Use YoY for seasonal businesses and CAGR for multi-year averages
- T2D3 and the Rule of 40 are common SaaS benchmarks
- Break growth into new, expansion, contraction and churn
- Show absolute numbers next to every growth rate
What is revenue growth rate?
Revenue growth rate is the percentage change in a company's revenue from one period to the next. It answers the simplest question investors, boards and teams ask: how much faster is the business selling than before? It is usually reported month over month (MoM), quarter over quarter (QoQ) or year over year (YoY).
Revenue growth rate formula
Revenue growth rate = (revenue this period − revenue last period) ÷ revenue last period × 100
Example: revenue was $1.8 million last year and $2.6 million this year.
(2.6 − 1.8) ÷ 1.8 × 100 = 44.4% year-over-year growth.
| Variant | Compares | Use when |
|---|---|---|
| Month over month (MoM) | This month vs last month | Early-stage companies, short feedback loops |
| Quarter over quarter (QoQ) | This quarter vs last quarter | Smoothing monthly noise |
| Year over year (YoY) | This period vs the same period last year | Seasonal businesses, annual planning |
| CAGR | Average annual growth over several years | Comparing multi-year performance |
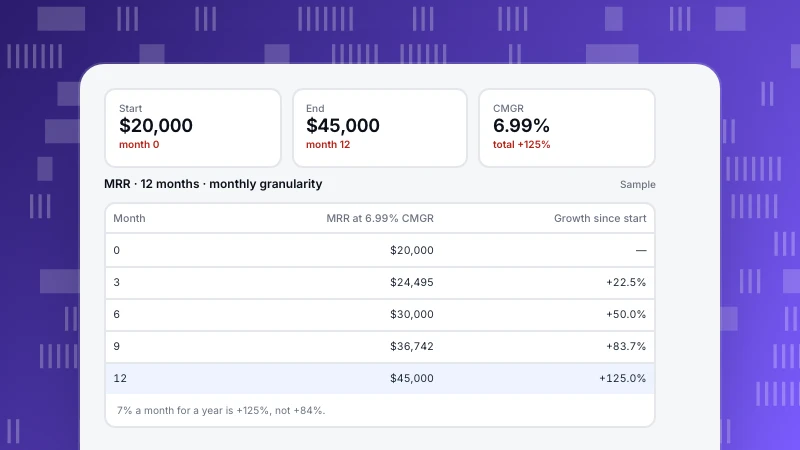
| CMGR | Average monthly growth over several months | Early-stage growth over 6–12 months |
| Variant | Use when |
|---|---|
| MoM | Early stage, fast feedback |
| QoQ | Smoothing monthly noise |
| YoY | Seasonal businesses |
| CAGR | Multi-year comparison |
| CMGR | 6–12 months of early growth |
Formula: (current − prior) ÷ prior × 100.
Compound growth: CAGR and CMGR
Averaging yearly growth rates overstates performance when growth varies. Use the compound rate instead:
CAGR = (ending revenue ÷ starting revenue)^(1 ÷ number of years) − 1
Revenue went from $1.0 million to $2.6 million over three years: 2.6^(1/3) − 1 = 37.5% a year. The simple average of the three yearly rates may look higher if one year was exceptional; CAGR is the constant rate that gets you from start to end. The monthly version, CMGR, is covered in Compound monthly growth rate.
What is a good revenue growth rate?
It depends on stage, size and model:
- Early-stage SaaS: investors often refer to "T2D3", a path popularized by Battery Ventures' Neeraj Agrawal: triple revenue in each of two years after reaching about $1–2 million ARR, then double it three years in a row.
- Growth-stage SaaS: the Rule of 40 (growth rate + profit margin ≥ 40%) balances growth against profitability; a company growing 30% with a 10% margin meets it.
- Mature companies: growth above inflation and above the market is usually the bar.
Benchmarks only make sense against the right base: 100% growth from $100,000 is a different achievement from 100% growth from $50 million.
Worked example: why growth slowed when sales grew
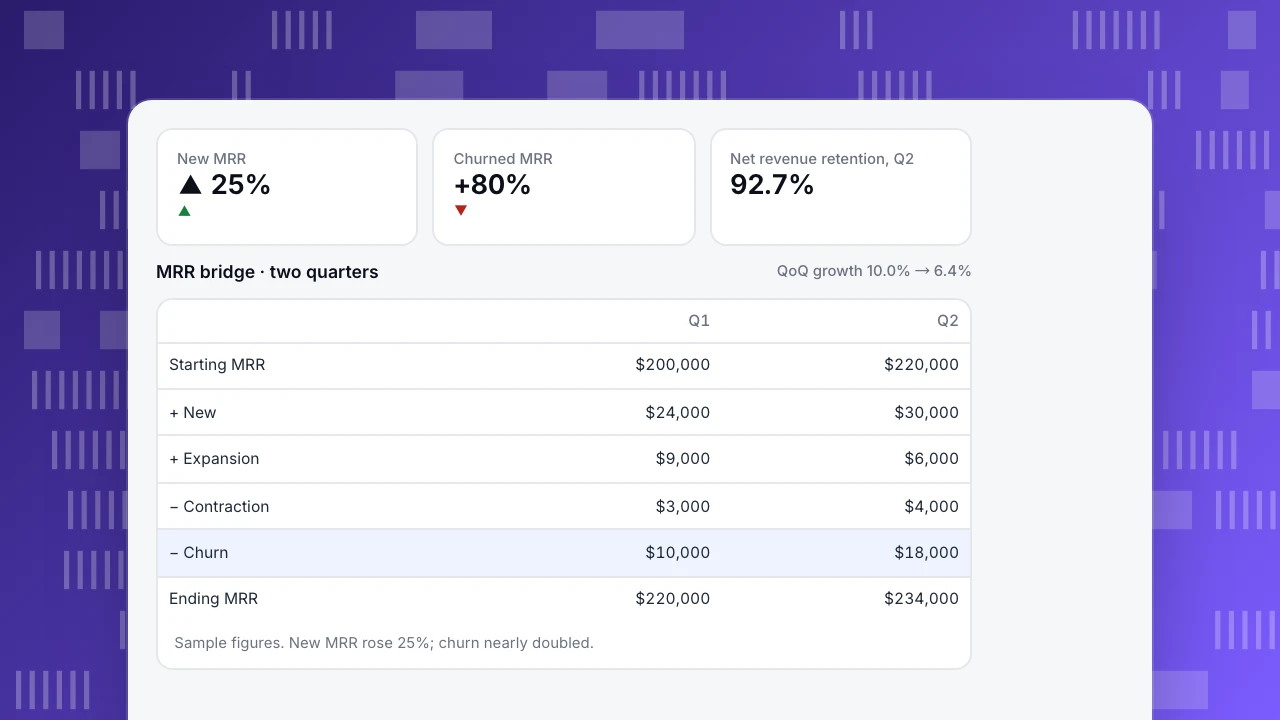
A SaaS company tracks monthly recurring revenue (MRR) every quarter and breaks the change into its parts, a so-called MRR bridge (sample figures):
| Q1 | Q2 | |
|---|---|---|
| Starting MRR | $200,000 | $220,000 |
| + New MRR | $24,000 | $30,000 |
| + Expansion MRR | $9,000 | $6,000 |
| − Contraction MRR | $3,000 | $4,000 |
| − Churned MRR | $10,000 | $18,000 |
| Ending MRR | $220,000 | $234,000 |
| Revenue growth (QoQ) | 10.0% | 6.4% |
New business grew 25% from Q1 to Q2, yet the growth rate fell from 10.0% to 6.4%. The bridge shows why: churned MRR nearly doubled and expansion fell by a third. A single growth rate would have sent the team looking at sales; the components pointed at retention, where a pricing change in Q2 had pushed a group of mid-size customers to cancel.
Two practical rules come from this:
- Report growth with its components. New, expansion, contraction and churn explain the number.
- Watch net revenue retention. In Q2, existing customers' revenue fell: (220,000 + 6,000 − 4,000 − 18,000) ÷ 220,000 = 92.7% for the quarter.
New MRR
▲ 25%
▲
Churned MRR
+80%
▼
Net revenue retention, Q2
92.7%
MRR bridge · two quarters
QoQ growth 10.0% → 6.4%| Q1 | Q2 | |
|---|---|---|
| Starting MRR | $200,000 | $220,000 |
| + New | $24,000 | $30,000 |
| + Expansion | $9,000 | $6,000 |
| − Contraction | $3,000 | $4,000 |
| − Churn | $10,000 | $18,000 |
| Ending MRR | $220,000 | $234,000 |
Sample figures. New MRR rose 25%; churn nearly doubled.
Common mistakes
- Mixing bookings, billings and revenue. An annual contract booked in January is not twelve months of revenue in January.
- Comparing seasonal months. December vs November is not meaningful for a retailer; use YoY.
- Ignoring one-off revenue. A large setup fee or a one-time deal inflates a single period.
- Averaging growth rates. Use CAGR or CMGR for multi-period averages.
- Reporting only percentages. Always show the absolute numbers next to the rate.
Tracking revenue growth in TapCub
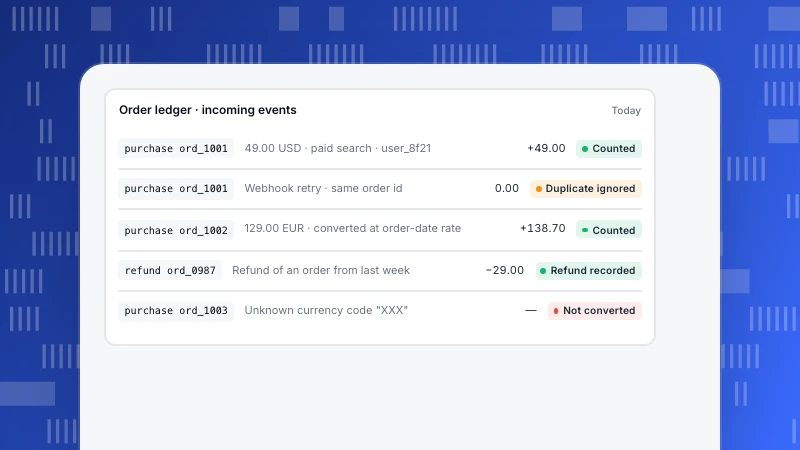
Send purchase or subscription events with amounts, such as purchase or subscription_started with mrr, so revenue lands in the order ledger (Track ecommerce purchases). All-platform analytics › Business › AARRR growth shows revenue next to acquisition, activation and retention, and the B2B / SaaS industry pack adds new MRR, expansion MRR, churned MRR and subscription churn metrics. Compare periods with the date comparison in any report (Compare date ranges). Related reading: Revenue tracking, SaaS metrics and the Rule of 40.
See also: Exponential growth.
Sources
- Neeraj Agrawal, The SaaS Travel Adventure (TechCrunch, 2015): the T2D3 growth path.
Was this article helpful?
We use your answers to fix and expand this page.
Couldn’t send. Please try again in a minute.
Thanks for the feedback. We’ll use it to improve this page.You’ve already sent feedback on this page. Thanks.

Data Engineer
Writes about event design, data quality, and collection workflows, with verifiable implementation methods for reliable analytics.