Try it on your own data
Every report in this article is in the free plan. One snippet for web and apps, up to 10 sites.
Start freeMarketing analytics measures how people find and choose you; product analytics measures what they do after sign-up. This guide compares them side by side, shows where they overlap, and works through a quarter where the channel with twice the sign-ups delivered half as many customers still paying after six months.
What you will learn
- Marketing analytics: channels, campaigns, costs
- Product analytics: activation, engagement, retention
- Join them on one user identity
- Judge channels by retained customers, not sign-ups
- Adapt onboarding to the acquisition source
Product analytics vs marketing analytics: the short answer
Marketing analytics measures how people find and choose you: channels, campaigns, ad spend, traffic, leads and the cost of acquiring customers. Product analytics measures what people do after they sign up or install: activation, feature use, engagement, retention and expansion. Marketing analytics answers "which efforts bring the right people?"; product analytics answers "do those people get value and stay?".
The line between them is the sign-up or first purchase, but the two are most useful when joined: the best channel is the one whose users activate and retain, not the one with the cheapest clicks.
Side-by-side comparison
| Marketing analytics | Product analytics | |
|---|---|---|
| Main question | Where do customers come from and what does it cost? | What do users do, and do they get value? |
| Primary users | Marketers, growth, demand generation | Product managers, designers, engineers, customer success |
| Unit of analysis | Sessions, visitors, leads, campaigns | Users, accounts, events, cohorts |
| Typical data | Traffic sources, UTM tags, ad spend, form fills, attribution | In-app events, feature use, retention, subscriptions |
| Key metrics | CAC, ROAS, conversion rate by channel, cost per lead | Activation, DAU/MAU, feature adoption, retention, NRR |
| Typical analyses | Channel and campaign reports, attribution models, landing page performance | Funnels, cohorts, paths, segmentation, feature adoption |
| Time horizon | Days to weeks (campaign cycles) | Weeks to months (habit and retention) |
| Identity | Often anonymous visitors | Usually identified users and accounts |
| Question | Needs |
|---|---|
| Which channel brings retained users? | Both, joined on identity |
| Which campaign has the lowest CAC? | Marketing analytics |
| Which feature predicts retention? | Product analytics |
| What is each campaign’s payback? | Both, plus revenue |
The most valuable questions need both sides.
Where they overlap
- The conversion funnel. Landing page → sign-up → activation crosses both teams.
- Onboarding emails and in-app messages. Marketing channels that drive product behavior.
- Pricing pages and upgrades. Marketing traffic, product decisions.
- Lifetime value. CAC (marketing) only makes sense next to retention and revenue (product).
Why joining them matters
Judging channels by sign-ups alone rewards cheap traffic that never activates. Judging product changes without knowing where users came from hides the fact that different channels bring users with different needs. Joining the two on one identity lets you answer:
- Which channel brings users who activate and are still active after 90 days?
- What is the payback period of each campaign once churn is included?
- Do users from comparison pages adopt different features from users from tutorials?
Worked example: the cheapest channel was the most expensive
A SaaS company (sample data) compares two acquisition channels over one quarter:
| Metric | Paid social | Organic search |
|---|---|---|
| Sign-ups | 2,000 | 900 |
| Cost per sign-up | €12 | €0 (content cost not allocated) |
| Activation rate | 22% | 51% |
| Paid after 30 days | 3% (60) | 9% (81) |
| Still paying after 6 months | 55% (33) | 80% (65) |
| Spend | €24,000 | — |
| Cost per retained customer | €727 | — |
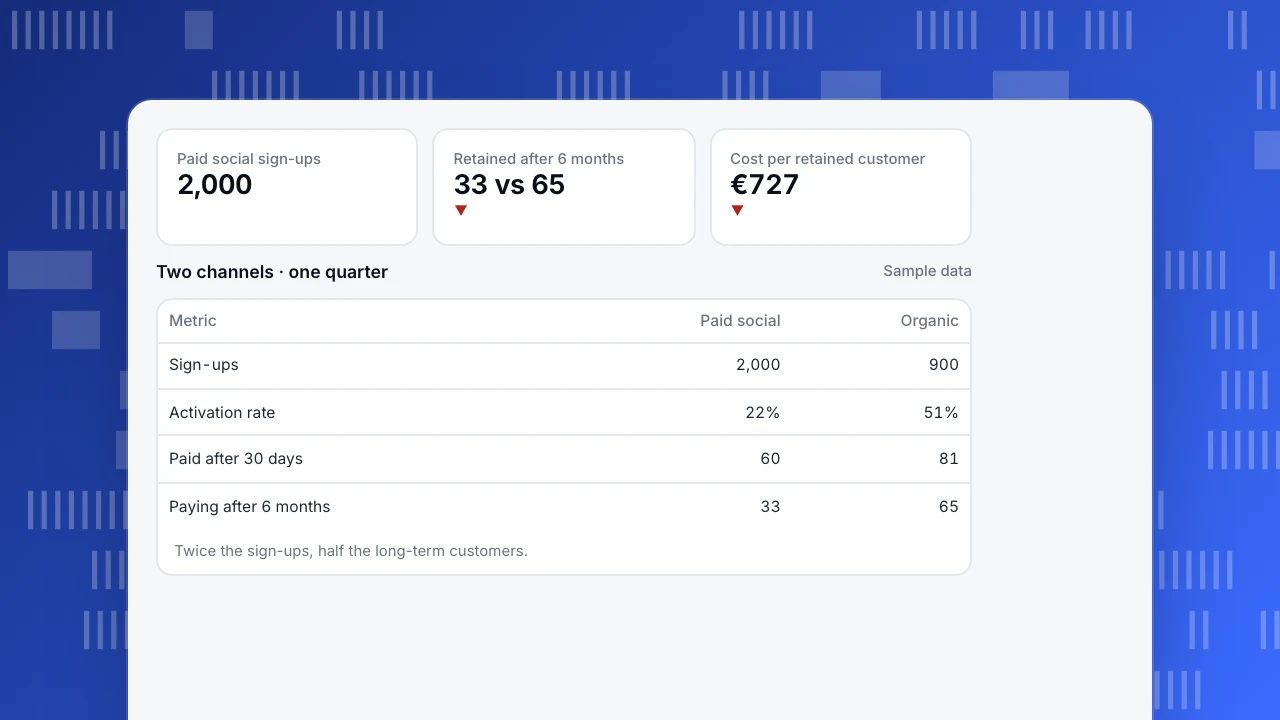
Marketing analytics alone said paid social was the growth engine: twice the sign-ups. Product analytics on the same users showed organic search delivered twice as many customers still paying after six months. The team kept paid social, but changed its landing page and onboarding for that audience, and invested more in content.
Paid social sign-ups
2,000
Retained after 6 months
33 vs 65
▼
Cost per retained customer
€727
▼
Two channels · one quarter
Sample data| Metric | Paid social | Organic |
|---|---|---|
| Sign-ups | 2,000 | 900 |
| Activation rate | 22% | 51% |
| Paid after 30 days | 60 | 81 |
| Paying after 6 months | 33 | 65 |
Twice the sign-ups, half the long-term customers.
Common mistakes
- Separate tools with separate IDs. Without a shared identity, you cannot connect a campaign to retention.
- Optimizing campaigns for sign-ups. Optimize for activated or retained users where possible.
- Product teams ignoring acquisition source. Users from different channels often need different onboarding.
- Attributing all revenue to the last click. Content that starts journeys gets undervalued.
Doing both in TapCub
TapCub runs web analytics and product analytics on the same visitor and user identity:
- Marketing side: sources, UTM campaigns, ad click IDs, landing pages and attribution models (first, last, linear, position, time decay); see name UTM parameters.
- Product side: funnels, retention, lifecycle, paths, feature adoption and user segments.
- The join: identify users at sign-up so pre-sign-up visits, campaigns and in-product behavior belong to one person; groups for B2B accounts.
Related: marketing KPIs, product usage analytics, marketing campaign analysis, CAC.
FAQ
What is the difference between product analytics and marketing analytics? Marketing analytics measures acquisition (channels, campaigns, costs); product analytics measures behavior after sign-up (activation, engagement, retention).
Do I need separate tools? Not necessarily. A tool that covers both on one identity makes it easier to connect campaigns to retention and revenue.
Who owns the conversion from visitor to activated user? Usually shared: marketing owns traffic to sign-up, product owns sign-up to activation. Agree on one funnel definition.
Which is more important for a startup? Early on, product analytics, because retention determines whether acquisition spend can ever pay back.
Sources
- Skok, D. SaaS metrics 2.0. For Entrepreneurs.
- Google Analytics Help. About campaigns and traffic sources (UTM parameters).
Was this article helpful?
We use your answers to fix and expand this page.
Couldn’t send. Please try again in a minute.
Thanks for the feedback. We’ll use it to improve this page.You’ve already sent feedback on this page. Thanks.

Product Experience Specialist
Explores usability, user journeys, and feature adoption through practical examples of onboarding and everyday product use.