Analytics
How metrics are defined, where numbers disagree, and how to read a funnel or a retention curve without fooling yourself.
This category covers the mechanics of measurement: what a visitor is, why sessions differ between tools, how to build a funnel that survives scrutiny, and how to spot bot traffic before it skews a decision. Every article uses the same sample dataset you see in the product, so you can reproduce the reasoning in your own workspace.
Articles in Analytics
304 articles · page 1 of 7
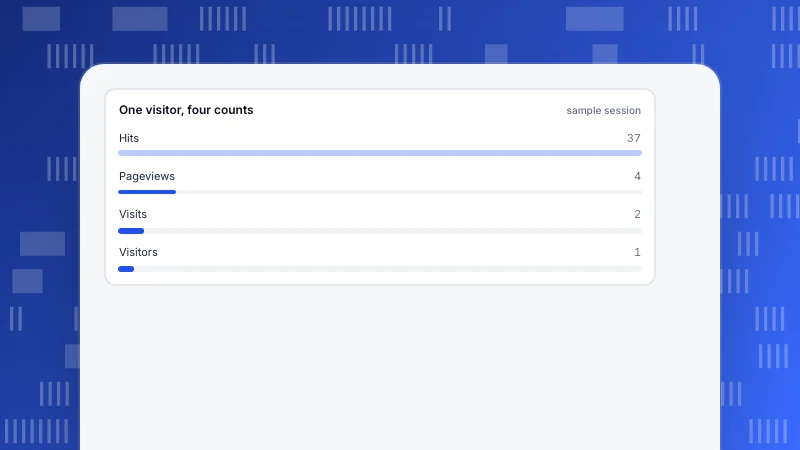
Website visits vs pageviews vs hits: what each number counts
Site views can mean hits, pageviews, visits or visitors, and the same traffic can be 37, 4, 2 or 1. One counted session shows where each number comes from and which one to report.
Read more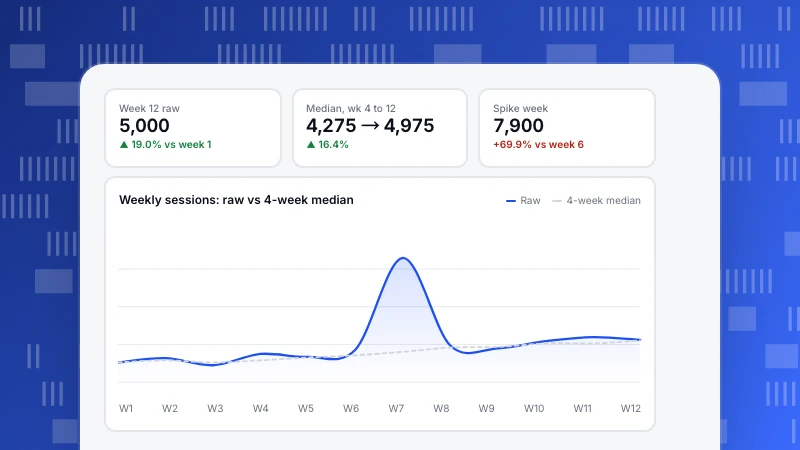
Website Traffic Over Time: Separate Trend, Season and Spike
A traffic chart mixes three things: a trend, a season and one-off spikes. Use weekly buckets, a rolling median and year-on-year comparison to tell them apart before you react.
Read more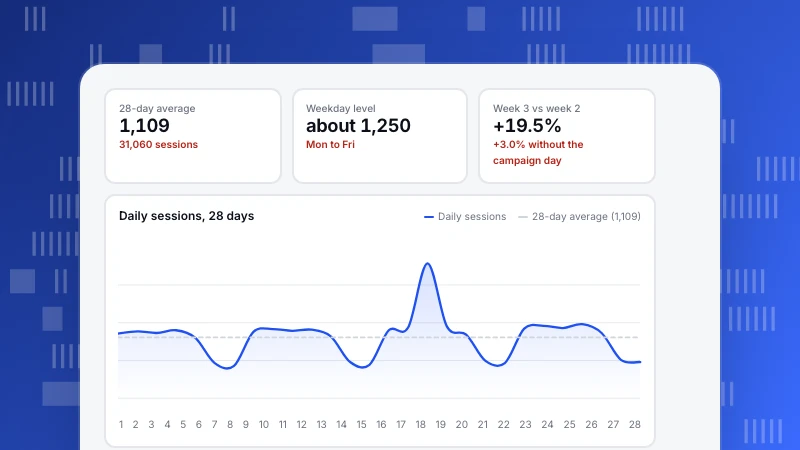
Website traffic graphs: which chart fits which question, and the traps to avoid
Line, bar or area? Match the chart to the question using one 28-day traffic dataset, see which number each chart distorts, and learn the traps: truncated axes, stacked areas, partial periods and dual axes.
Read more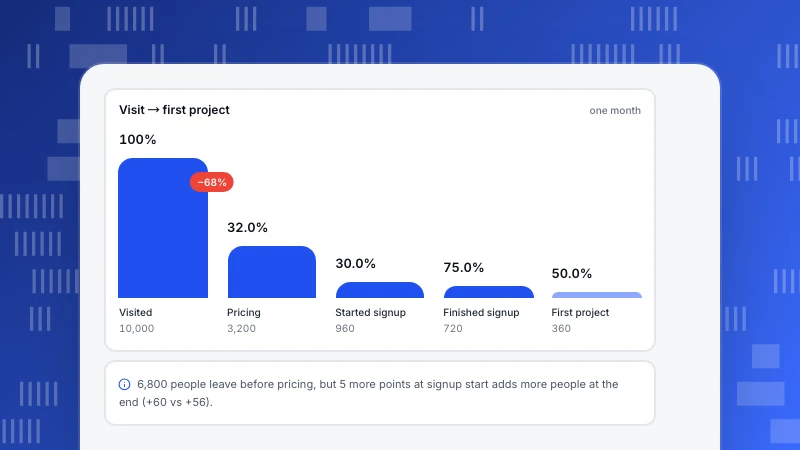
Website funnel analysis: calculate drop-off and pick the step to fix
How to run website funnel analysis: choose steps, calculate step rates and drop-off with a worked example, rank fixes by people gained and check sample size.
Read more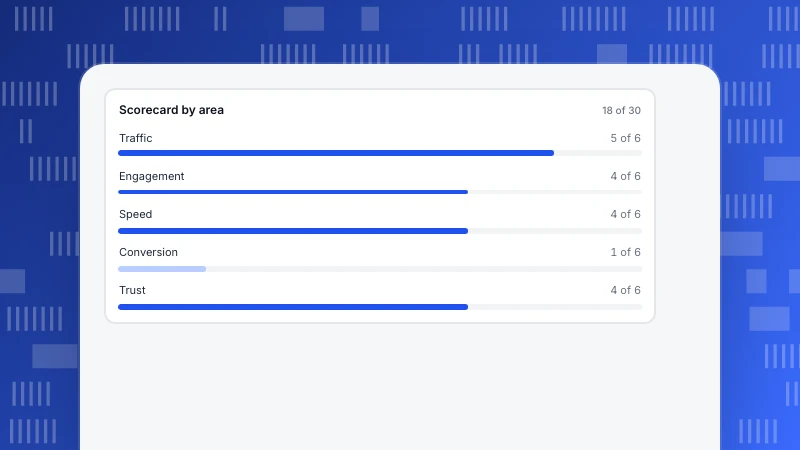
Website Evaluation: A Data-Driven Scorecard for Traffic, Engagement, Speed and Conversion
Evaluate a website with a 15-metric, 30-point scorecard across traffic, engagement, speed, conversion and trust, using Core Web Vitals and WCAG thresholds where they exist and your own 90-day median elsewhere.
Read more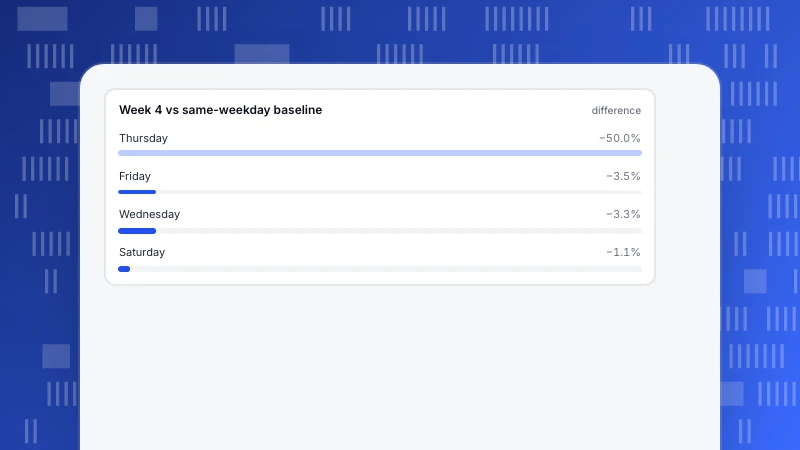
Web Traffic Monitoring: Baselines and Alert Thresholds That Work
Web traffic monitoring compares visits with a same-weekday baseline and alerts only when the drop is both statistically unusual and large enough to matter. Worked week, threshold rules and a TapCub setup.
Read more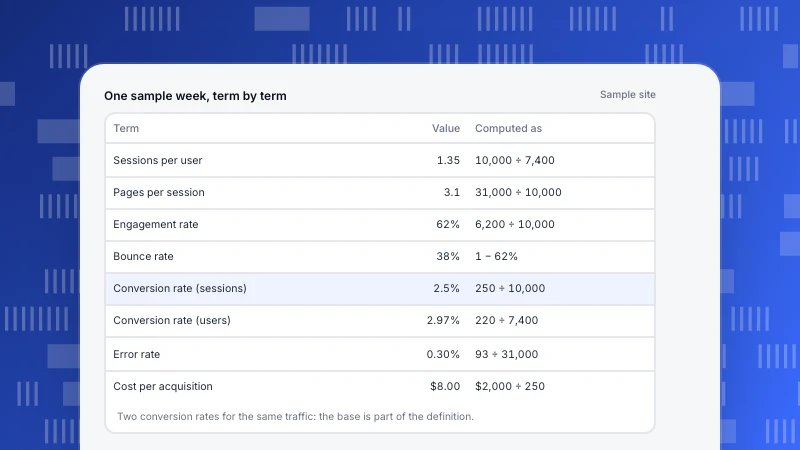
Web Analytics Terms: A Grouped Glossary With Formulas and One Worked Week
Web analytics terms grouped by the question they answer: traffic, engagement, conversion, performance and data. Each term has a plain definition, a formula and the choice to check, computed from one sample week.
Read more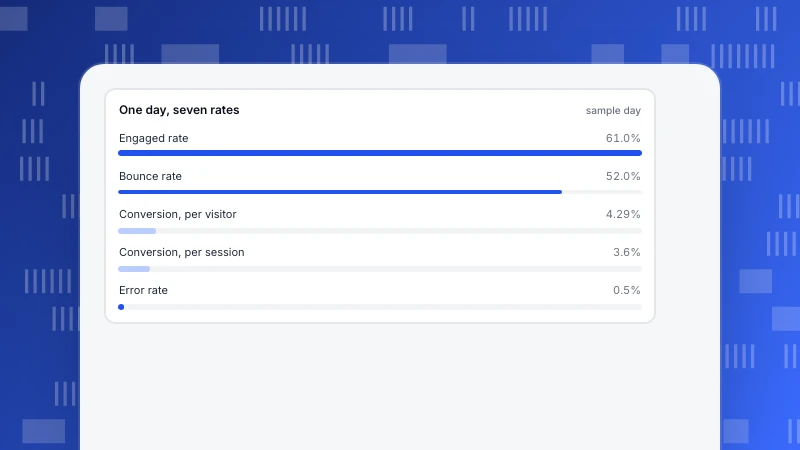
Web analytics terminology: 42 terms by what they count
A grouped cheat sheet of web analytics terms: traffic, behavior, conversion and data. Each term shows what is counted and, for rates, what it is divided by, with one day of numbers that recomputes them all.
Read more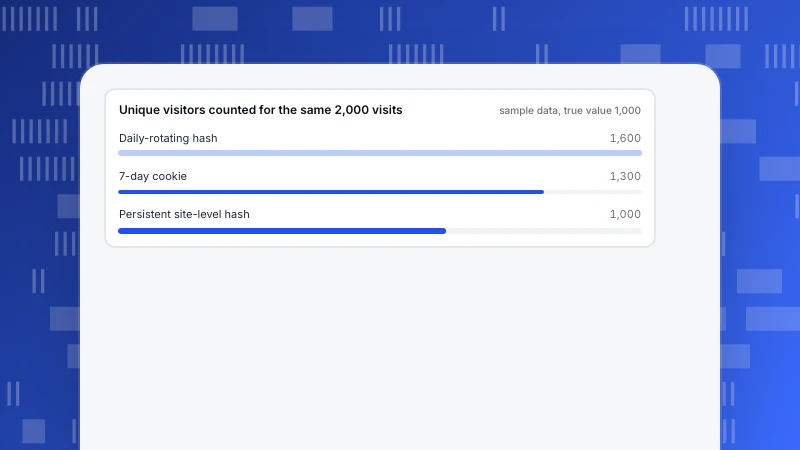
How to track web traffic without cookies: methods and accuracy
Six ways to track web traffic without cookies, what each costs in accuracy with a worked example, and when consent is still needed.
Read more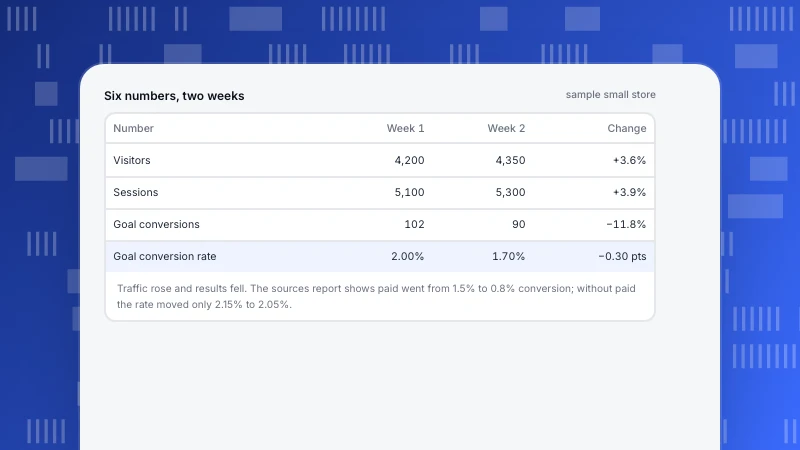
Simple Web Analytics: The Six Numbers to Read Each Week
Simple web analytics is six numbers, one goal and a weekly habit. See which metrics to keep, a worked two-week report, and the rules for when to add funnels or segments.
Read more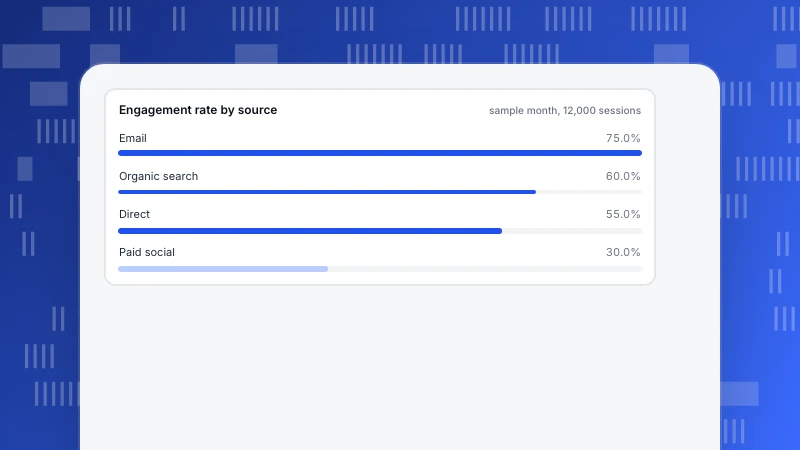
Session Analytics: Metrics, Distributions and Five Practical Uses
Session analytics treats each visit as a unit. The metrics built on sessions and how each is counted, why the average session duration misleads, a four-source worked example and five uses with the steps to run each.
Read more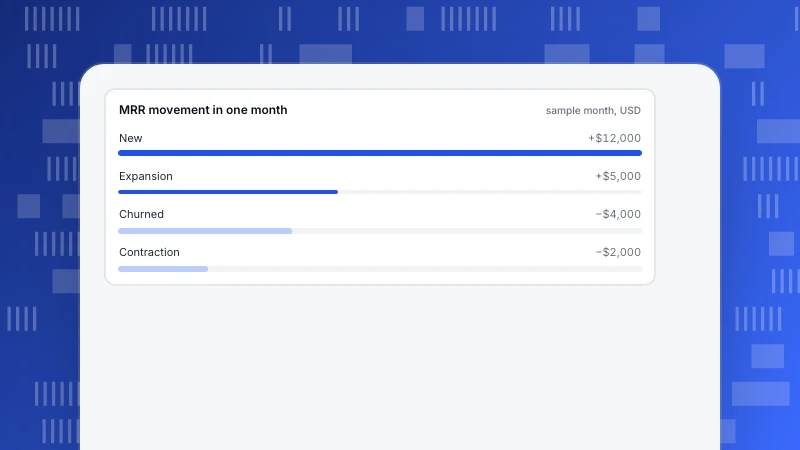
SaaS metrics dashboard: a layout by stage, with the numbers to show
A SaaS metrics dashboard should follow the customer path: acquire, activate, pay, stay. One sample company shows the MRR bridge, churn, GRR, NRR, CAC payback and where each number really lives.
Read more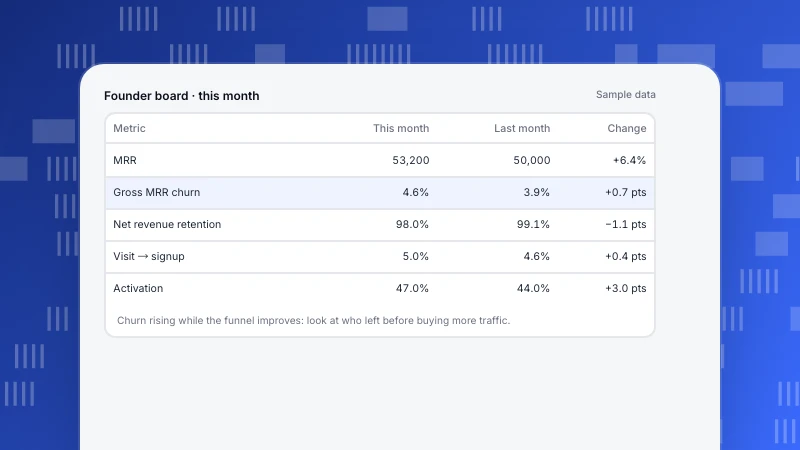
SaaS dashboard examples: layouts for founder, product and support
Three SaaS dashboard layouts with sample data: a founder board with an MRR bridge, a product board for activation and retention, and a support board.
Read more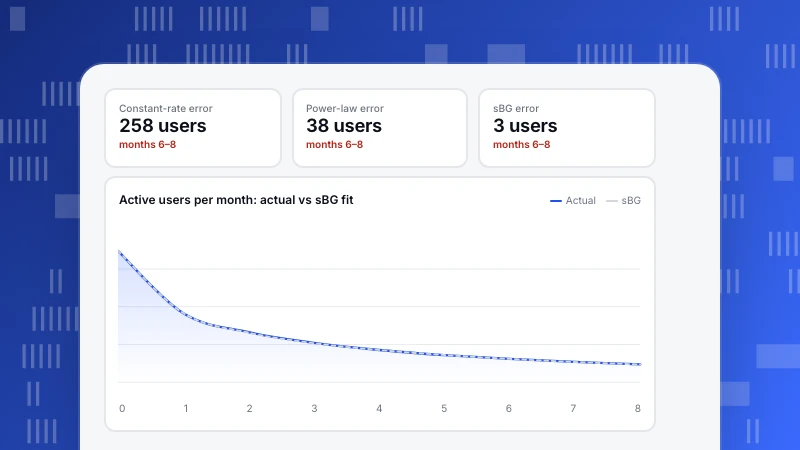
Retention modeling: fit a curve and project survivors
Fit three retention models to one cohort, test them on months they never saw and project how many users are still active at month 12 and 24, with the table and the method.
Read more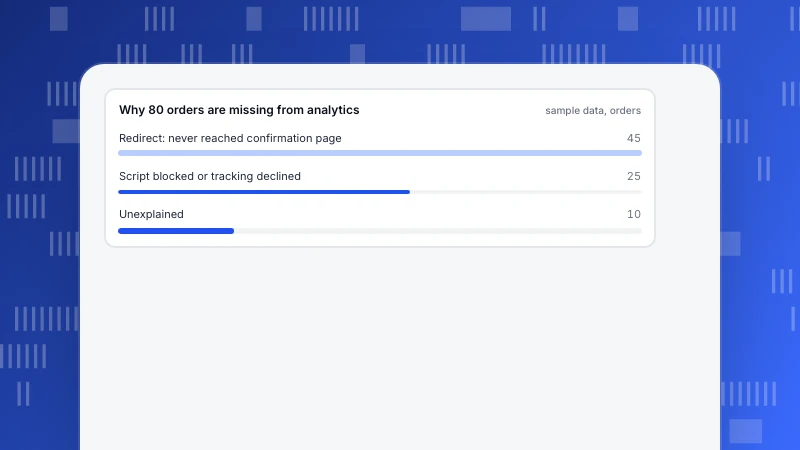
Reliable data: five tests to tell if your analytics can be trusted
How to tell if analytics data is reliable: reconcile with a second source, check sampling, audit tracking, spot double-firing and test timing, with worked numbers.
Read more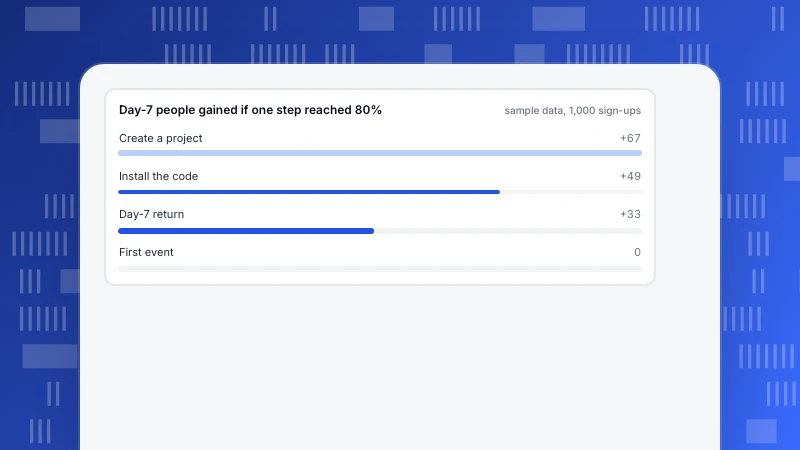
Product optimization: a data-driven loop from metric to change
Product optimization is a loop: pick a metric, find the biggest gap, write a hypothesis, make a small change and read the result. A worked onboarding funnel, test sizes and a feature adoption table.
Read more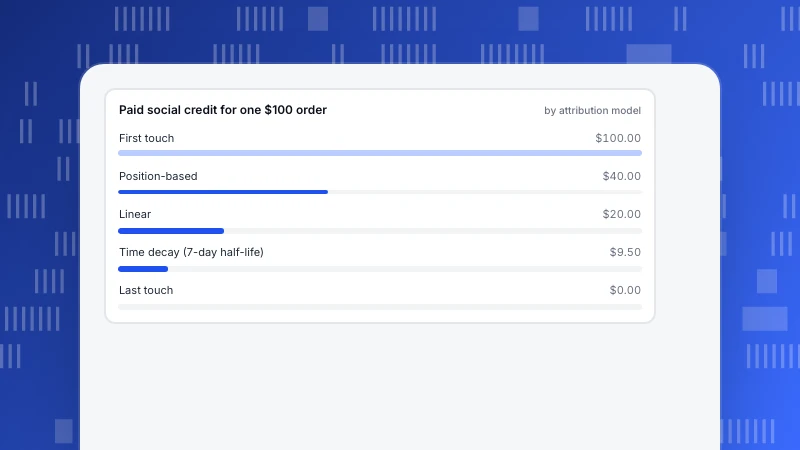
Multi-Touch Attribution Tools: Criteria, Limits and How to Choose
Choosing a multi-touch attribution tool is about criteria, not model theory. See one journey under five models, how the lookback window moves credit, eight questions to ask and a weighted scoring rubric.
Read more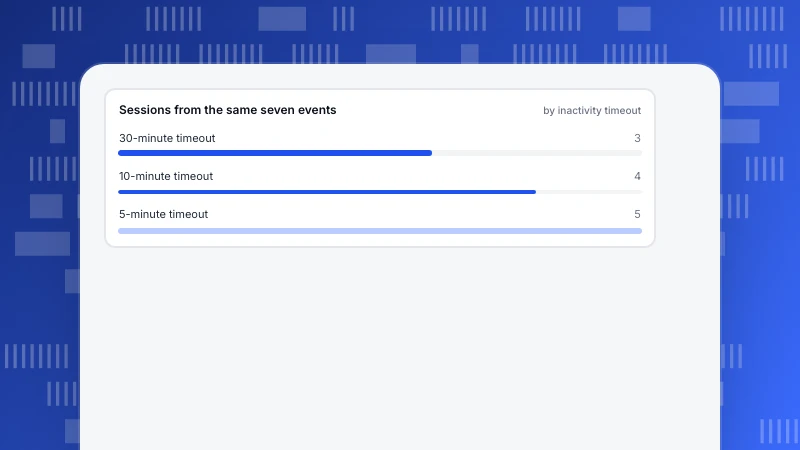
Mobile Web Analytics vs Mobile App Analytics: Identity, Sessions and Metrics
Mobile web analytics and mobile app analytics differ in how they identify people, define sessions, which metrics they have and how fast fixes ship. Side-by-side table, a session example you can recompute and a rule for when you need both.
Read more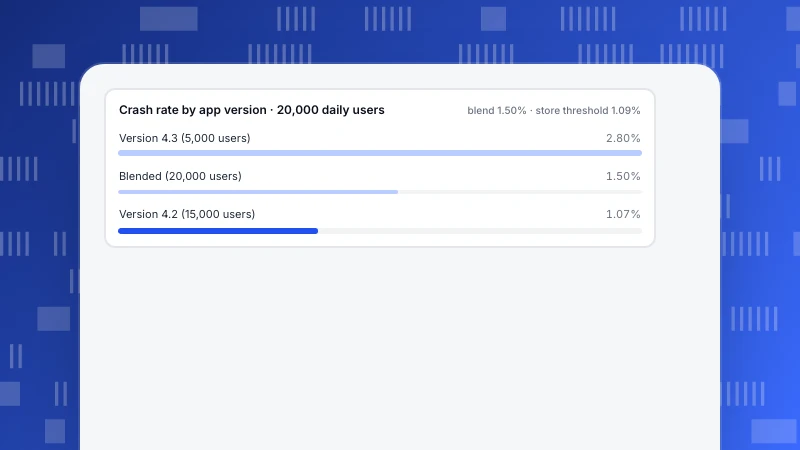
Mobile App Monitoring Tools: Five Categories and What Each One Sees
Mobile app monitoring tools fall into five categories, each seeing a different part of the app. See what each measures, how crash-free rate changes with the denominator, and what store thresholds say.
Read more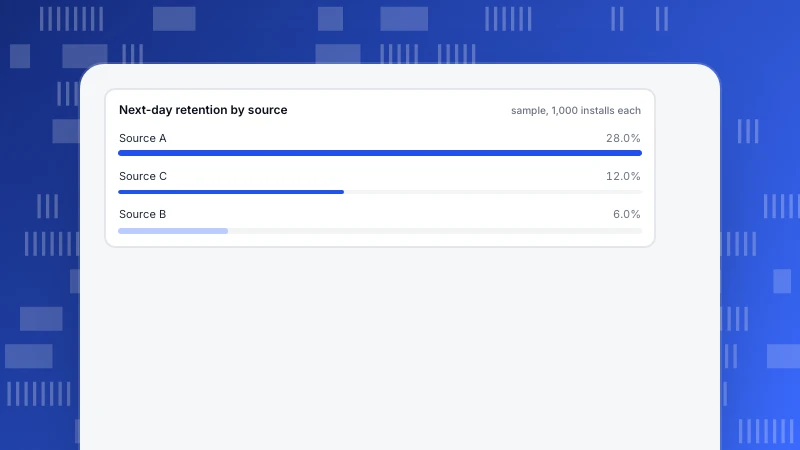
Mobile Ad Fraud: Types, Detection Signals and a Worked Example
Mobile ad fraud shows up as odd click-to-install timing, click volume with no installs and installs that never return. Types, five detection signals and a three-source example where the best-looking rate is the worst traffic.
Read more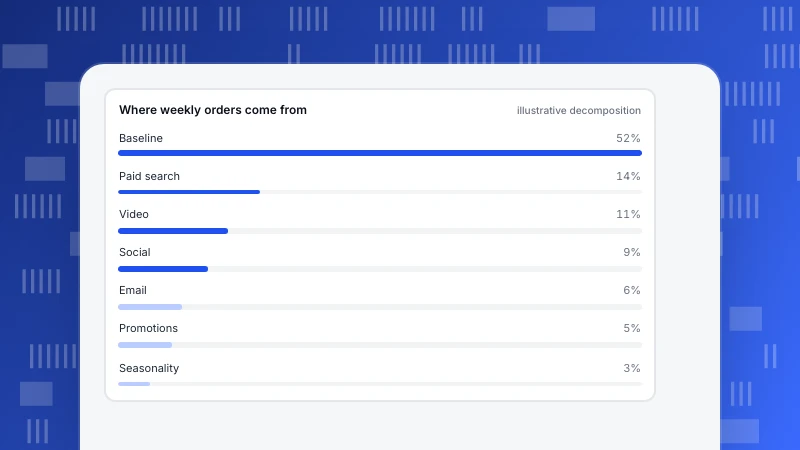
Marketing Mix Modelling: What It Needs and How It Differs From Attribution
Marketing mix modelling estimates each channel's contribution from aggregate weekly data. What data it needs, how adstock and saturation work with numbers, how to read the output and when it beats attribution.
Read more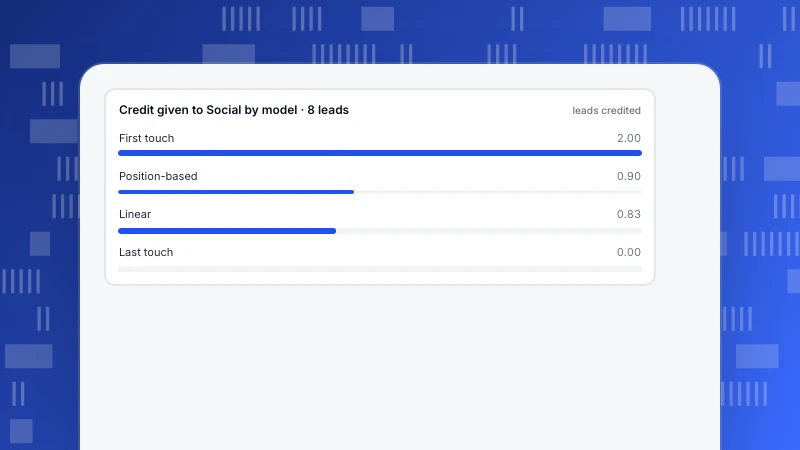
Lead attribution: how to credit the source of every lead
Lead source is one label; lead attribution looks at every visit before the form. Eight sample touch paths credited under first, last, linear and position rules, when to use each, and what breaks lead tracking.
Read more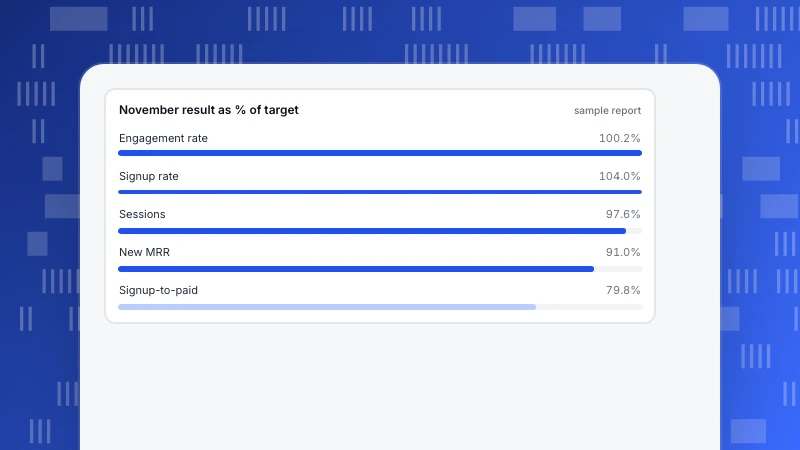
KPI Report Sample: A One-Page Template With Commentary You Can Copy
A KPI report sample with the six parts of a one-page layout, a filled November example, a three-sentence commentary pattern and a check for whether a change is real or noise.
Read more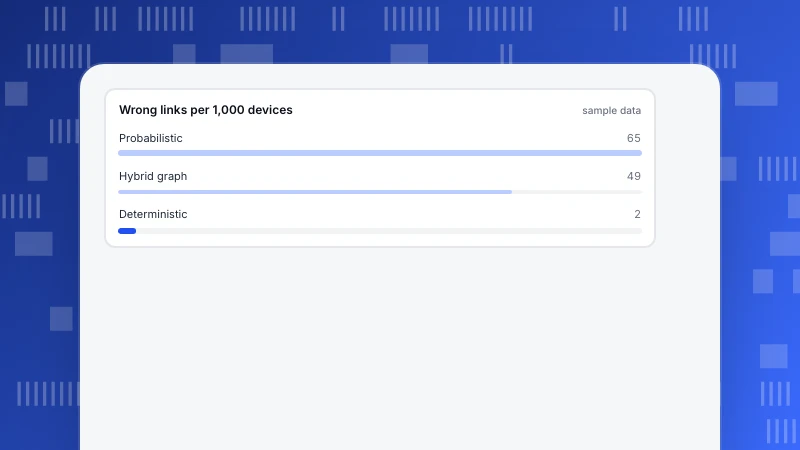
Identity resolution providers: deterministic, probabilistic and graph compared
Identity resolution providers differ by how they match, what data they match against and how wrong they may be. Three approaches, a holdout test with sample numbers, and seven questions to ask before you buy.
Read more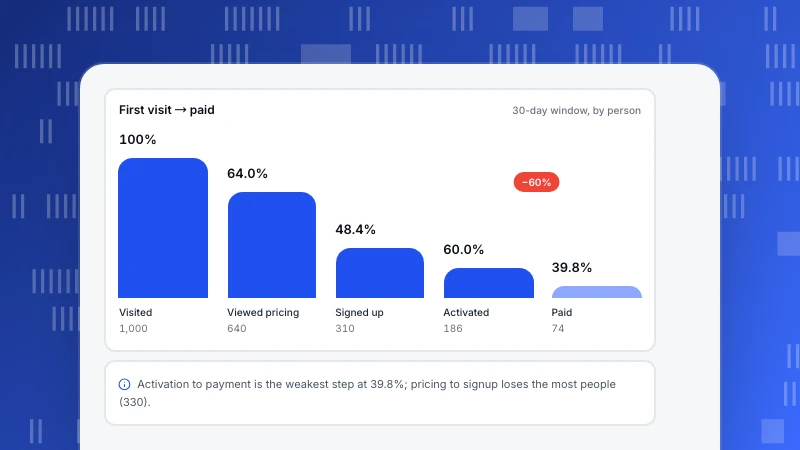
How to track the customer journey across sessions and devices
Five steps to track the customer journey: one proof event per stage, a user ID to recognise people across devices, consistent event names, a window from your own data and a funnel plus paths to read.
Read more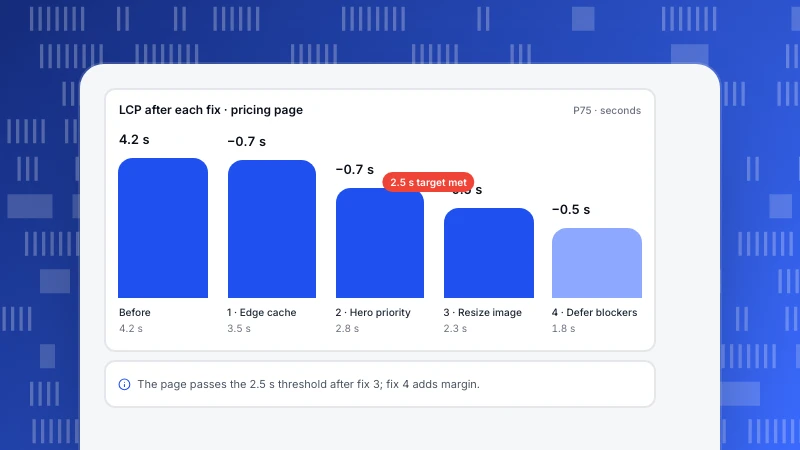
How to speed up a website: four fixes ranked by seconds saved
Split your slowest page's LCP into its four parts, rank fixes by seconds saved, and check the result against conversion. A worked 4.2 s to 1.8 s example, with Core Web Vitals targets and a verification checklist.
Read more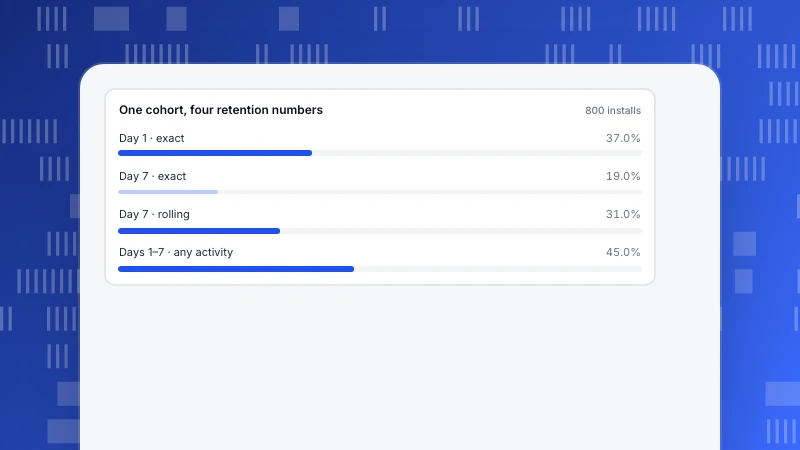
How to calculate retention rate: formulas, cohorts and a worked table
Two formulas hide behind "retention rate". How to calculate customer retention and cohort retention from raw counts, why exact-day, rolling and any-activity numbers differ on the same users, and which one to report.
Read more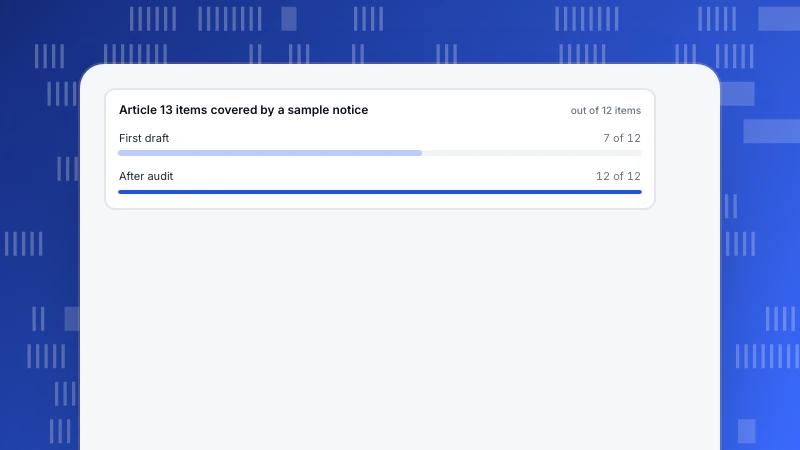
GDPR Privacy Notice: What to Include, With Analytics and Chat Wording
A GDPR privacy notice must cover up to 12 items from Articles 13 and 14. See each item with analytics and live-chat wording, a worked 12-item audit, timing rules and common gaps.
Read more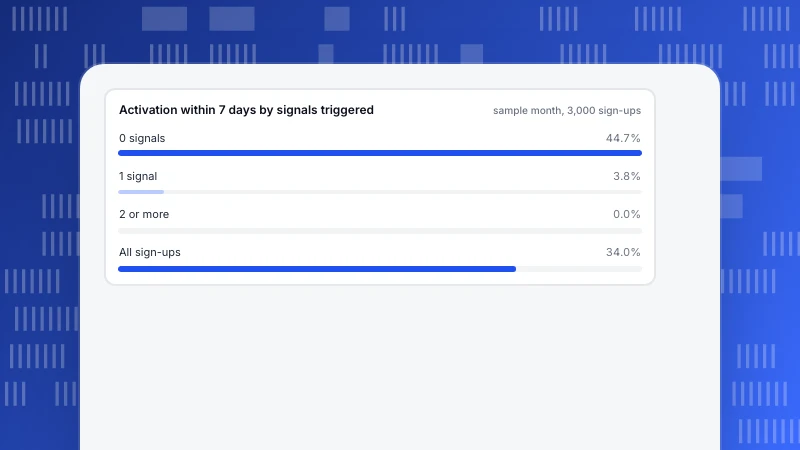
Fake account prevention: spot bot signups with behavioral signals
Fake signups are easier to spot by what they do after signing up than by what they type. Six behavioral signals, a three-tier score you can test on your own data, and how to keep from blocking real people.
Read more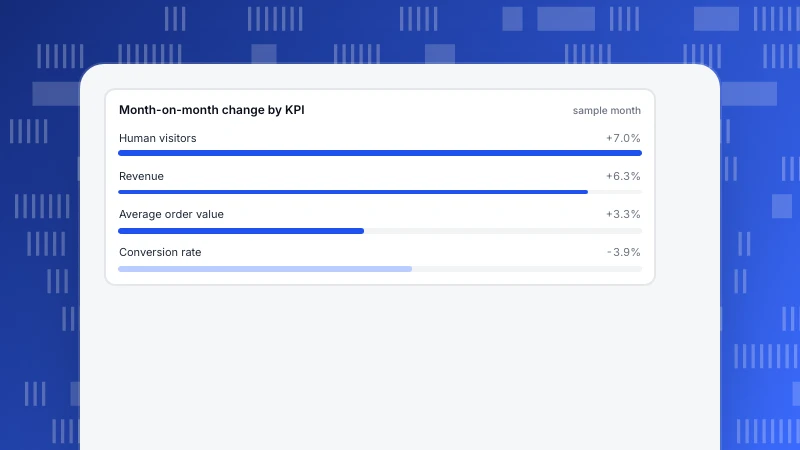
Executive Reporting: A One-Page Template With Five KPIs and a Narrative
Executive reporting that fits on one page: a headline, five KPIs with period comparisons, a checked cause, actions and one ask, with a worked sample report built from web analytics.
Read more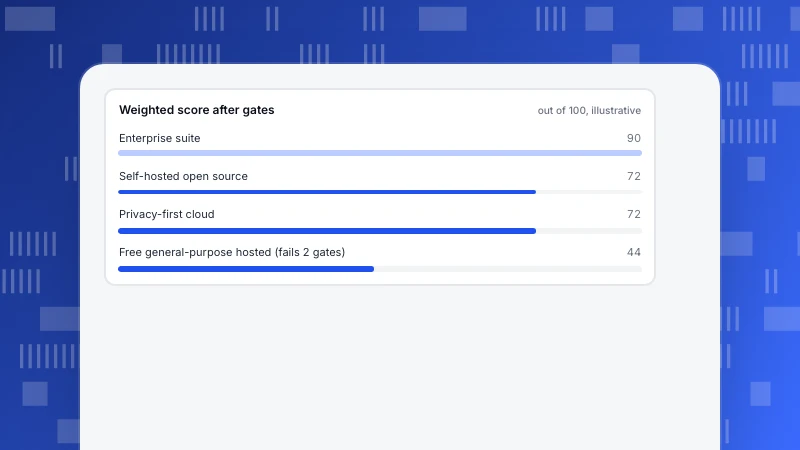
Enterprise web analytics: requirements, governance and how to score tools
Enterprise web analytics is about scale, governance, privacy and access control, not feature count. Size your volume, treat must-haves as gates, then score tool types and send nine written questions.
Read more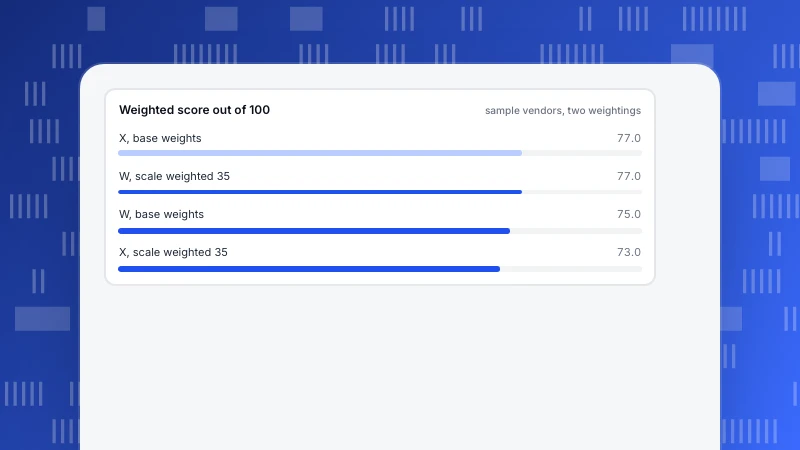
Enterprise Analytics Solutions: What to Require and How to Compare
Enterprise analytics solutions are judged on scale, governance and privacy. Turn each into numbers or pass-fail gates, score the survivors with weights you set first, and prove the winner in a four-week trial.
Read more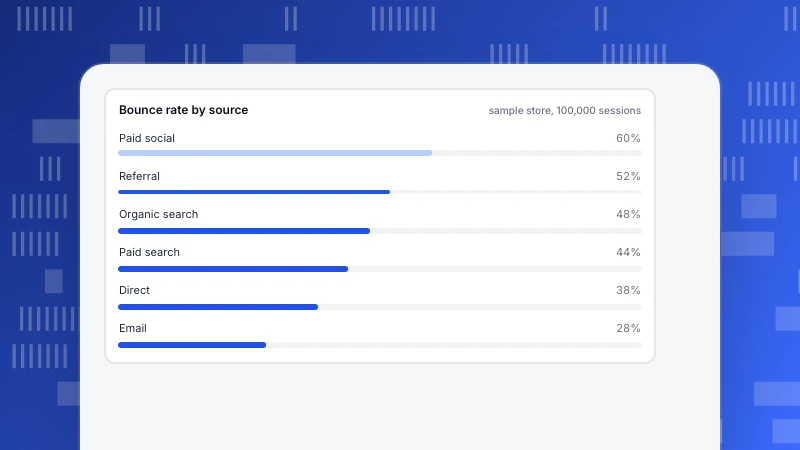
Average Ecommerce Bounce Rate: Benchmarks by Device, Source and Page Type
A store-wide average hides more than it shows. Split ecommerce bounce rate by device, traffic source and landing page, see which public benchmarks have a real source, and learn how traffic mix moves the number.
Read more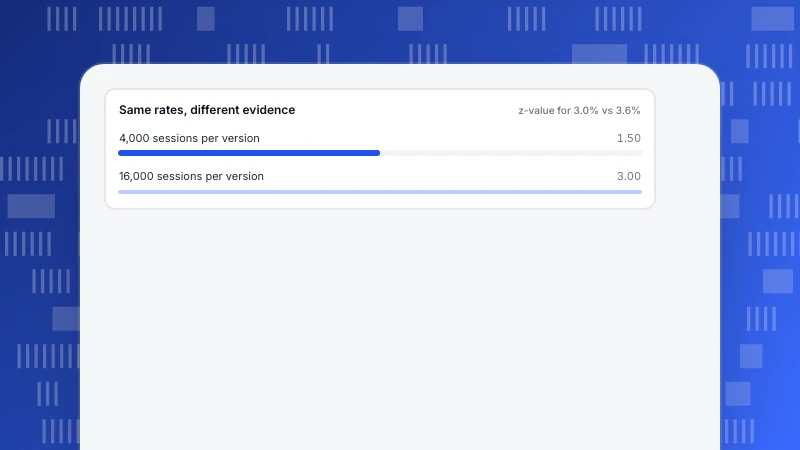
Data Skills for Marketers: A Five-Level Ladder With Practice Exercises
Five data skills a marketer needs, in order: read what a number counts, compare fairly, check it can be trusted, judge whether a difference is real, and explain it in one sentence. Worked examples, a test question per level and a five-week plan.
Read more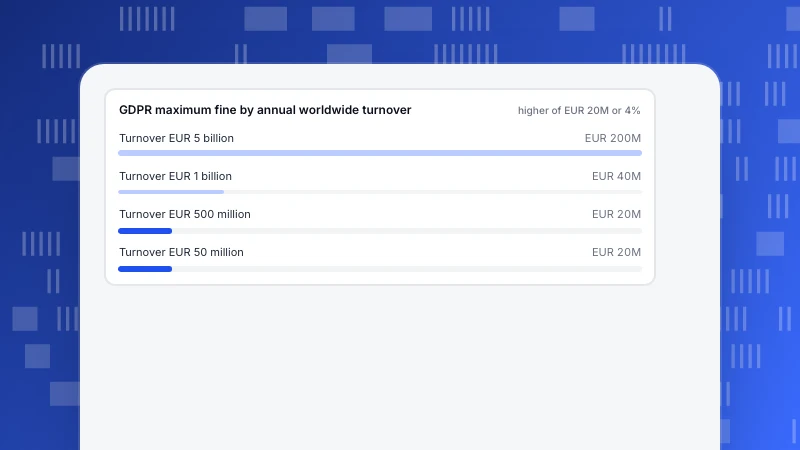
Data Privacy Issues in Analytics: Eight Risks and Their Fixes
The data privacy issues that matter in analytics are specific: consent, transfers, form and replay capture, retention and breaches. See each risk, a control for it, and what regulators and breaches have cost.
Read more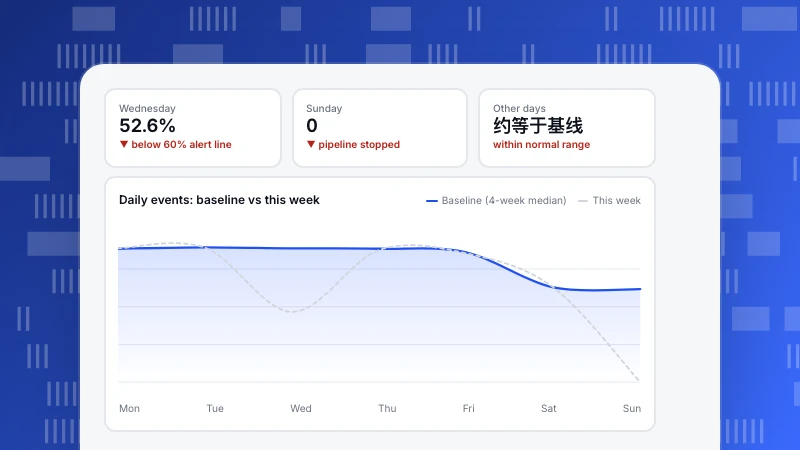
Data Pipeline Monitoring: Freshness, Volume and Schema Checks
Data pipeline monitoring needs a few checks with real thresholds. Learn freshness, same-weekday volume baselines, schema completeness and duplicate rules, with a worked bad week and a backtest step.
Read more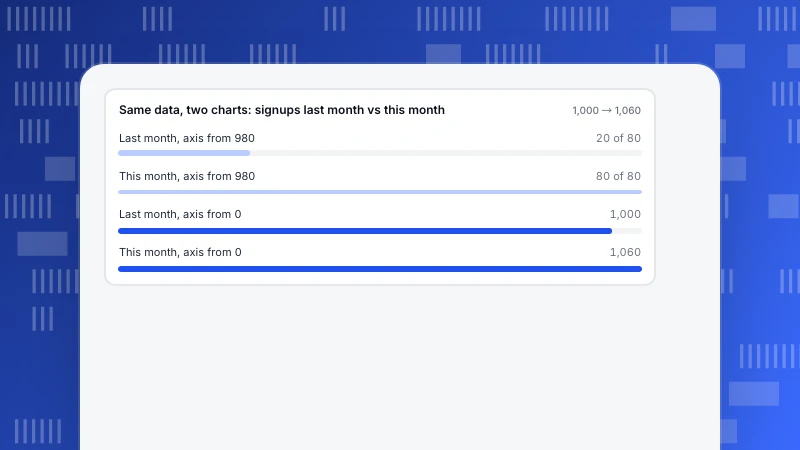
Data Misuse: Seven Examples of Misleading Analysis and Privacy Misuse
Data misuse is either a misleading claim from sound data or personal data used beyond its purpose. Seven examples with recomputable numbers, a rule for each and a pre-publication checklist.
Read more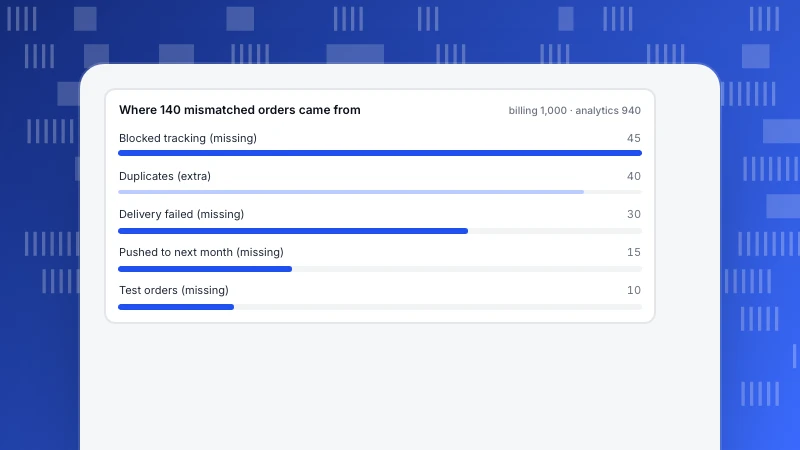
Data integration problems: 8 failure modes and how to diagnose them
A 6.0% net mismatch between two systems can hide a 14.0% gross one. Reconcile one unit, classify every unmatched row, and match eight failure modes to the signal each leaves in your data.
Read more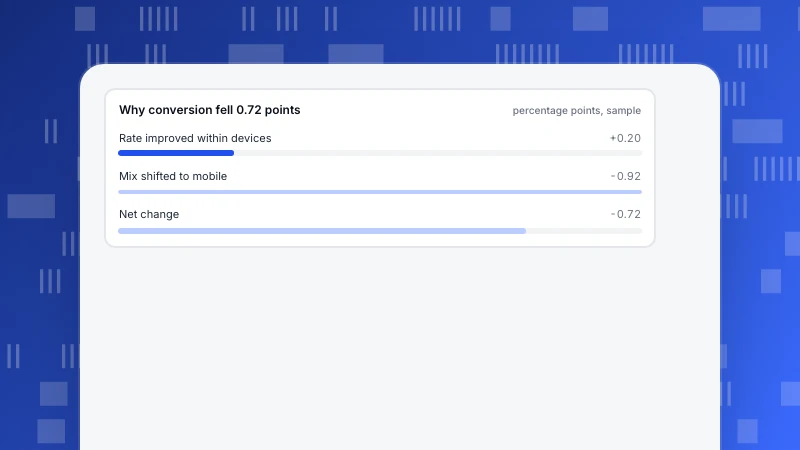
Data Insight Examples: 6 Worked Cases From Observation to Action
Six data insight examples with the arithmetic shown: a conversion drop that was a mix shift, a bot spike, a checkout leak, channel share, speed and rankings, each with a checked cause and an action.
Read more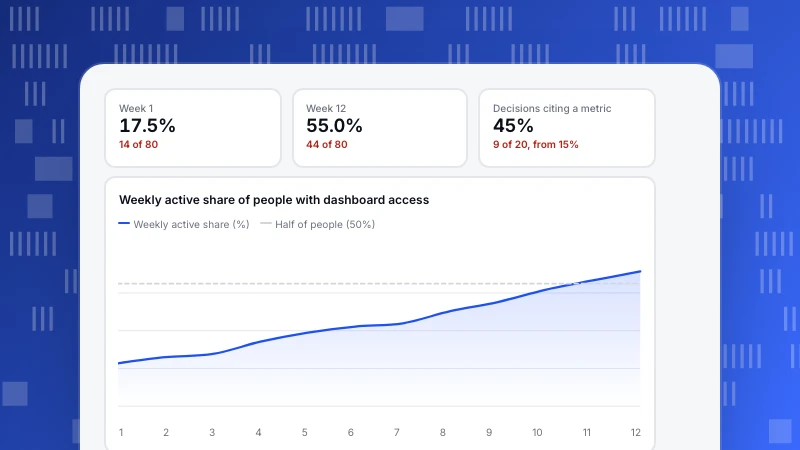
Data culture: how to build one that lasts, with adoption measures
Five steps to build a data culture, each with a number to watch: metric disputes, decisions that cite a metric, time to answer and weekly active share, with a sample scorecard.
Read more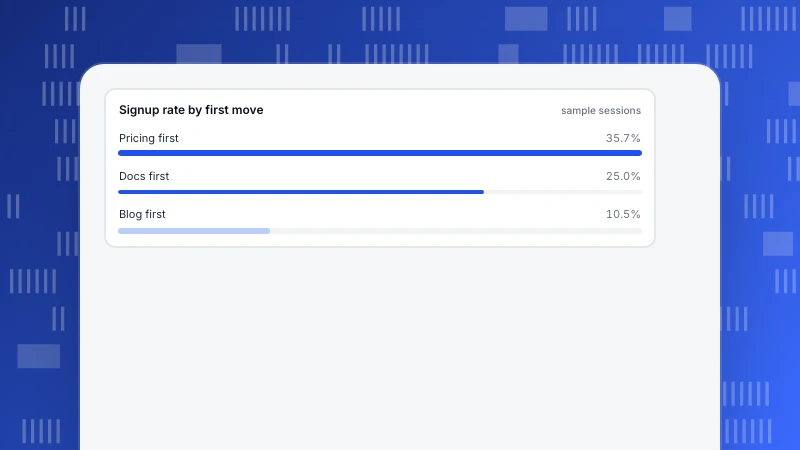
Customer Journey Visualization: Which Chart Fits Which Question
Path charts, Sankey diagrams, funnels and timelines answer different questions. A chart-by-question guide with a 1,000-session worked example, and how to read trimmed journey charts without being misled.
Read more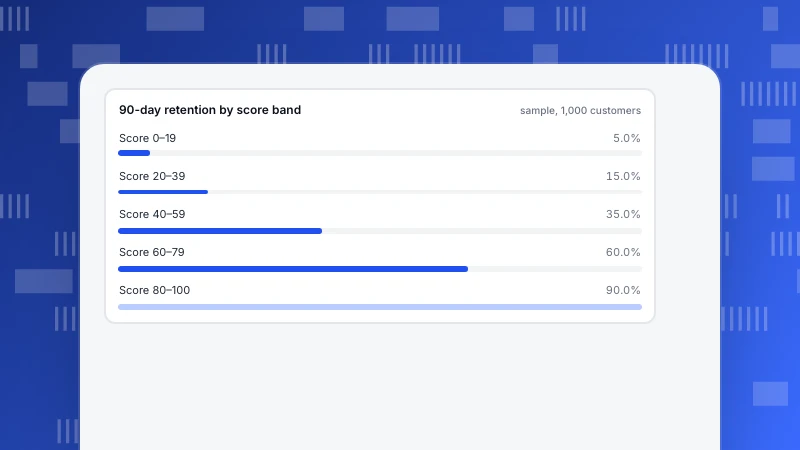
Customer Engagement Score: How to Calculate One That Predicts Retention
Build a customer engagement score from weighted events with caps and recency decay, score four sample people, then test the bands against 90-day retention so the score earns its place.
Read more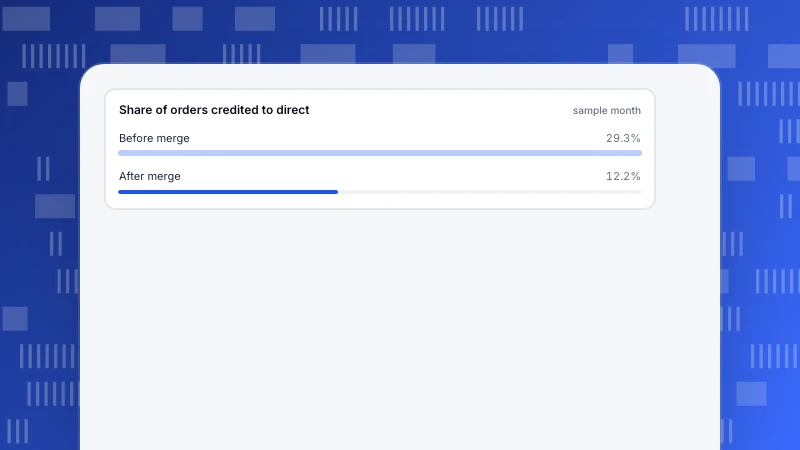
Benefits of a Customer Data Platform (and When You Do Not Need One)
A customer data platform gives one profile per person, correct counts and better attribution. A before-and-after identity merge example, the real costs including privacy, and five questions for when you do not need one.
Read more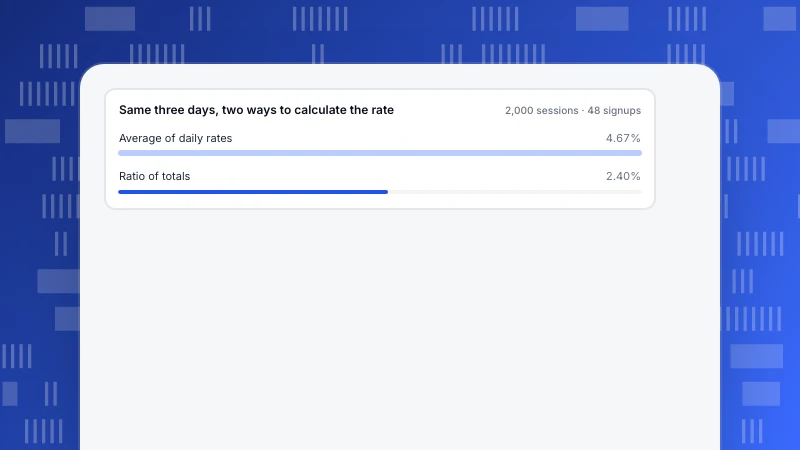
Custom metrics: how to define ones that drive decisions
A custom metric earns its place only if it changes a decision. A seven-field definition, seven formulas on one sample month, why averaging daily rates gives 4.67% instead of 2.40%, and the pitfalls that break ratios.
Read more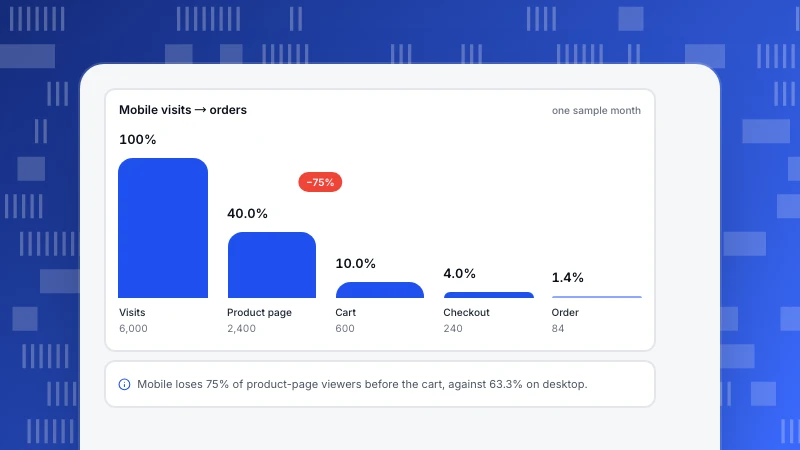
CRO analytics: which data to use at each step of optimization
CRO analytics turns behavior data into a testable hypothesis. A five-step workflow with a mobile vs desktop funnel, the evidence that explains each drop and a sample-size check that ranks tests by time to a verdict.
Read more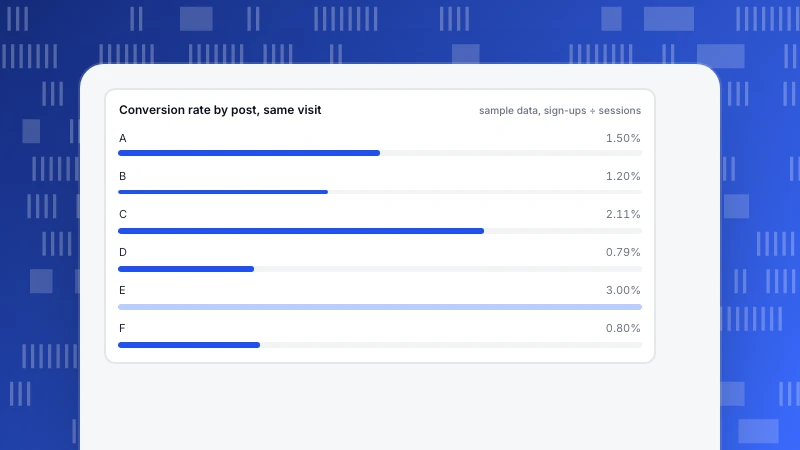
Content marketing dashboard: 8 panels, the metrics behind them and sample numbers
A content marketing dashboard should show which posts bring readers and results. Eight panels with metric definitions, sample numbers for conversions per post and search CTR, and how to build it.
Read more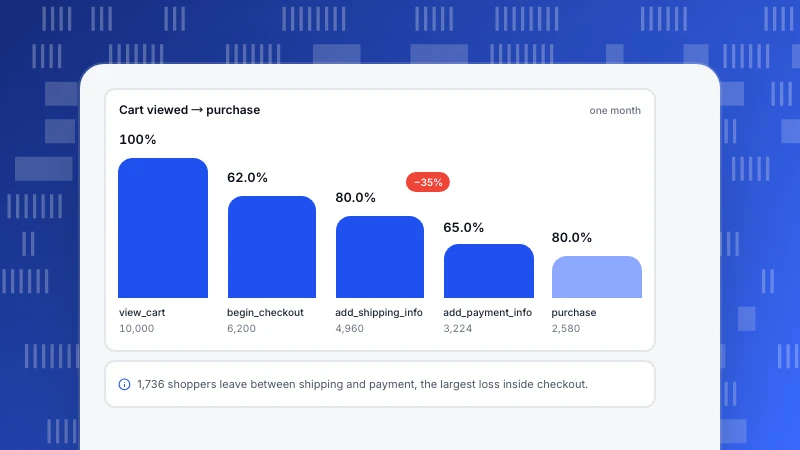
Checkout funnel analysis: find the step that loses orders
A step-by-step checkout funnel analysis with a worked example: calculate drop-off per step, split by device, test whether the gap is real and rank fixes by extra orders.
Read more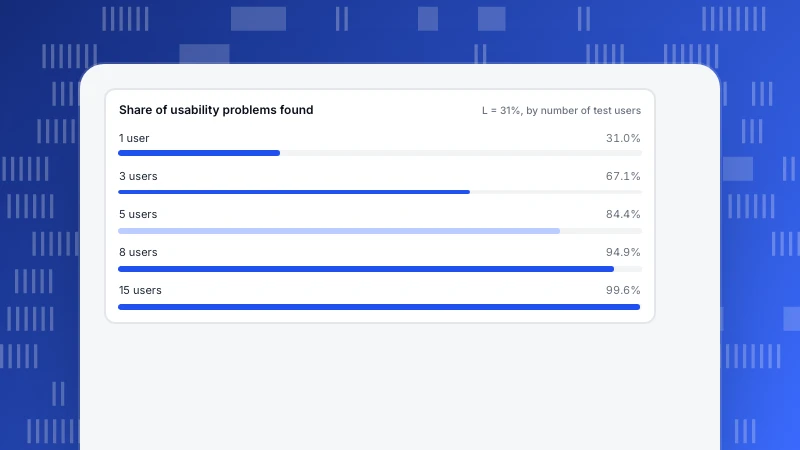
Best UX Tools: Pick by the Question You Need Answered
The best UX tools are the ones that answer a question you are asking. Six jobs a UX toolkit does, what each answers, how many test users you need, and which jobs a team of 1, 10 or 50 should cover first.
Read moreOther categories
Each category answers a recurring question we hear from customers. Start with the one closest to your job.
Growth & Marketing
Acquisition, marketing, site and app operations, and how to pick the one stage worth fixing first.
238 articlesLive Chat
Proactive invites, translation and turning support conversations into conversions.
78 articlesAI Search
GPTBot, ClaudeBot, PerplexityBot: who fetches your pages, what the files say and what comes back.
39 articlesProduct News
What shipped, why we built it that way, and how to turn it on.
64 articles