Try it on your own data
Every report in this article is in the free plan. One snippet for web and apps, up to 10 sites.
Start freeWeb analytics terminology comes down to counts (pageviews, sessions, visitors) and rates (bounce rate, conversion rate), and a rate is only clear once you know its denominator. This cheat sheet groups 42 terms into traffic, behavior, conversion and data, and shows what each counts and divides by.
What you will learn
- Ask two questions of every term: what is counted, and for a rate, divided by what
- The same day gives two conversion rates, 3.6% (per session) and 4.29% (per visitor): neither is wrong, so label the denominator
- Session, bounce and user have different definitions in different tools: compare definitions before dates
How to read a term: the thing counted and the thing divided by
Almost every confusing web analytics term is either a count (pageviews, sessions, visitors) or a rate (bounce rate, conversion rate), and a rate is only as clear as its denominator. When you meet a term, ask two questions: what is being counted, and for a rate, divided by what. The tables below answer both for 42 terms in four groups, with a link to the full definition where one exists.
Two words recur everywhere. A dimension is a label you group by, such as source, page or country. A metric is a number you measure, such as sessions or revenue. A report is a metric broken down by a dimension; see metric and custom dimensions. For the field as a whole, start at web analytics; this page is a lookup table, and for which numbers to track see analytics metrics.
Traffic terms: who arrived and from where
| Term | What it means | How it is counted |
|---|---|---|
| Pageview | One page loaded, or one route entered in a single-page app | Count of pageview events |
| Session | One visit: a burst of activity by one visitor | Cut by an idle timeout, often 30 minutes |
| Unique visitor | A distinct identifier seen in the period | Count of distinct IDs; one person on two devices is often two |
| New vs returning visitor | Whether the identifier was seen before | New visitors ÷ visitors gives the new share |
| Referrer | The page that sent the visitor | Read from the browser's referrer information |
| Source / medium | Where the visit came from, and the kind of link | Source such as a site or search engine; medium such as organic or email |
| Channel | A group of sources, such as search, social or email | Rules map sources to channels |
| UTM parameters | Tags you add to a link to name campaign, source and medium | Read from the landing URL |
| Direct traffic | Visits with no referrer or campaign tag | Everything left after other rules; includes untagged links and typed addresses |
| Landing page | The first page of a session | First pageview in each session |
| Entry and exit pages | First and last page of a session | Entry count and exit count per page |
| Bot traffic | Automated requests that are not people | Classified by signals; best kept in a separate report |
Two of these cause most confusion. Direct traffic is a bucket of unknowns, not a measure of loyal visitors, and a drop in referrers after a site changes its link policy can inflate it. Bots, if not separated, raise every count in the table without any new reader.
| Term | What it means | How it is counted |
|---|---|---|
| Pageview | One page loaded or route entered | Count of pageview events |
| Session | One visit, a burst of activity | Cut by an idle timeout, often 30 minutes |
| Unique visitor | A distinct identifier in the period | Count of distinct IDs |
| Landing page | First page of a session | First pageview in each session |
| Bot traffic | Automated requests that are not people | Classified by signals; keep separate |
Four groups, 42 terms in total; this table shows five traffic terms.
Behavior terms: what people did once they arrived
| Term | What it means | How it is counted |
|---|---|---|
| Bounce rate | Share of sessions that did very little | Bounced sessions ÷ sessions; the rule for "bounced" varies by tool |
| Engaged session | A session that passed an engagement test | Often: lasted 10 seconds or more, had a key event, or had at least 2 pageviews |
| Engagement rate | Share of sessions that were engaged | Engaged sessions ÷ sessions |
| Pages per session | Depth of a visit | Pageviews ÷ sessions |
| Average session duration | Length of a visit | Sum of session durations ÷ sessions |
| Time on page | How long one page stayed open | Measured at leave events, so a single-page session may have none |
| Scroll depth | How far down a page people went | Share of visitors reaching 25%, 50%, 75%, 100% of the page |
| Event | A recorded action with a time, such as a click or download | Count of event records; see event properties |
| Funnel | An ordered set of steps and the people who complete each | Step counts and step-to-step rates |
| Cohort | A group who share a starting point, such as signup week | Group by start date |
| Retention | Share of a group still active after N periods | People active in period N ÷ people in the cohort |
| Segment | A saved group defined by rules | People or sessions matching a rule |
Do not read bounce rate and engagement rate as exact opposites unless your tool defines them so. In Google Analytics, engagement rate is the percentage of engaged sessions and bounce rate the percentage that were not engaged; other tools define a bounce as a single pageview with no event, which is a different rule.
Conversion terms: what the visit was worth
| Term | What it means | How it is counted |
|---|---|---|
| Goal | The outcome you want, such as a signup | A chosen event or page |
| Conversion | One completion of a goal | Count of goal completions |
| Conversion rate | Share of visits or people who converted | Conversions ÷ sessions, or people who converted ÷ visitors |
| Drop-off rate | Share who left between two funnel steps | 1 − next step ÷ previous step |
| Attribution | Giving credit for a conversion to touchpoints | A model splits credit across the visits before conversion |
| Last-click attribution | All credit to the final touchpoint | One touchpoint gets 100% |
| Assisted conversion | A touchpoint that helped but was not last | Appears in a path before the final one |
| Lookback window | How far back touchpoints count | A number of days, often 30 |
| Cost per acquisition | Spend to win one customer or order | Spend ÷ acquisitions |
| ROAS | Revenue earned per unit of ad spend | Revenue ÷ spend |
The conversion rate is the most abused rate. "Conversions ÷ sessions" and "people who converted ÷ visitors" give different answers on the same data, and a visitor who converts twice raises the first but not the second. The worked example below shows the gap.
Data and privacy terms: how the numbers are made
| Term | What it means | Why it matters |
|---|---|---|
| First-party cookie | A cookie set by the site you are on | Used to recognise a returning browser; browsers can cap its life |
| Cookieless analytics | Counting without storing an identifier in the browser | Changes how returning visitors are recognised |
| Session timeout | Idle time after which a visit ends | Changes session counts for the same traffic |
| User ID | An identifier your site assigns after login | Lets one person be joined across devices |
| Custom dimension | A label you add yourself, such as plan type | Lets you group reports by your own categories |
| Core Web Vitals | Page experience measures such as loading and responsiveness | Collected from real visits |
| Error rate | Share of page loads with a script error | Errors ÷ pageviews |
| Bot filtering | Removing automated traffic from reports | Without it every count includes non-people |
Worked example: one day of numbers, every term
Sample data for one day on a small site:
| Input | Value |
|---|---|
| Pageviews | 2,400 |
| Sessions | 1,000 |
| Visitors | 700 |
| Sessions with one pageview and no event (bounced) | 520 |
| Sessions that lasted 10 seconds or more, or had 2 or more pageviews (engaged) | 610 |
| Sum of session durations | 180,000 seconds |
| Signup completions (conversions) | 36, made by 30 different visitors |
| Pageviews with a script error | 12 |
Now the terms:
- Pages per session = 2,400 ÷ 1,000 = 2.4.
- Average session duration = 180,000 ÷ 1,000 = 180 seconds.
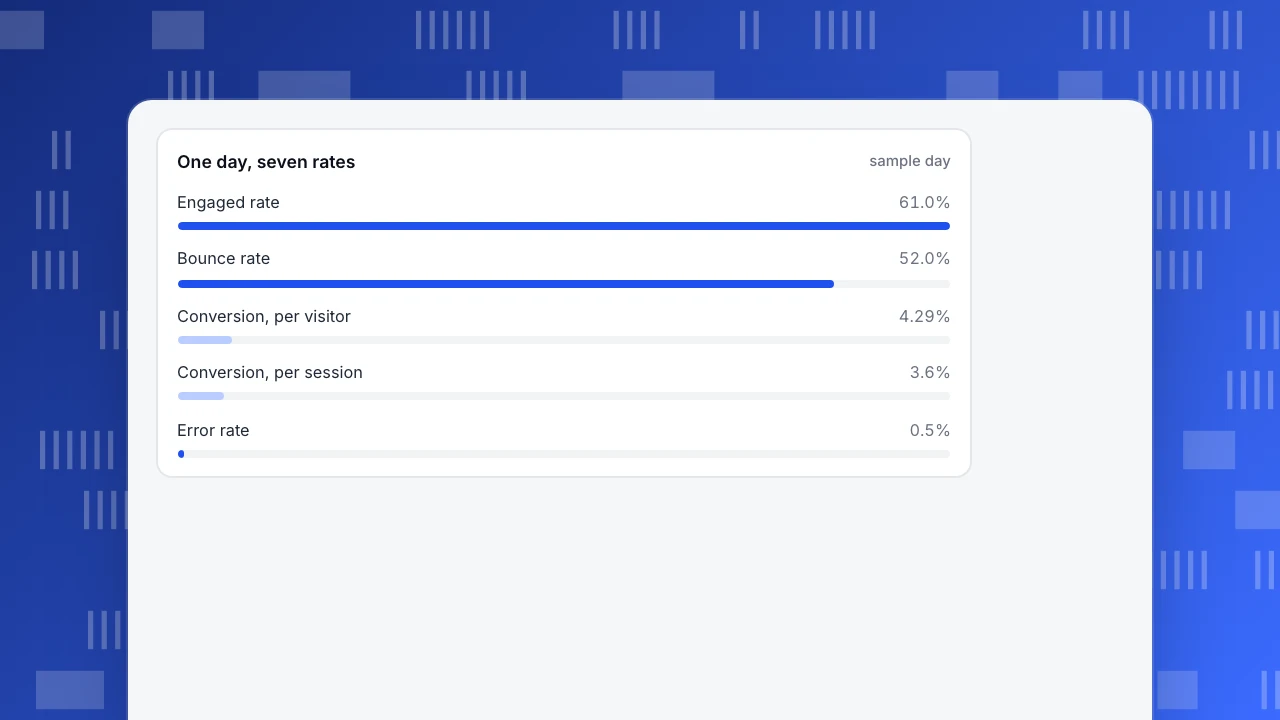
- Bounce rate = 520 ÷ 1,000 = 52.0%.
- Engaged rate = 610 ÷ 1,000 = 61.0%.
- Conversion rate on sessions = 36 ÷ 1,000 = 3.6%.
- Conversion rate on visitors = 30 ÷ 700 = 4.29%.
- Error rate = 12 ÷ 2,400 = 0.5%.
Note two things. Bounce and engaged rates do not add to 100% here because the tests overlap and differ. And there are two conversion rates, 3.6% and 4.29%, from the same day. Neither is wrong; they answer different questions. Pick one, write its denominator in the report title, and never compare it with a rate that uses the other.
One day, seven rates
sample dayTerms that mean different things in different tools
A shared word does not guarantee a shared definition. Check these before comparing numbers across tools.
- Session or visit. Google Analytics ends a session after 30 minutes of inactivity by default with no maximum length; other tools add a 24-hour maximum or split at midnight.
- Bounce. One tool defines it as a session that was not engaged, another as one pageview with no event.
- Users or visitors. Google defines total users as the unique users who triggered any event in the date range and active users as those who engaged; other tools count identifiers, people or devices. See unique visitor.
- Conversion rate. Per session or per person, and whether repeat conversions count.
- Direct. Which visits fall back into the bucket after the other rules have run.
When two tools disagree, compare definitions first and dates second; most gaps close at that step. For the difference between visit and view, see page view vs visit.
In TapCub: where each term lives
TapCub's web reports use these definitions, which you can check against the tables above.
- Traffic. Web analytics › Overview shows pageviews, visitors and sessions. Sessions are cut after 30 minutes idle with a 24-hour maximum by default; visitors default to the visitor ID. Web analytics › Sources groups by channel, source and UTM parameters, and channel rules can be configured.
- Behavior. Engaged means a duration of at least 10 seconds or at least 2 pageviews, and a hit on a goal marked as a key event also counts. A bounce is one pageview and no custom event. Average duration is the sum of session durations divided by sessions. Funnels, retention and segments are in All-platform analytics › Behavior › Behavior analysis and All-platform analytics › Users › Segments & tags.
- Conversion. Web analytics › Goals gives the goal conversion rate as distinct visitors who completed the goal ÷ distinct visitors, while the data report's conversion rate is conversions ÷ sessions. They are two different numbers, as in the example. All-platform analytics › Business › Channel ROI takes imported spend and computes cost per click and cost per acquisition; the attribution models are in Behavior analysis.
- Data and privacy. The script writes no cookie and no local storage; the visitor ID is derived on the server. Error rate is script errors ÷ pageviews. Bots and AI crawlers are classified and counted in Web analytics › Bots, so they stay out of the main numbers.
FAQ
What are the most important web analytics terms?
Start with the counts, pageviews, sessions and visitors, then two rates: bounce or engagement rate and conversion rate. Each needs a definition and a denominator. Once you can say what is counted and divided by what, the other terms follow.
What is the difference between a dimension and a metric?
A dimension is a label you group by, such as source, page or country. A metric is a number you measure, such as sessions or revenue. A report shows a metric split by a dimension, for example sessions by source.
What does bounce rate mean?
Bounce rate is the share of sessions that did very little. The rule varies: Google Analytics counts sessions that were not engaged, while other tools count a single pageview with no event. Always check the rule before comparing tools.
What is the difference between a session and a unique visitor?
A session is one visit, ended by an idle timeout. A unique visitor is a distinct identifier seen in a period. In the sample, 700 visitors made 1,000 sessions. Sessions are always equal to or higher than visitors.
Why do two analytics tools show different numbers?
Because the same word is defined differently: session length, bounce rule, what counts as a user, and whether bots are included. Compare definitions first and date ranges second.
Sources
- Google Analytics Help, Sessions: a session ends after 30 minutes of inactivity by default; there is no maximum length. Checked 2026-11-21.
- Google Analytics Help, Engagement rate and bounce rate: an engaged session lasts longer than 10 seconds, has a key event, or has at least two views; engagement rate and bounce rate definitions. Checked 2026-11-21.
- Google Analytics Help, Total users, active users and new users: user metric definitions. Checked 2026-11-21.
- TapCub documentation, web metric definitions (docs.tapcub.com). Checked 2026-11-21.
Was this article helpful?
We use your answers to fix and expand this page.
Couldn’t send. Please try again in a minute.
Thanks for the feedback. We’ll use it to improve this page.You’ve already sent feedback on this page. Thanks.

Data Analyst
Explores traffic sources, conversion funnels, and retention, using clear metric definitions and concrete examples to explain what the numbers mean.