Try it on your own data
Every report in this article is in the free plan. One snippet for web and apps, up to 10 sites.
Start freeEvery analytics tool shows dozens of metrics, and teams end up reporting whichever ones are on the default screen. These twelve cover traffic, engagement, conversion and data quality. For each one you get the formula, what it tells you and the trap that makes it misleading, plus a simple way to decide what normal looks like for your own site.
What you will learn
- Twelve website metrics in four groups: traffic, engagement, conversion, quality
- The two conversion rates (per person and per session) and why they never match
- An eight-week median and band to decide what is normal
Which analytics metrics matter
Twelve website analytics metrics cover almost every decision a site owner makes, and they fall into four groups: traffic (did people come?), engagement (did they read and act?), conversion (did they do what the site is for?) and quality (is the data, and the site, working?). Track these twelve with clear definitions before adding anything else.
The definitions matter more than the list. Each metric below has a numerator and a denominator, and most arguments about "wrong numbers" are two people using different ones. The table gives the formula, what the metric tells you and the trap to avoid.
| Metric | Formula | Tells you | Trap |
|---|---|---|---|
| Visitors | Distinct visitor IDs in the period | How many people came | Summed daily totals count returning people again |
| Sessions | Visits cut by session rules | How many visits | Timeout and midnight rules differ by tool |
| Pageviews | Page loads (and SPA route changes) | How much was read | SPA route changes may not be sent |
| New visitor share | New visitors ÷ visitors | How much traffic is new | Needs a stable identity across days |
| Sessions by source | Sessions grouped by channel | Where visits came from | Missing UTMs inflate direct |
| Bounce rate | Bounced sessions ÷ sessions | Single-page visits | GA4 defines it as non-engaged sessions |
| Engaged rate | Engaged sessions ÷ sessions | Visits with real activity | Key-event rules change it |
| Avg. session duration | Sum of durations ÷ sessions | Depth of visits | One-page sessions have no duration |
| Goal conversions | Completions of a defined goal | Outcomes | Goals added mid-period |
| Conversion rate | People who converted ÷ visitors (or conversions ÷ sessions) | Efficiency | Two denominators, two numbers |
| Revenue | Sum of goal revenue in one currency | Money | Refunds and currencies |
| Error rate | Script errors ÷ pageviews | Broken pages | Third-party script noise |
Label every report with the formula you used.
Traffic metrics
Visitors are distinct people (or browsers) in the period. The trap is the total: a sum of daily visitors counts a person who came on three days three times, while a range-deduplicated figure counts them once. Both are legitimate; label which one you report.
Sessions are visits cut by session rules, typically 30 minutes of inactivity. Google Analytics 4 uses a 30-minute default that can be changed per data stream, so check both tools' rules before comparing.
Pageviews count page loads, including route changes in single-page apps if your snippet sends them. They are the closest thing to a raw fact in web analytics.
New visitor share is new visitors divided by visitors. It tells you how much of the week came from people you had not seen before. It depends on recognising returning people across days, so cookieless tools with a daily-rotating identity cannot report it.
Sessions by source groups visits by channel: organic search, paid, social, referral, email, direct. A single source moving a lot is often the first sign of a tracking change rather than a real shift in demand.
Engagement metrics
Bounce rate is bounced sessions divided by sessions. Definitions differ: in TapCub a bounce is one pageview and no custom event; in Google Analytics 4 bounce rate is the share of sessions that were not engaged (Google: engagement rate and bounce rate). Compare it within one tool.
Engaged rate is engaged sessions divided by sessions. Google defines an engaged session as one that lasted 10 seconds or longer, had a key event, or had two or more page or screen views (Google: dimensions and metrics). TapCub uses the same thresholds, with a hit on a goal marked as a key event counting too.
Average session duration is the sum of session durations divided by sessions, where duration is the last event minus the start. A one-page session with no later event has no measurable duration, which is why time on page for exit pages is often understated.
Pages per session is pageviews divided by sessions. It is useful on content sites and nearly meaningless on single-page apps.
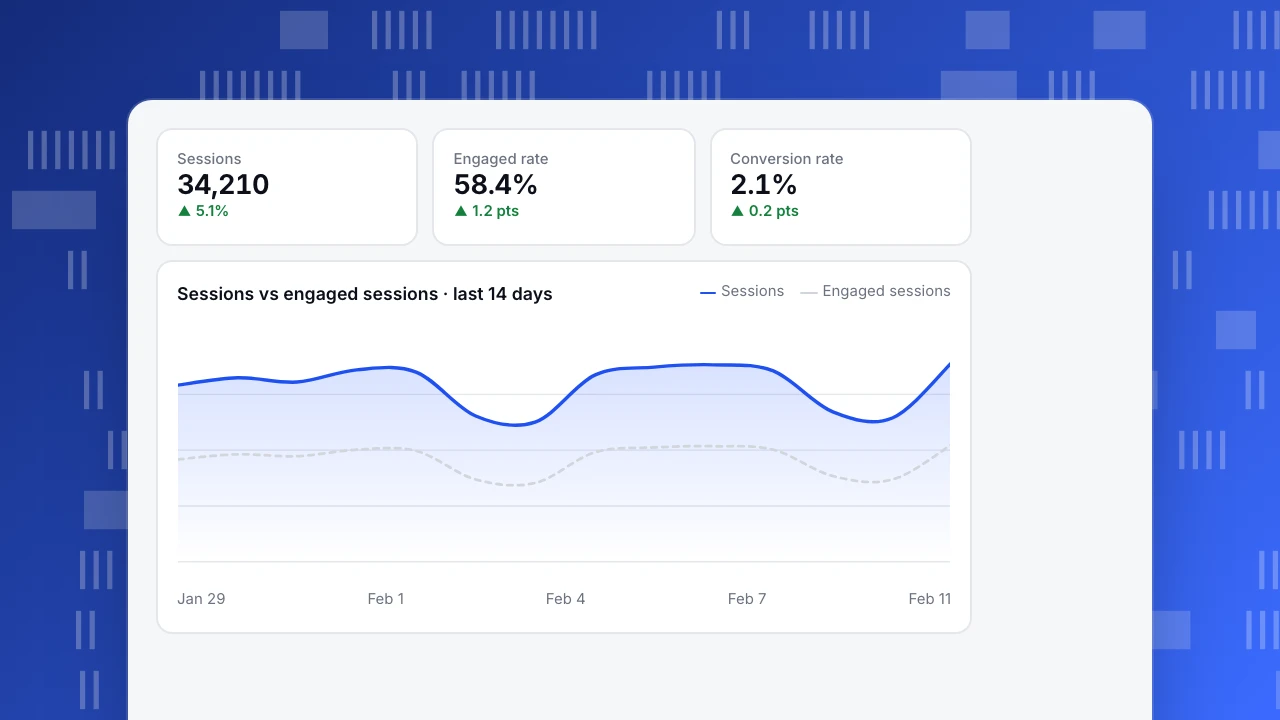
Sessions
34,210
▲ 5.1%
Engaged rate
58.4%
▲ 1.2 pts
Conversion rate
2.1%
▲ 0.2 pts
Sessions vs engaged sessions · last 14 days
SessionsEngaged sessionsConversion metrics
Goal conversions count completions of the actions you defined: a sign-up, a purchase, a form. Define goals before you report on them, and keep the names stable.
Conversion rate is where most confusion comes from, because there are two of them. A goal conversion rate divides distinct people who completed the goal by distinct visitors. A report conversion rate divides conversion events by sessions. On the same site the session-based rate is usually lower, because one person has several sessions. Never put the two side by side without labels.
Revenue is the sum of the value attached to goals that carry revenue, in one currency. Send amounts from the server where you can, so refunds and failed payments can be reconciled.
Quality metrics
Quality metrics tell you whether the other nine can be trusted.
- Error rate: script errors divided by pageviews. A jump after a release usually means a broken page, and broken pages convert at zero.
- 404s: pages that returned "not found", with the page that linked to them. Fix the link, not the 404 page.
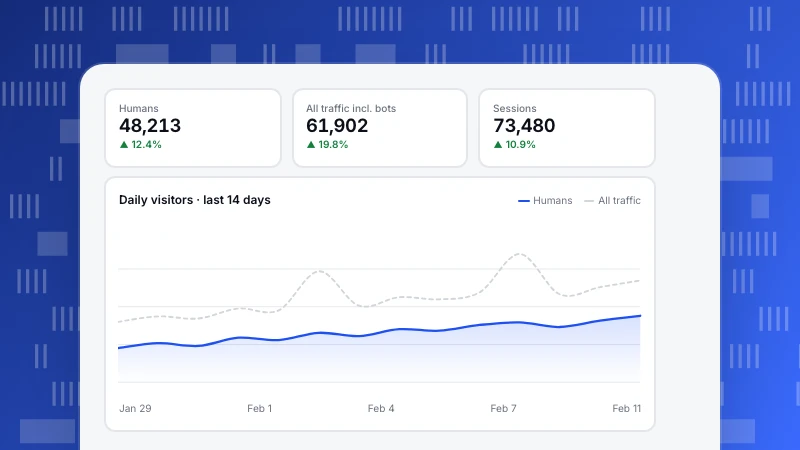
- Bot share: recognised bot traffic as a share of all traffic. If one report includes bots and another does not, the two will disagree on every crawl day.
How to set a normal range
A metric only becomes useful when you know what normal looks like for your own site. Industry averages rarely transfer: a documentation site, a store and a SaaS sign-up page have very different bounce rates and conversion rates.
A simple method that works for weekly reporting:
- Take the last eight complete weeks of the metric.
- Use the median as the expected value, not the mean, so one campaign spike does not move it.
- Set a band, for example the median plus or minus 15%, or the lowest and highest of the eight weeks.
- Flag a week only when it leaves the band, and write one line on why.
For example, if weekly conversion rate over eight weeks was 1.8%, 1.9%, 2.0%, 1.9%, 2.2%, 1.7%, 2.0% and 1.9%, the median is 1.9% and a ±15% band runs from about 1.6% to 2.2%. A week at 2.1% is normal; a week at 1.4% deserves a look.
Compared with Google Analytics 4
Most metric names are shared between tools, and most definitions are close but not identical. The usual differences are the identity behind "users", the session rules, whether bots are removed, and whether conversion rate is per person or per session. Before reporting a metric that someone will compare with GA4, write the two definitions side by side; the article on why analytics tools show different numbers lists the eight causes.
FAQ
What are the most important website metrics?
Visitors, sessions, sources, conversion rate and goal conversions answer the core questions. Add bounce or engaged rate to judge landing pages, and error rate and 404s to catch broken pages.
What is the difference between a metric and a KPI?
A metric is any measured value. A KPI is a metric you have tied to a goal and a target, such as "trial sign-up conversion rate above 2%". Every KPI is a metric; most metrics should not be KPIs.
Is bounce rate still a useful metric?
Yes, within one tool and per page type. A high bounce rate on a blog post that answers the question is fine; on a pricing page it is not. Compare pages with similar purposes.
Why is my conversion rate different in two reports?
One divides people by people and the other divides conversions by sessions, or one includes bots and the other does not. Check the denominator first.
How often should I review website metrics?
Weekly for most sites, with a daily check on errors and 404s. Monthly reviews hide problems for too long; daily reviews of conversion rate mostly show noise.
Was this article helpful?
We use your answers to fix and expand this page.
Couldn’t send. Please try again in a minute.
Thanks for the feedback. We’ll use it to improve this page.You’ve already sent feedback on this page. Thanks.

Data Analyst
Explores traffic sources, conversion funnels, and retention, using clear metric definitions and concrete examples to explain what the numbers mean.