Blog Analytics, growth and chat, explained with real numbers
Practical notes from the team building TapCub: how metrics are defined, where funnels break, what AI crawlers take from your site, and how support teams turn conversations into conversions.
Humans
48,213
▲ 12.4%
All traffic incl. bots
61,902
▲ 19.8%
Sessions
73,480
▲ 10.9%
Daily visitors · last 14 days
HumansAll trafficWhy analytics tools show different numbers: 8 causes and a reconciliation checklist
Two analytics tools on one site never print the same visitor count. Here are the eight causes, a worked example of where the gap goes, and a checklist to reconcile them.
What you will learn
- The eight reasons two analytics tools disagree, and which number each one moves
- A worked example: bots and consent explain most of a typical gap
- Compare daily uniques, not monthly, and read funnels inside one tool


Browse every article
Filter by category or search a keyword. Every article links to the report or setting it talks about.
723 articles · page 1 of 16
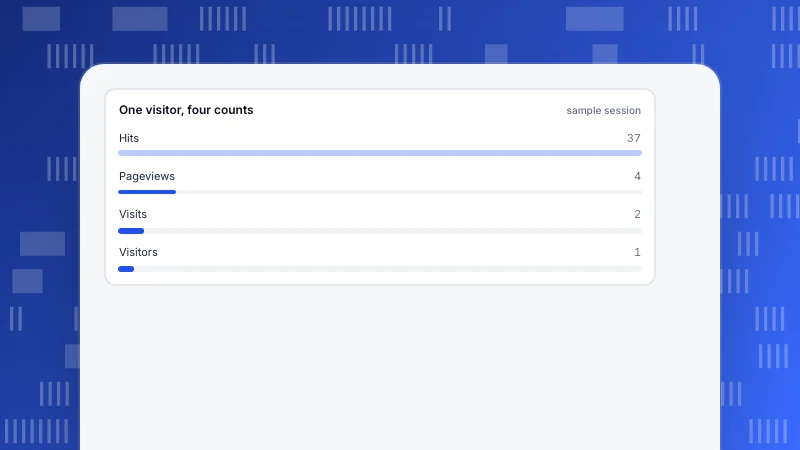
Website visits vs pageviews vs hits: what each number counts
Site views can mean hits, pageviews, visits or visitors, and the same traffic can be 37, 4, 2 or 1. One counted session shows where each number comes from and which one to report.
Read more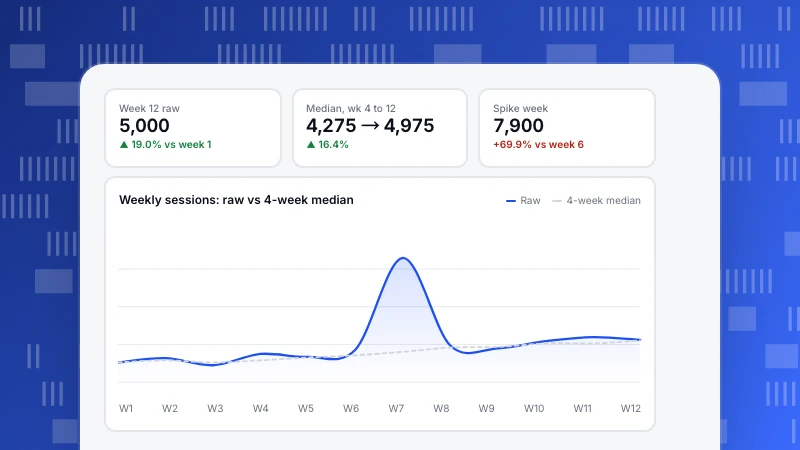
Website Traffic Over Time: Separate Trend, Season and Spike
A traffic chart mixes three things: a trend, a season and one-off spikes. Use weekly buckets, a rolling median and year-on-year comparison to tell them apart before you react.
Read more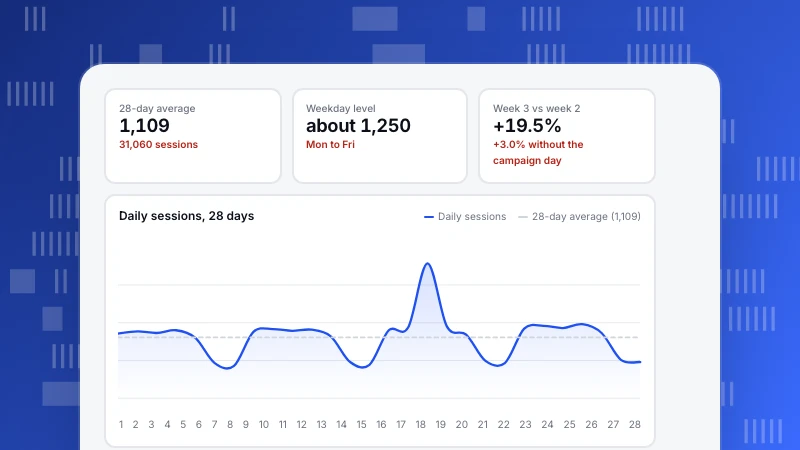
Website traffic graphs: which chart fits which question, and the traps to avoid
Line, bar or area? Match the chart to the question using one 28-day traffic dataset, see which number each chart distorts, and learn the traps: truncated axes, stacked areas, partial periods and dual axes.
Read more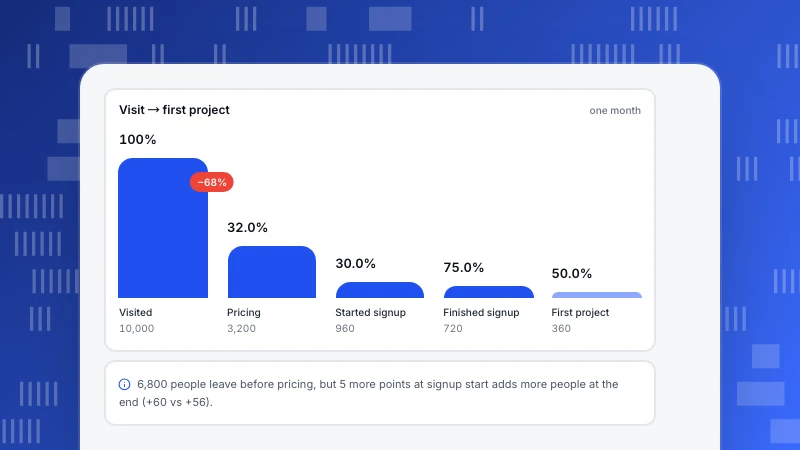
Website funnel analysis: calculate drop-off and pick the step to fix
How to run website funnel analysis: choose steps, calculate step rates and drop-off with a worked example, rank fixes by people gained and check sample size.
Read more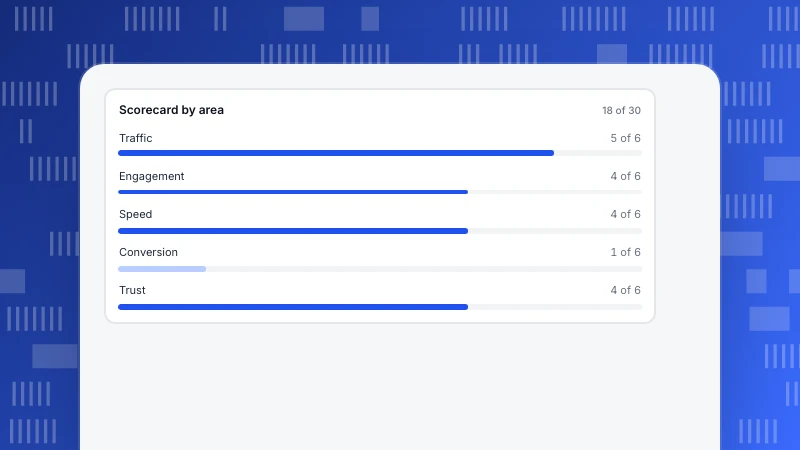
Website Evaluation: A Data-Driven Scorecard for Traffic, Engagement, Speed and Conversion
Evaluate a website with a 15-metric, 30-point scorecard across traffic, engagement, speed, conversion and trust, using Core Web Vitals and WCAG thresholds where they exist and your own 90-day median elsewhere.
Read more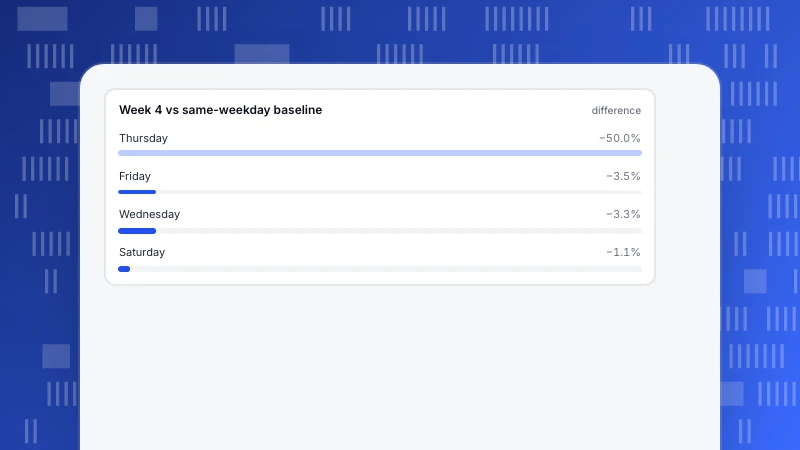
Web Traffic Monitoring: Baselines and Alert Thresholds That Work
Web traffic monitoring compares visits with a same-weekday baseline and alerts only when the drop is both statistically unusual and large enough to matter. Worked week, threshold rules and a TapCub setup.
Read more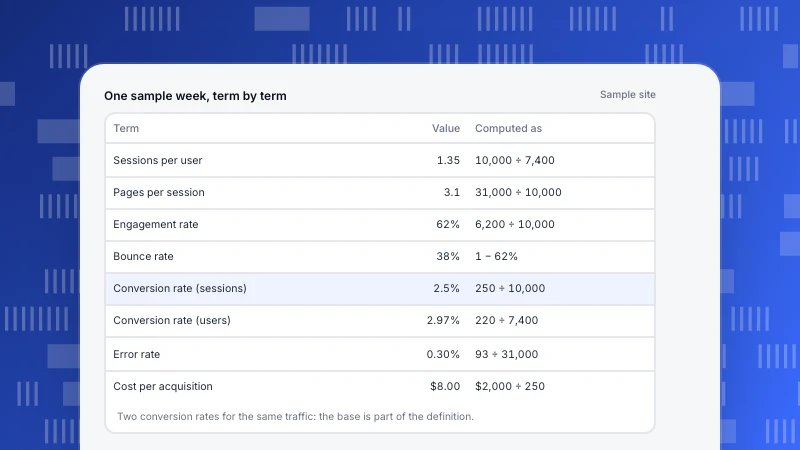
Web Analytics Terms: A Grouped Glossary With Formulas and One Worked Week
Web analytics terms grouped by the question they answer: traffic, engagement, conversion, performance and data. Each term has a plain definition, a formula and the choice to check, computed from one sample week.
Read more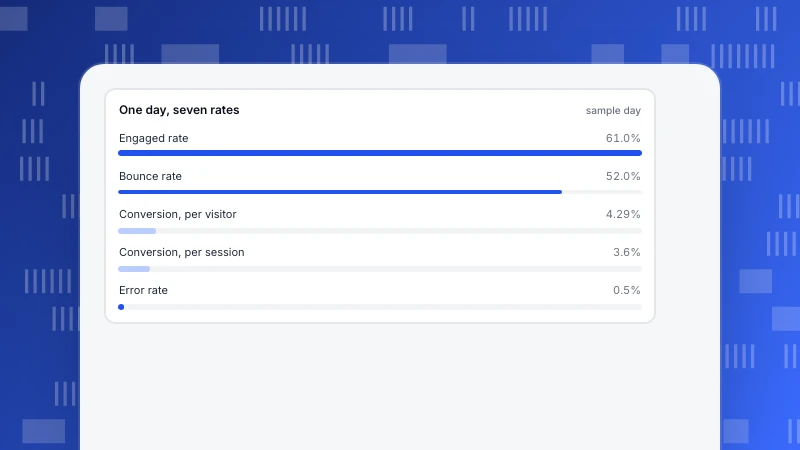
Web analytics terminology: 42 terms by what they count
A grouped cheat sheet of web analytics terms: traffic, behavior, conversion and data. Each term shows what is counted and, for rates, what it is divided by, with one day of numbers that recomputes them all.
Read more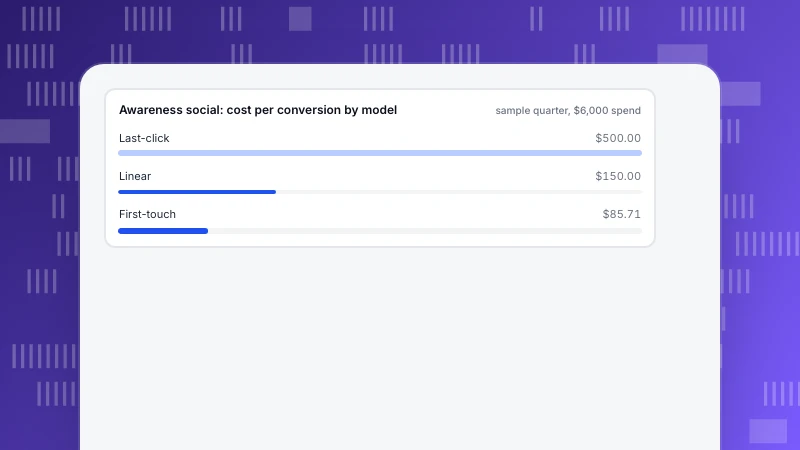
Upper Funnel Marketing: Tactics and the Metrics That Prove They Work
Upper funnel marketing is judged by reach, engaged sessions and assisted conversions, not last-click sales. A metric table by stage and a three-channel example where awareness costs $500 or $85.71 per conversion depending on the model.
Read more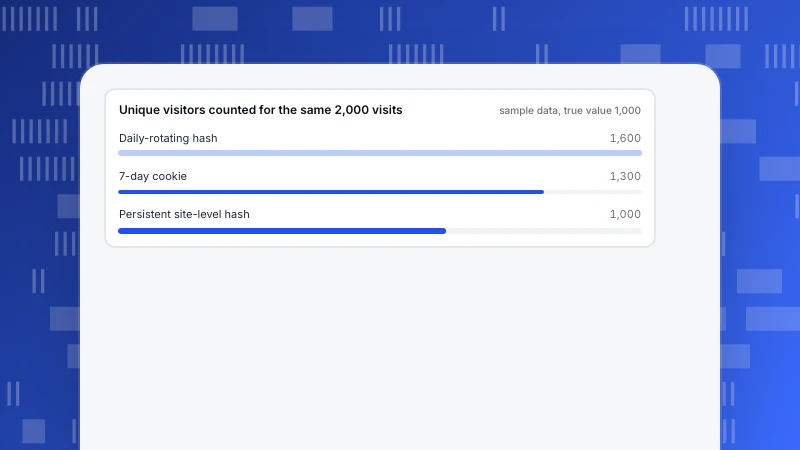
How to track web traffic without cookies: methods and accuracy
Six ways to track web traffic without cookies, what each costs in accuracy with a worked example, and when consent is still needed.
Read more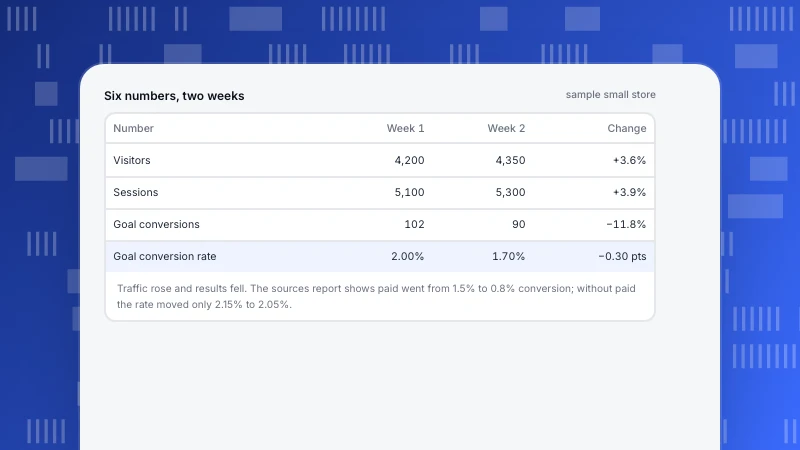
Simple Web Analytics: The Six Numbers to Read Each Week
Simple web analytics is six numbers, one goal and a weekly habit. See which metrics to keep, a worked two-week report, and the rules for when to add funnels or segments.
Read more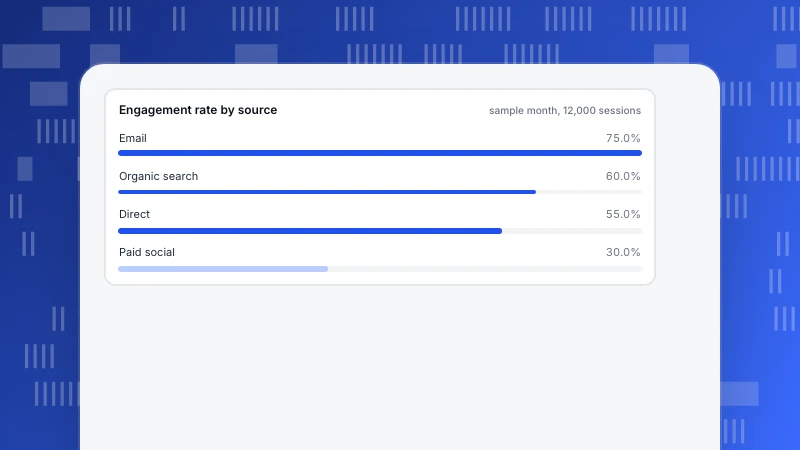
Session Analytics: Metrics, Distributions and Five Practical Uses
Session analytics treats each visit as a unit. The metrics built on sessions and how each is counted, why the average session duration misleads, a four-source worked example and five uses with the steps to run each.
Read more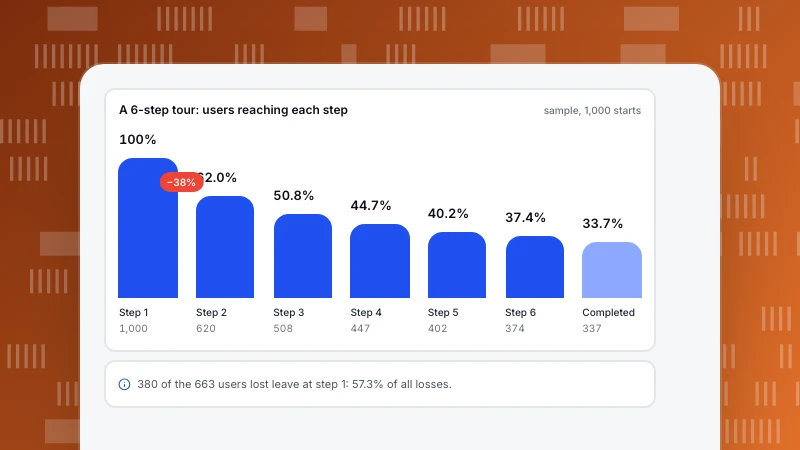
SaaS Product Tour: How Many Steps Before Completion Drops
In published benchmarks, product tour completion falls from 73% at one or two steps to 8% at nine or more. See a worked completion funnel, where users leave, what cutting steps gains and how to prove a tour works.
Read more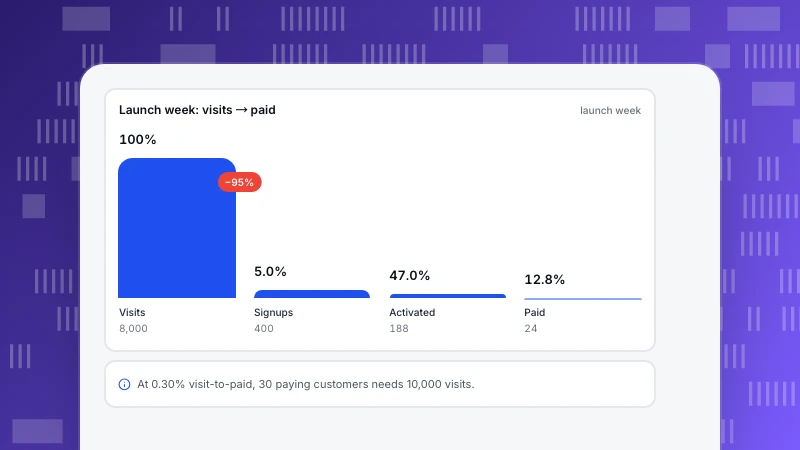
SaaS product launch checklist: what to measure before, during and after
How to launch a SaaS product with numbers: back-solve traffic from a goal, pass-condition checks before launch, a by-source launch-week table and week 2–4 checks.
Read more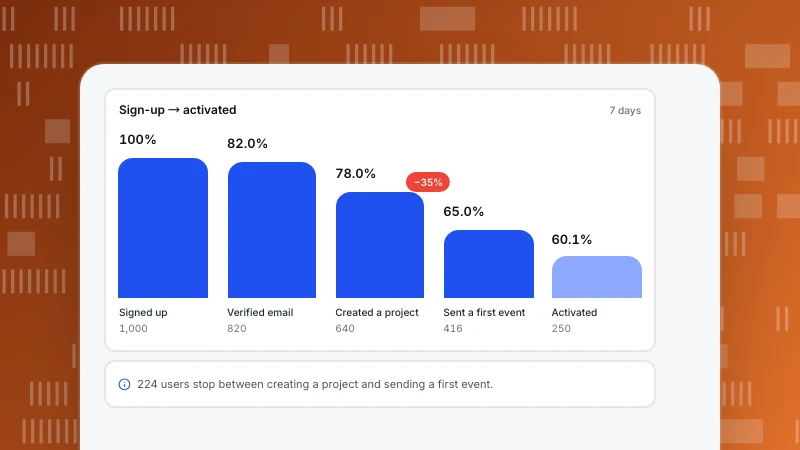
SaaS onboarding: build the flow around activation, with the funnel math
SaaS onboarding exists to get new users to activation. How to pick the activation event from your data, compute the activation funnel, estimate a fix in users, and measure it with the right metrics and an honest benchmark.
Read more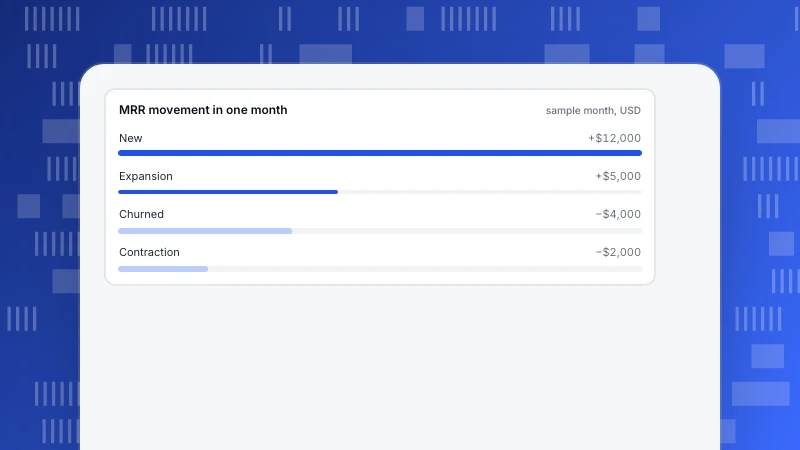
SaaS metrics dashboard: a layout by stage, with the numbers to show
A SaaS metrics dashboard should follow the customer path: acquire, activate, pay, stay. One sample company shows the MRR bridge, churn, GRR, NRR, CAC payback and where each number really lives.
Read more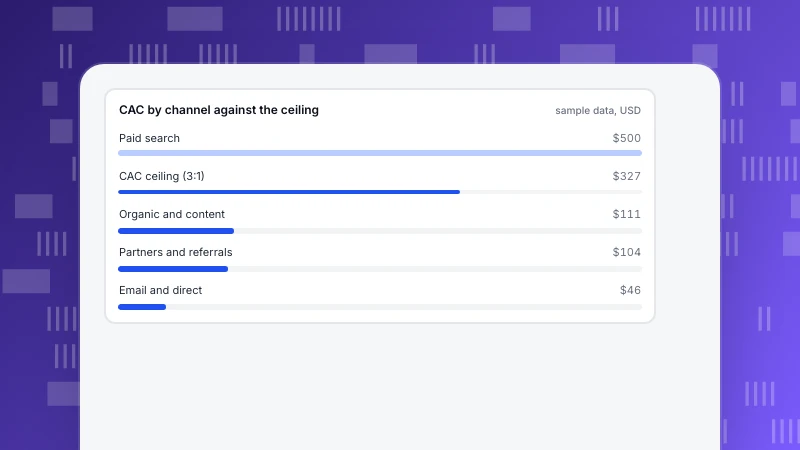
SaaS marketing plan: a metrics-first template with funnel math
A SaaS marketing plan built backward from the revenue target: customers to sign-ups to visitors, a CAC ceiling from LTV, channel budgets checked one by one, KPIs and a 90-day calendar, with every number recalculated.
Read more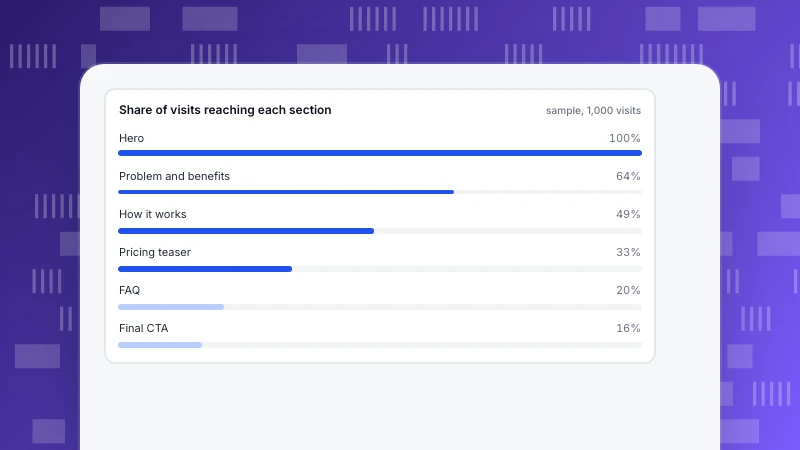
SaaS Landing Page Examples: The Structure Behind Pages That Convert
SaaS landing page examples broken into nine sections, three composite structures and a scroll-reach table you can recompute, with what each section must prove and the number that shows it works.
Read more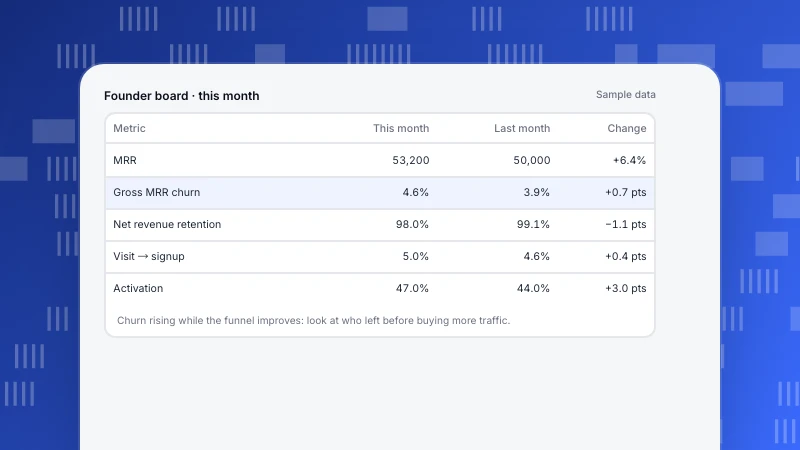
SaaS dashboard examples: layouts for founder, product and support
Three SaaS dashboard layouts with sample data: a founder board with an MRR bridge, a product board for activation and retention, and a support board.
Read more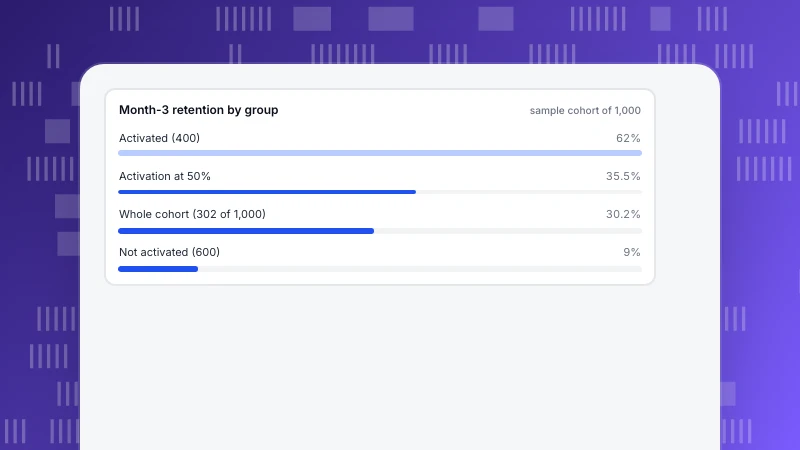
SaaS customer retention strategies, tied to usage and cohort data
SaaS retention is decided early. A cohort split by activation prices each strategy in customers: raise activation, reach stalled signups, flag usage drops, track B2B accounts and keep billing failures separate.
Read more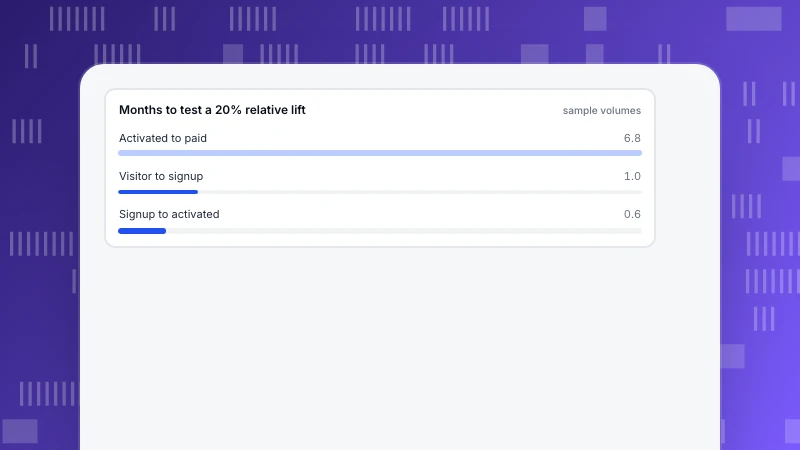
SaaS CRO: Fixing the Visitor-to-Signup-to-Paid Funnel
SaaS CRO means measuring four funnel stages and working on the one you can actually test. A worked funnel, a sample-size table showing paid conversion needs 6.8 months to test, fixes per stage and TapCub steps.
Read more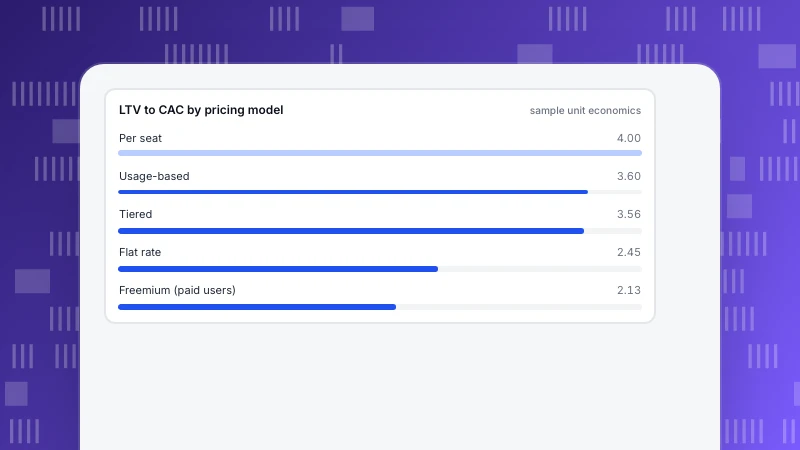
SaaS business model examples, compared on unit economics
Five SaaS pricing models compared on one set of formulas: LTV, LTV to CAC and CAC payback for flat rate, per seat, tiered, usage-based and freemium, plus how sensitive LTV is to churn.
Read more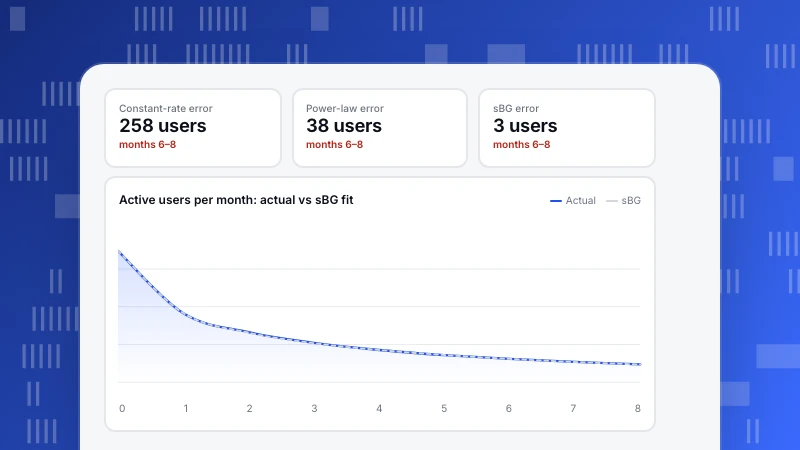
Retention modeling: fit a curve and project survivors
Fit three retention models to one cohort, test them on months they never saw and project how many users are still active at month 12 and 24, with the table and the method.
Read more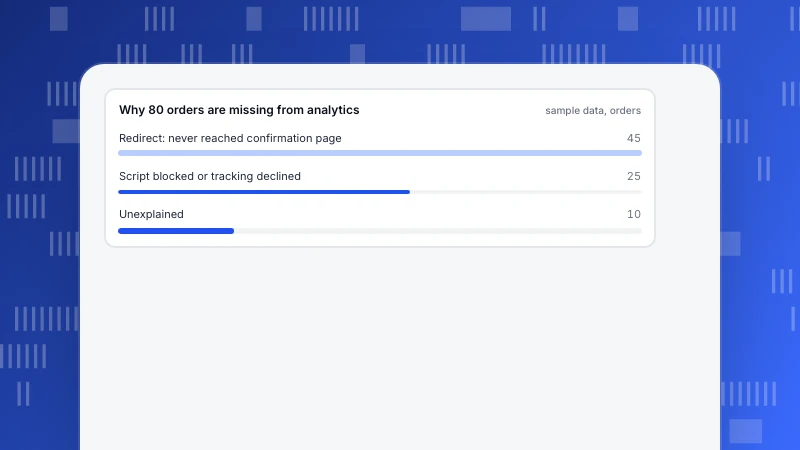
Reliable data: five tests to tell if your analytics can be trusted
How to tell if analytics data is reliable: reconcile with a second source, check sampling, audit tracking, spot double-firing and test timing, with worked numbers.
Read more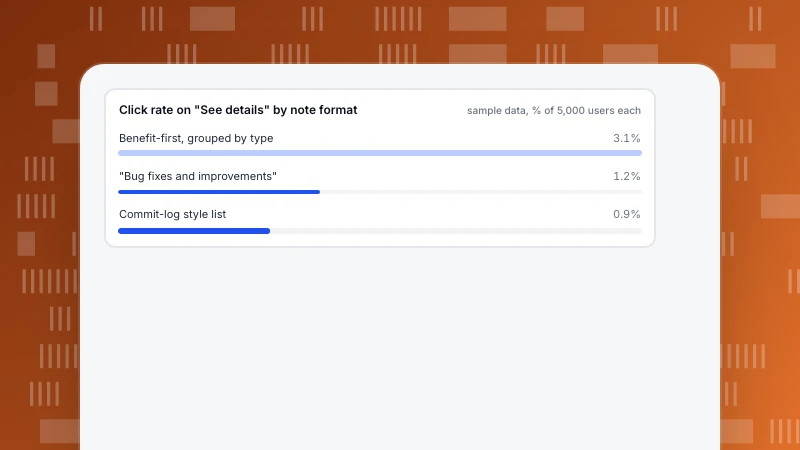
Release notes examples: annotated good and bad notes
Release notes examples with annotations: two bad ones and why they fail, two good ones and why they work, a channel length table and a sample click comparison of three formats.
Read more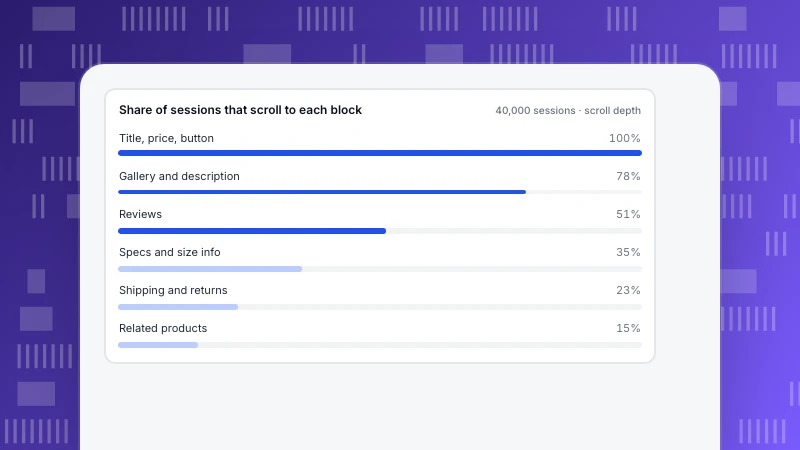
Ecommerce Product Page Optimization: Fix the Highest-Reach Element First
Rank product page changes by how many shoppers see them, how much you think each could add and how hard it is. A worked example turns six ideas into an order of work in extra orders per effort.
Read more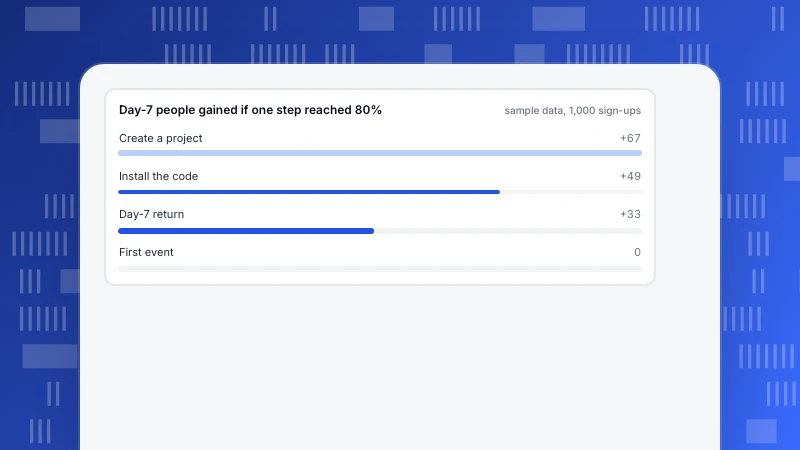
Product optimization: a data-driven loop from metric to change
Product optimization is a loop: pick a metric, find the biggest gap, write a hypothesis, make a small change and read the result. A worked onboarding funnel, test sizes and a feature adoption table.
Read more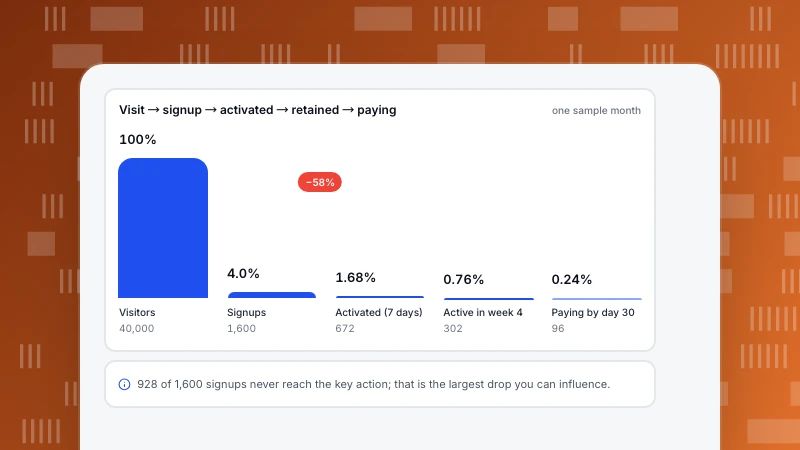
Product Metrics: The Four Groups to Track, With Formulas
Product metrics grouped by acquisition, activation, retention and revenue, each with a formula and a sample value, plus one cohort carried from visit to payment and rules for how many to track.
Read more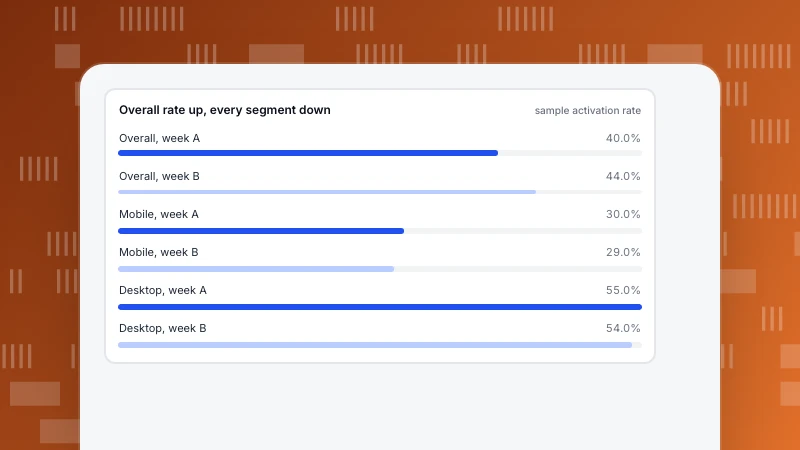
Product benchmarking: compare your usage metrics the right way
Benchmark how people use your product, not only rival features. Build a band from your own 12 weeks, test any outside number for definition and unit, and avoid a mix shift that fakes an improvement.
Read more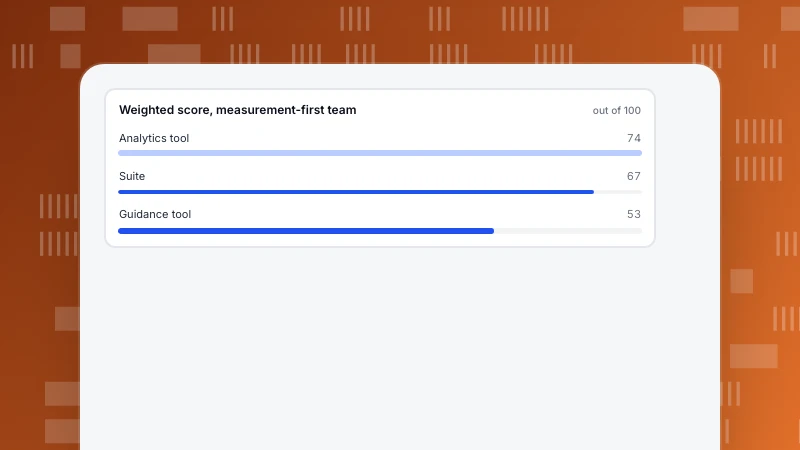
Product adoption software: how to choose and compare it
Product adoption software covers analytics, in-app guidance or both. Test any candidate against one adoption rate you computed yourself, score six criteria with your own weights, and run a one-week trial.
Read more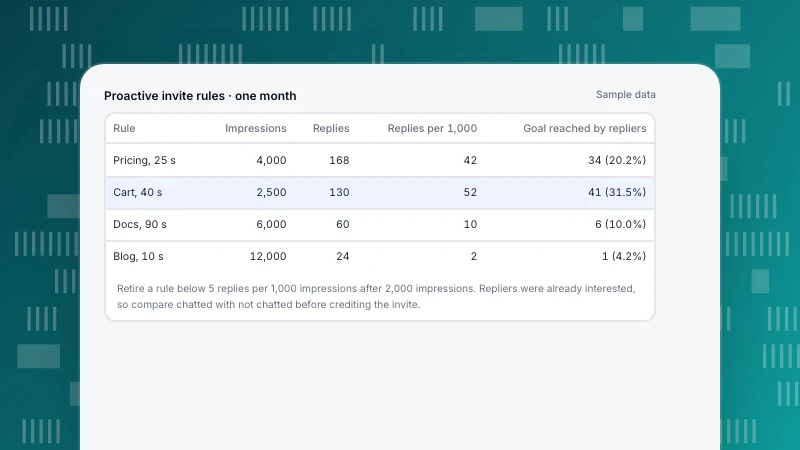
Proactive chat examples by trigger, with copy and the numbers to judge them
Proactive chat examples grouped by trigger: page, time and intent, each with copy under 300 characters and the setting that fires it, plus a sample table that shows which rules earn replies and which to retire.
Read more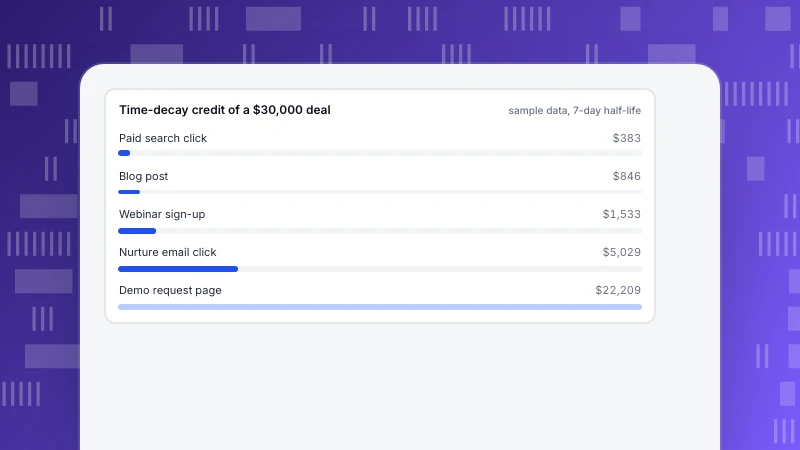
Pipeline attribution: opportunity-level vs lead-level credit with a worked deal
Pipeline attribution credits the touches behind each opportunity. One $30,000 deal credited under five models, why lead-level credit ignores nurture and double counts contacts, and how long the lookback window must be.
Read more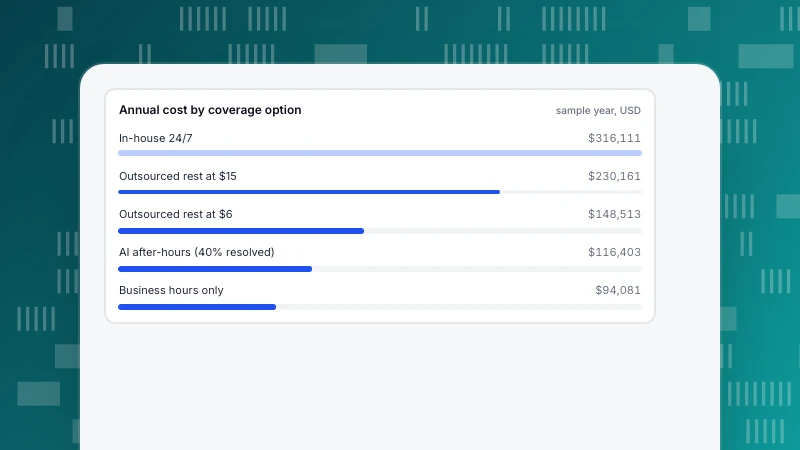
24/7 live chat outsourcing: what it costs and when it pays off
Outsourcing 24/7 live chat pays off only below a break-even price per chat. A worked cost model from public wage data compares an in-house seat, outsourcing the quiet hours and AI after-hours.
Read more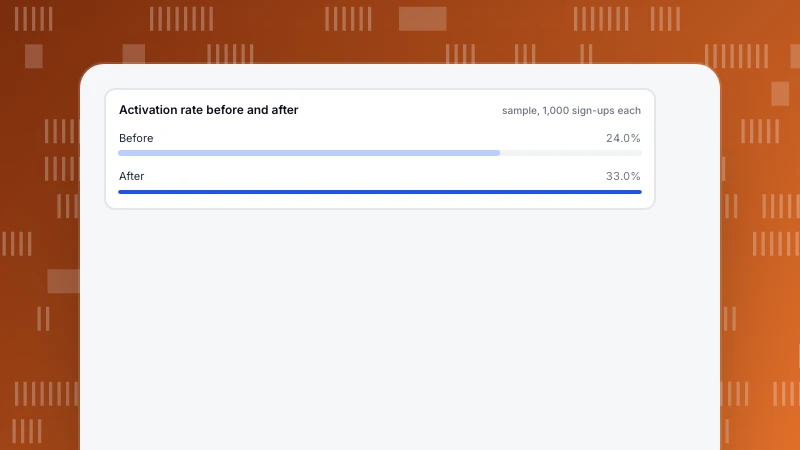
Onboarding Examples: Six Patterns and the Activation Numbers Behind Them
Six onboarding patterns, what each targets and how it fails, with a worked before-and-after funnel (24.0% to 33.0% activation), how to pick the activation event and how to roll out changes.
Read more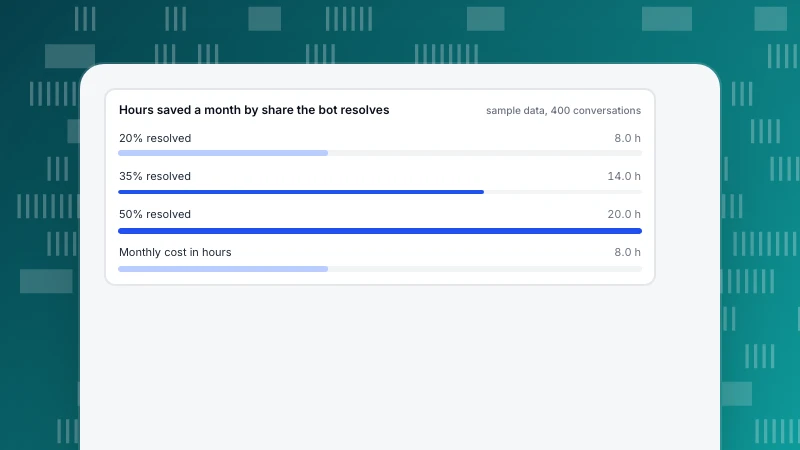
No-code chatbot builders: how a small team should choose and set one up
A no-code chatbot builder fits a small team only if the upkeep fits. Three designs, a time-saved calculation, eight scored criteria, disclosure rules and a six-step setup with a pre-launch test.
Read more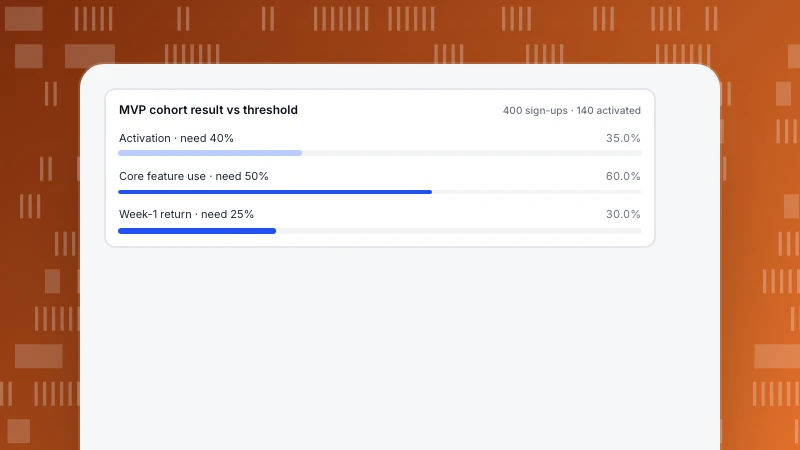
MVP Product Development: A Seven-Step Process With Metrics and a Stop Rule
MVP product development is a loop for learning, not shipping a small product. Seven steps, three metrics with thresholds fixed before launch, a worked 400-user result and a decision table for scale, iterate, pivot or stop.
Read more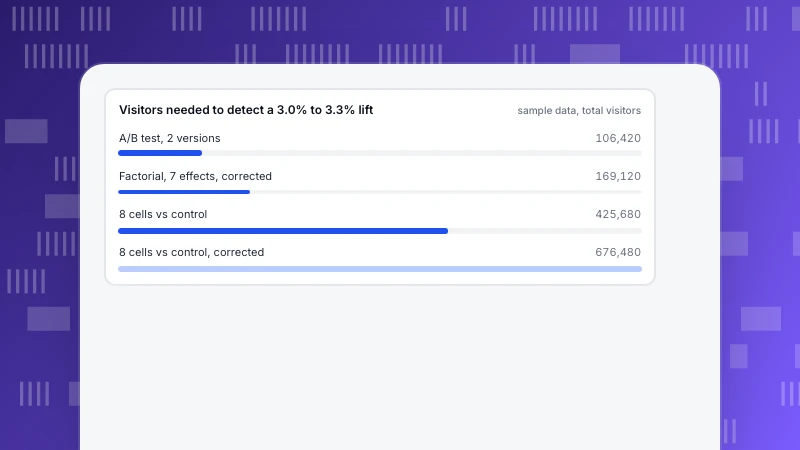
Multivariate testing: the traffic math that decides whether it beats A/B testing
A multivariate test shows every combination of several page elements. Count the combinations, size the sample (53,210 per version in our example) and see when testing effects instead of cells makes it practical.
Read more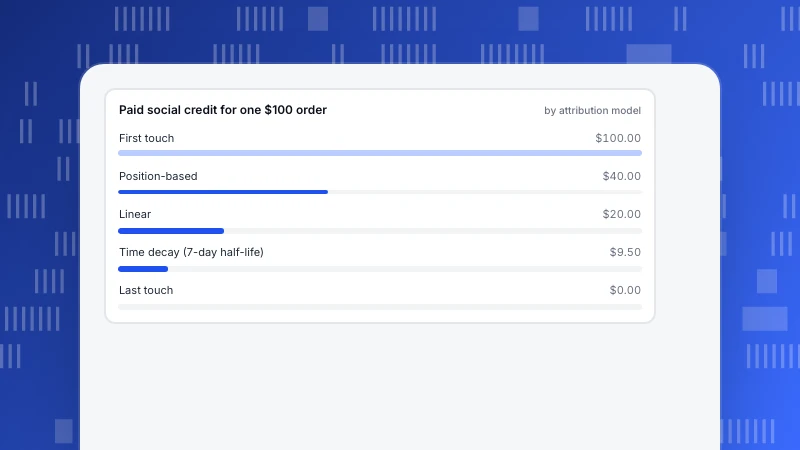
Multi-Touch Attribution Tools: Criteria, Limits and How to Choose
Choosing a multi-touch attribution tool is about criteria, not model theory. See one journey under five models, how the lookback window moves credit, eight questions to ask and a weighted scoring rubric.
Read more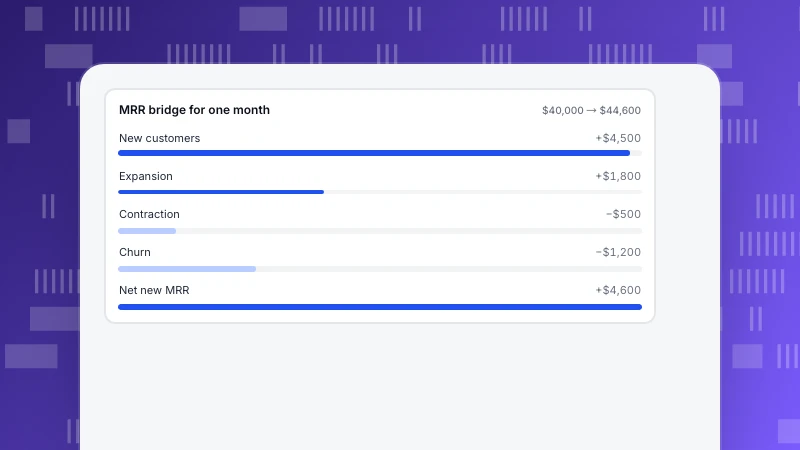
MRR vs ARR: differences, conversion and when to use each
ARR is MRR × 12, but the choice and the conversion are not trivial. An MRR bridge with expansion and churn, a mixed monthly and annual example, why churn cannot be multiplied by 12 and how to audit the number.
Read more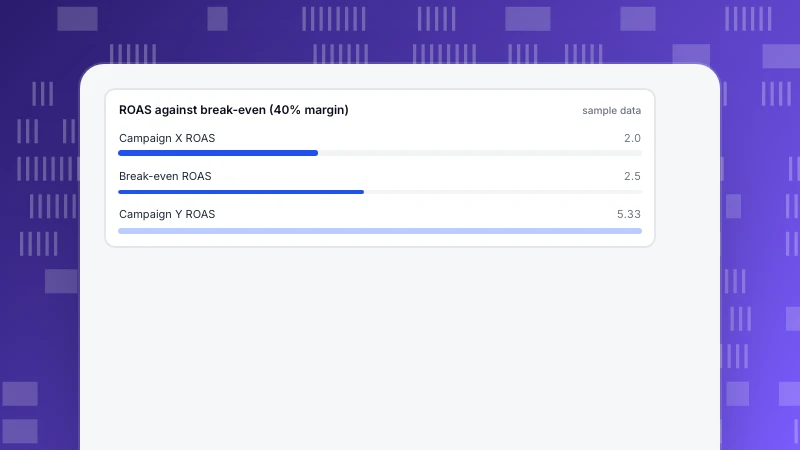
Most important PPC metrics: the path from spend to profit, with break-even math
The PPC metrics that matter sit on one path from spend to profit. One campaign with every number, how to find break-even ROAS, CPA and CPC from margin, and why the campaign with the best CTR can lose money.
Read more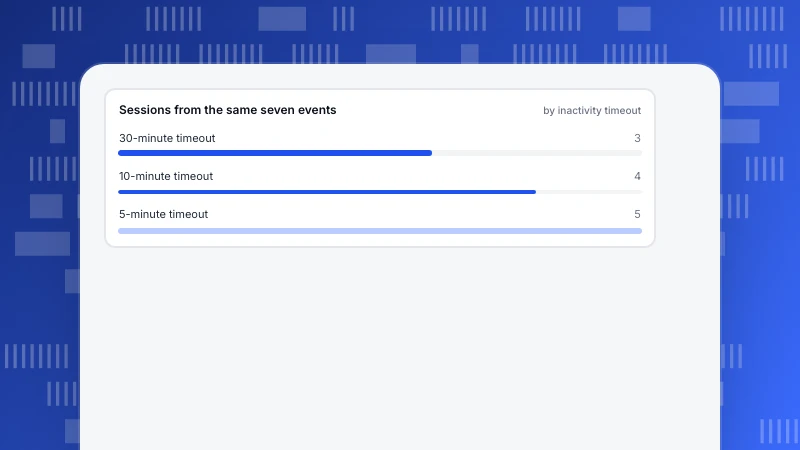
Mobile Web Analytics vs Mobile App Analytics: Identity, Sessions and Metrics
Mobile web analytics and mobile app analytics differ in how they identify people, define sessions, which metrics they have and how fast fixes ship. Side-by-side table, a session example you can recompute and a rule for when you need both.
Read more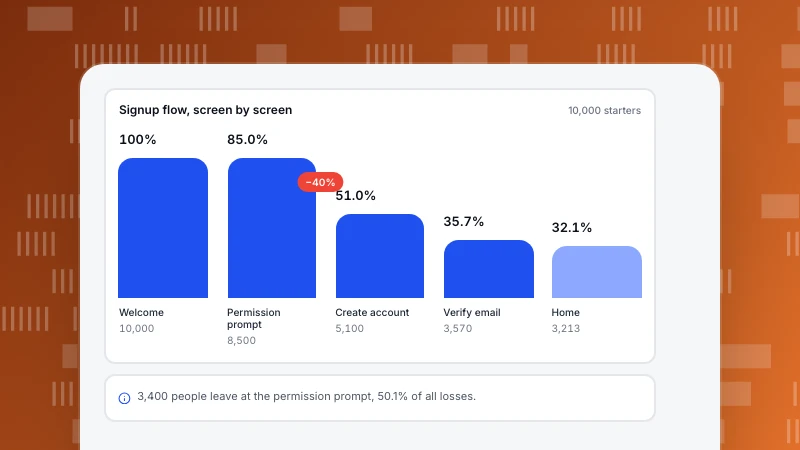
Mobile App UX Design: Principles You Can Check With Usage Data
Six mobile app UX design principles, each paired with the metric that validates it. A signup-flow example with drop-off by screen, a forecast of what a fix is worth, tap-target and stability thresholds, and what native app analytics can and cannot show.
Read more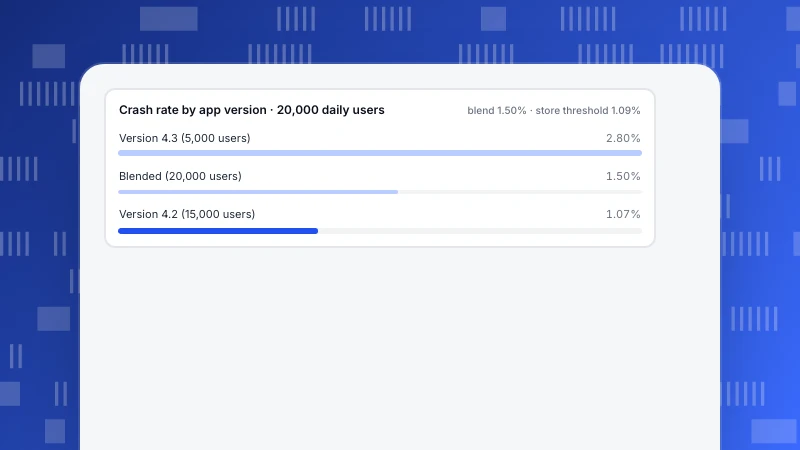
Mobile App Monitoring Tools: Five Categories and What Each One Sees
Mobile app monitoring tools fall into five categories, each seeing a different part of the app. See what each measures, how crash-free rate changes with the denominator, and what store thresholds say.
Read more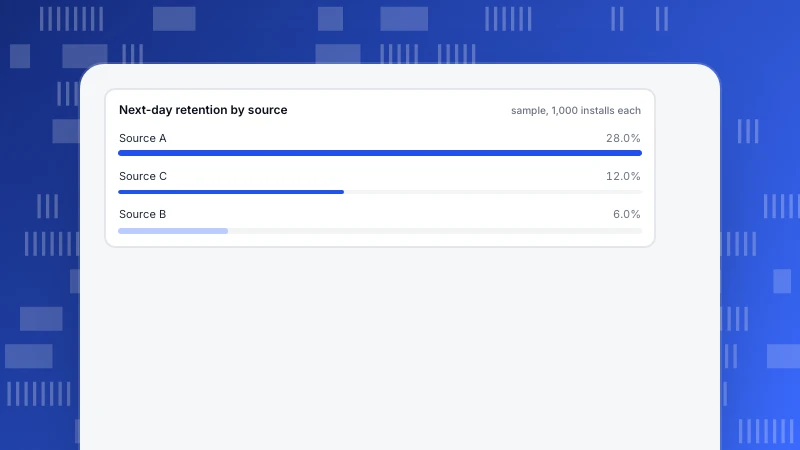
Mobile Ad Fraud: Types, Detection Signals and a Worked Example
Mobile ad fraud shows up as odd click-to-install timing, click volume with no installs and installs that never return. Types, five detection signals and a three-source example where the best-looking rate is the worst traffic.
Read more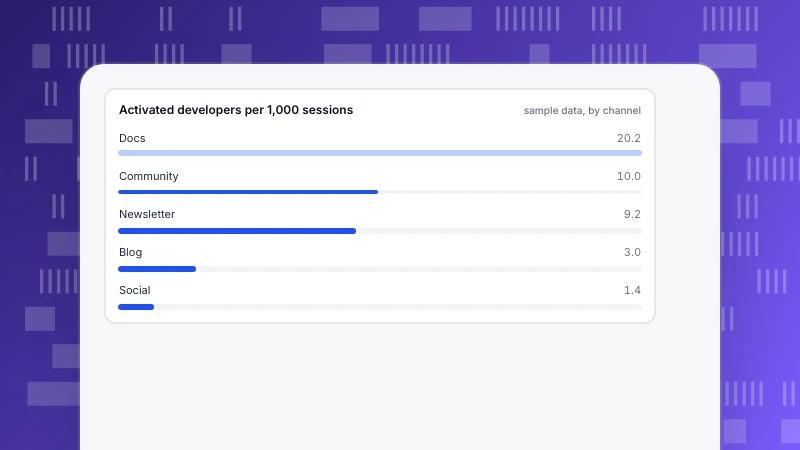
Marketing to developers: docs-led tactics and the metrics that prove them
Five docs-led, trust-first tactics for marketing to developers, with Stack Overflow survey data on where developers learn and a channel table of signup and activation rates.
Read more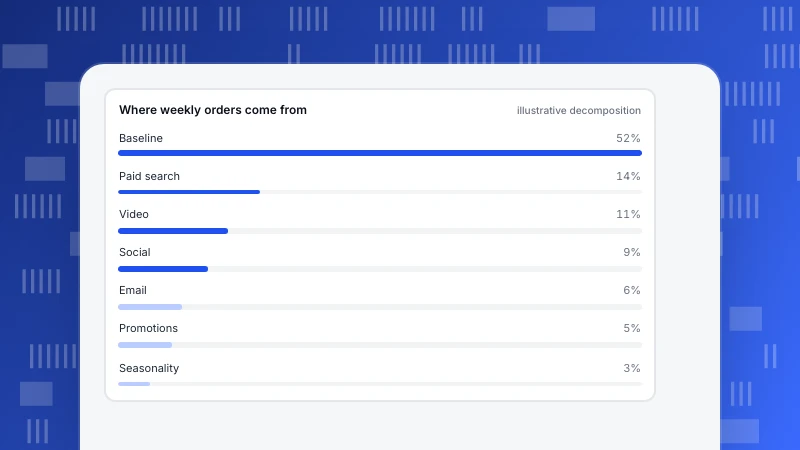
Marketing Mix Modelling: What It Needs and How It Differs From Attribution
Marketing mix modelling estimates each channel's contribution from aggregate weekly data. What data it needs, how adstock and saturation work with numbers, how to read the output and when it beats attribution.
Read more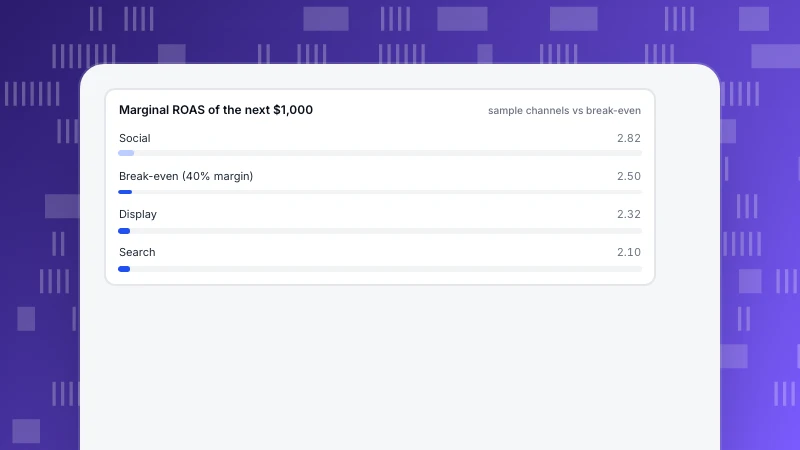
Marketing Budget Optimization: Allocate Spend by Marginal Return
Marketing budget optimization means moving a fixed budget to where the next dollar returns the most. Compare average and marginal ROAS, check against break-even, reallocate in small steps and verify with a holdout.
Read more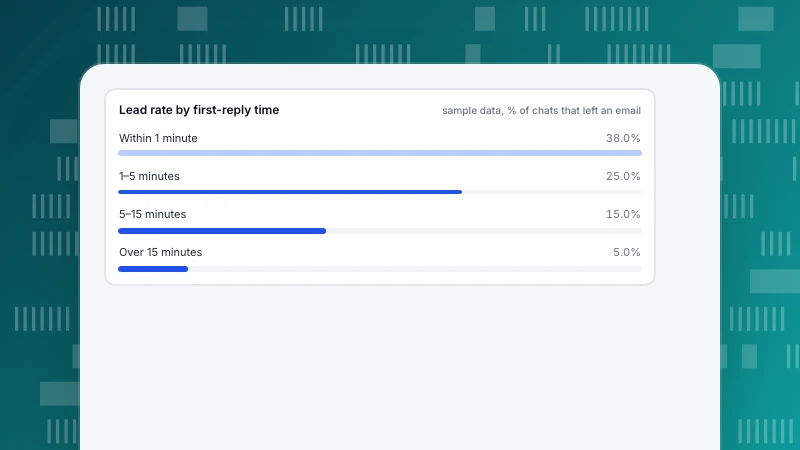
Live chat for sales: which pages to prompt and how fast to reply
How to use live chat for sales: rank pages by leads per 1,000 sessions, set triggers, reply fast, capture emails without a form and measure honestly.
Read moreFive categories, one question each
Each category answers a recurring question we hear from customers. Start with the one closest to your job.
Analytics
Definitions, funnels, retention and the data-quality questions behind every number.
304 articlesGrowth & Marketing
Acquisition, marketing, site and app operations, and how to pick the one stage worth fixing first.
238 articlesLive Chat
Proactive invites, translation and turning support conversations into conversions.
78 articlesAI Search
GPTBot, ClaudeBot, PerplexityBot: who fetches your pages, what the files say and what comes back.
39 articlesProduct News
What shipped, why we built it that way, and how to turn it on.
64 articlesWhat shipped recently
The blog explains the thinking. The changelog lists the releases, with dates and links to the exact report or setting.
- Every release is tagged New, Improved or Fix.
- Entries link to the console view that changed.
- Breaking changes are called out at the top of the entry.
- Aug 13, 2026
AI event inbox
Autocapture now proposes event names and groups duplicates. Review, rename or ignore in one list.
- Jul 2, 2026
Two-way chat translation
Agents write in their language, visitors read theirs. Glossary terms are left untranslated.
- May 14, 2026
Invite rules per page
Proactive invites can target a single URL, a dwell time and a traffic source together.