Try it on your own data
Every report in this article is in the free plan. One snippet for web and apps, up to 10 sites.
Start freeEcommerce product page optimization works when you change elements in order of reach: how many shoppers see them, times how much each change could add, divided by the effort. Measure scroll depth and clicks first. A fix beside the add-to-cart button reaches everyone; a redesigned specifications table far below it reaches about a third of visitors.
What you will learn
- Reach decides the order: the block beside the button is seen by 100% of sessions, the shipping block by 23%
- In the sample, a delivery line beside the button is worth about 42 extra orders a month at effort 1; a specs redesign about 6 at effort 2
- Most attention is near the top: 57% of viewing time was above the fold in NN/g's 2018 study
Why the order of changes matters
A product page has a dozen things you could improve: images, title, price display, reviews, description, size information, delivery details, trust badges, related products, speed. Most guides list them all with equal weight. In practice the first change you make is worth many times the fifth, and the difference comes from two things:
- Reach: how many of your visitors actually see or use the element.
- Effort: how long it takes to ship.
Add a third, assumed lift, and you can rank candidates by orders per unit of effort instead of by opinion. The lift is a guess, which is why you write it down and test it afterwards.
Measure reach first: scroll depth and the first screen
Attention is concentrated near the top. Nielsen Norman Group's 2018 eye-tracking study (over 130,000 eye fixations from 120 participants) found that people spent about 57% of their viewing time above the fold and 43% below, and 74% of the time in the first two screenfuls. The study covered news, e-commerce, blogs and other page types, not only product pages, so treat the 57% as direction.
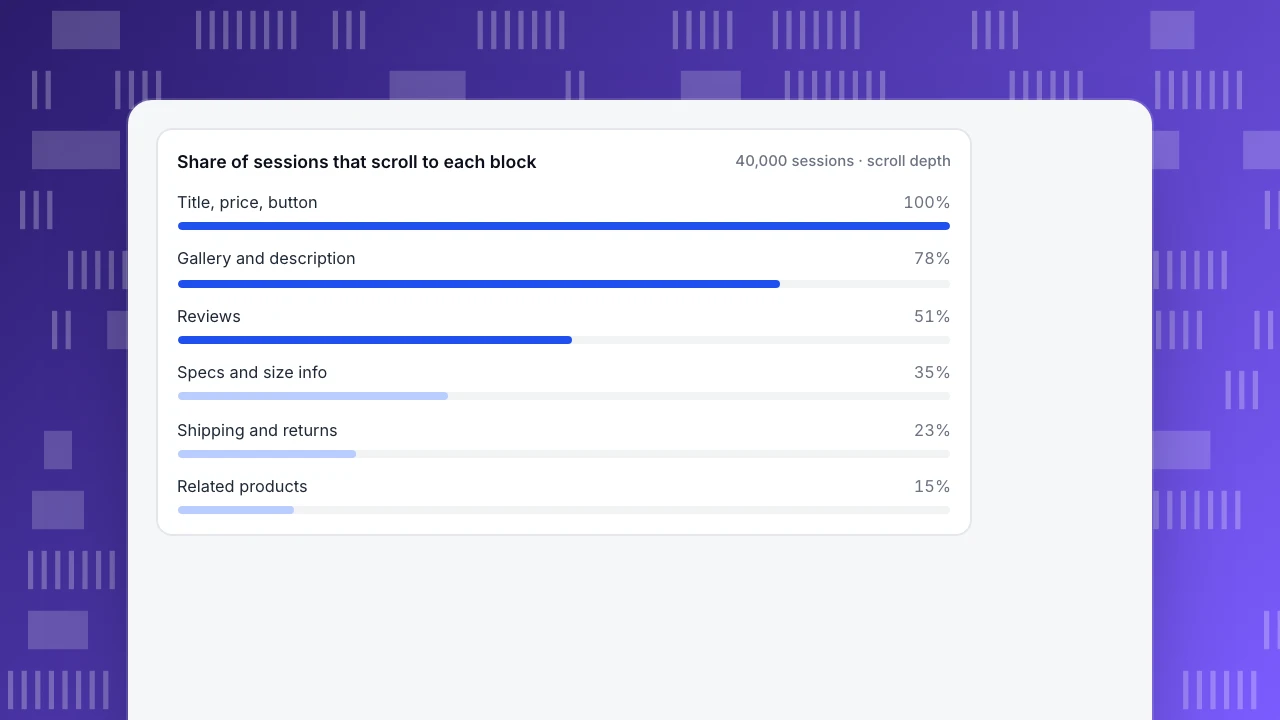
Your own scroll data is better. Sample data for 40,000 monthly sessions on one product page:
| Block | Sessions that reach it | Share |
|---|---|---|
| Title, price, add-to-cart button | 40,000 | 100% |
| Gallery and description | 31,200 | 78% |
| Reviews | 20,400 | 51% |
| Specs and size information | 14,000 | 35% |
| Shipping and returns | 9,200 | 23% |
| Related products | 6,000 | 15% |
The shipping and returns block is where many shoppers look for reassurance, yet 77% of sessions never reach it. That is why a one-line delivery date beside the button is a better first move than rewriting the shipping block itself.
Share of sessions that scroll to each block
40,000 sessions · scroll depthEstimate extra orders for each change
Use this formula for each candidate:
Extra orders = sessions × reach × add-to-cart rate × assumed relative lift × cart-to-order rate
Sample data: 40,000 sessions a month, 6.0% add to cart (2,400 carts) and 35% of carts become orders (840 orders, 2.1% of sessions). Six candidates, each with its reach, an assumed lift and an effort score from 1 (a day) to 3 (a sprint):
| Change | Reach | Lift | Extra orders | Effort | Orders per effort |
|---|---|---|---|---|---|
| Delivery date and returns beside the button | 100% | +5% | 42.0 | 1 | 42.0 |
| Stars and review count beside the title | 100% | +3% | 25.2 | 1 | 25.2 |
| Larger gallery with zoom | 100% | +4% | 33.6 | 3 | 11.2 |
| Mobile LCP from 2.9 s to 2.4 s | 65% | +4% | 21.8 | 2 | 10.9 |
| Size guide inline, not a link | 38% | +6% | 19.2 | 2 | 9.6 |
| Specs table redesign | 35% | +2% | 5.9 | 2 | 2.9 |
Check the first row: 40,000 × 1.00 × 0.06 × 0.05 × 0.35 = 42.0. The order of work is the last column: delivery line, then reviews summary, then the gallery, then speed. The specs table comes last even if a designer would love to do it, because it reaches 35% of sessions and the assumed lift is small.
The lifts are assumptions. If you believe the gallery matters more, raise its lift and see whether it overtakes; the exercise makes the disagreement visible and testable.
| Change | Reach | Assumed lift in add-to-cart | Extra orders / month | Effort (1-3) | Orders per effort |
|---|---|---|---|---|---|
| Delivery date and returns beside the button | 100% | +5% | 42.0 | 1 | 42.0 |
| Stars and review count beside the title | 100% | +3% | 25.2 | 1 | 25.2 |
| Larger gallery with zoom | 100% | +4% | 33.6 | 3 | 11.2 |
| Mobile LCP from 2.9 s to 2.4 s | 65% | +4% | 21.8 | 2 | 10.9 |
| Size guide inline, not a link | 38% | +6% | 19.2 | 2 | 9.6 |
| Specs table redesign | 35% | +2% | 5.9 | 2 | 2.9 |
Sample data: 40,000 sessions a month, 6.0% add to cart, 35% of carts become orders (840 orders, 2.1%). The lifts are assumptions to be tested, not benchmarks.
Speed is an element too
Page speed is not decoration. A Google and Deloitte study published on web.dev monitored 37 leading European and American brand sites over 30 days at the end of 2019, covering more than 30 million user sessions, and found that a 0.1 second improvement in mobile load speed raised retail conversion rates by 8.4%. That is a result for those sites and a 0.1 second step, so do not scale it linearly to your 0.5 second fix; it is a reason to include speed in the ranking.
Google's Core Web Vitals give you the targets, measured at the 75th percentile of page loads: Largest Contentful Paint at 2.5 seconds or less, Interaction to Next Paint at 200 milliseconds or less and Cumulative Layout Shift at 0.1 or less. A product page whose main image arrives at 2.9 seconds on mobile is over the line by 0.4 seconds.
What to fix first
Using the ranking:
- Near the button, answer the questions that stop a purchase: when will it arrive, can I return it, what does it cost in total. One line each.
- Move the evidence up: stars and review count beside the title, with a link to the full reviews.
- Make the product visible: a larger gallery with zoom, once the cheap fixes are shipped.
- Fix the slow hero image on mobile if your Core Web Vitals report shows a failing LCP.
- Bring size and fit information into the page if size-selector clicks are common.
Leave the below-the-fold blocks for later, and use scroll depth to confirm they are worth the work.
Verify the change
Ship one change at a time and compare the same weeks before and after. Add an annotation on the release date. Watch add-to-cart rate for the affected sessions and orders per session. With 40,000 sessions a month, a 5% relative lift in a 6.0% rate is 0.3 points, which a 4-week window can detect only if nothing else moved; check the traffic mix. If you can split traffic with a testing tool, do, and use analytics to read the result; analytics alone cannot split traffic.
Decision rules
- Rank by reach, then effort. Anything under 25% reach needs a large lift to matter.
- Ship one change per release so you can read the result.
- Write the assumed lift before the change, then compare it with what happened.
- Do not copy a benchmark lift; use it only to decide whether the change is worth testing.
- Check mobile and desktop separately. The same change can reach 65% on one and 35% on the other.
- Stop when the next idea's orders per effort falls below your cost of a day.
Mobile and desktop need separate rankings
A blended ranking can hide that the two devices behave differently. Sample data for the same 40,000 sessions:
| Metric | Mobile | Desktop | Blended |
|---|---|---|---|
| Share of sessions | 65% (26,000) | 35% (14,000) | 100% |
| Add-to-cart rate | 4.8% | 8.2% | 6.0% |
| Reach of the shipping and returns block | 15% | 37% | 23% |
Check the blend: 0.65 × 4.8% + 0.35 × 8.2% = 6.0%, and 0.65 × 15% + 0.35 × 37% = 22.7%, about 23%. The blended numbers are correct and misleading. On mobile, the shipping block is reached by 15% of sessions, so the information must sit beside the button. On desktop, 37% reach it and a longer layout can afford to keep it lower.
Size the mobile gap: if mobile reached the blended 6.0% add-to-cart rate, 26,000 sessions would produce 1,560 carts instead of 1,248, which is 312 more carts, or about 109 extra orders at 35% cart-to-order (312 × 0.35 = 109.2). That is larger than any single desktop change in the ranking above. Run the ranking once for each device and compare.
Check before you test
Before spending effort on a redesign, confirm that the basics are in place on the first screen of a phone:
- The product name, price and the add-to-cart button are visible without scrolling.
- The delivery date or an estimated total is visible near the button.
- Stars and review count are visible near the title.
- The main image is the largest element and loads within 2.5 seconds at the 75th percentile (Core Web Vitals LCP).
- Tapping the size selector or variant works first time. Rage clicks on it mean it does not.
- The page has no script errors on the page.
If any of these fails, fix it before running any test. A test of a redesign on top of a slow, broken page measures the break.
Mistakes in product page work
- Testing a button colour first. A tiny change on the element everyone sees can matter, but reach times lift times effort decides, not habit.
- Judging with clicks alone. Clicks show interest, not purchases. Compare add-to-cart rate and orders per session for the sessions that saw the change.
- Ignoring returns of the page. Many shoppers visit a page more than once before buying. Look at people over a week, not only sessions, when the product is a considered purchase.
- Optimising the one hero product. A few pages carry most traffic, but a template change affects every product. Check whether a fix on the top page can be applied to the template.
- Forgetting the out-of-stock path. A page for an unavailable product that offers no alternative loses the visit. Check how often it is reached.
Keep a short log: change, date, affected sessions, assumed lift, result. After five entries you will know how good your lift guesses are, and the ranking becomes sharper.
How to find the highest-reach fix in TapCub
Start from the product page above.
- Open All-platform analytics › Behavior › Heatmaps for the product page. Heatmaps need autocapture on (Pro plan or higher) and, for scroll, the Scroll depth switch enabled. Pick a device and read the Scroll reach tab: it shows the share of visitors reaching each depth, which gives you the reach column.
- Switch to the Clicks, Rage clicks and Elements tabs to see which elements draw clicks and where people click repeatedly, for example a size selector that does not respond.
- If a click pattern does not make sense, open All-platform analytics › Behavior › Session replay. It is off by default; turn it on for the project and look at a handful of sessions on that page.
- Open Monitoring › Performance to see Core Web Vitals from real visitors, and Monitoring › Errors for script errors on the product page.
- Add an annotation in Configuration › Annotations on the release date, then compare the same weeks in Web analytics › Pages.
TapCub does not run A/B tests or split traffic. Use a testing tool for that, and TapCub to measure add-to-cart, orders and the behaviour behind them.
FAQ
What should I optimize first on a product page?
The block that every shopper sees and that answers a question stopping a purchase: price, delivery date, returns and the add-to-cart button area. Then reviews near the title and the product images.
How do I find out which elements shoppers ignore?
Use scroll-depth and click heatmaps for the page. Blocks that fewer than a third of sessions reach, or that draw almost no clicks, are candidates for moving up or removing.
Does page speed affect product page conversion?
Yes. In a study of 37 brand sites and over 30 million sessions, a 0.1 second faster mobile load raised retail conversion by 8.4%. Check your own Core Web Vitals before relying on a figure from other sites.
How many product images do I need?
There is no single number. Look at your gallery data: if most sessions open the gallery and add to cart at a higher rate afterwards, invest in images; if few interact, fix what is above them first.
How do I know a change worked?
Compare the same weeks before and after with one change per release and an annotation on the date. Judge add-to-cart rate for affected sessions, and check the traffic mix first.
Sources
Was this article helpful?
We use your answers to fix and expand this page.
Couldn’t send. Please try again in a minute.
Thanks for the feedback. We’ll use it to improve this page.You’ve already sent feedback on this page. Thanks.

Product Experience Specialist
Explores usability, user journeys, and feature adoption through practical examples of onboarding and everyday product use.