Try it on your own data
Every report in this article is in the free plan. One snippet for web and apps, up to 10 sites.
Start freeEcommerce CRO increases the share of store visitors who buy, and how much they buy, without buying more traffic. This guide walks the store funnel from product page to payment, shows how to rank leaks in money terms, and works through a fashion store where showing delivery cost and date earlier lifted checkout completion from 48% to 55%.
What you will learn
- Track every funnel step including payment success
- Segment by device, channel and customer type
- Rank leaks by drop-off × average order value
- Show total cost and delivery date before checkout
- Judge tests by revenue per visitor and refunds
What is ecommerce CRO?
Ecommerce CRO (ecommerce conversion rate optimization) is the process of increasing the share of store visitors who buy, and how much they buy, without paying for more traffic. It works on the whole purchase path: product discovery, product pages, cart, checkout and payment, using behavioral data to find where shoppers drop out and testing changes that remove the reason.
The basic metric is the ecommerce conversion rate: orders ÷ sessions (or ÷ visitors) × 100. But CRO for a store also watches average order value, cart abandonment and revenue per visitor, because a change that adds orders while cutting basket size can lose money.
The ecommerce conversion funnel
| Stage | Typical metric | Common leaks |
|---|---|---|
| Landing / category | Share of sessions that view a product | Irrelevant traffic, weak search and filters |
| Product page | Add-to-cart rate | Missing information, poor photos, unclear delivery and returns |
| Cart | Cart-to-checkout rate | Surprise costs, forced account creation, distracting coupon field |
| Checkout | Checkout completion rate | Long forms, validation errors, slow pages |
| Payment | Payment success rate | Declined cards, missing local payment methods, 3-D Secure friction |
Baymard Institute's long-running research puts the average documented online cart abandonment rate at about 70%, and lists extra costs (shipping, tax, fees) as the most common reason shoppers abandon during checkout.
| Metric | Formula |
|---|---|
| Conversion rate | Orders ÷ sessions × 100 |
| Average order value | Revenue ÷ orders |
| Revenue per visitor | Revenue ÷ visitors |
| Cart abandonment | 1 − orders ÷ carts created |
| Checkout completion | Orders ÷ checkouts started |
A change that lifts conversion but lowers order value can lose revenue.
How to do ecommerce CRO in seven steps
1. Track the full funnel correctly
You need product views, add-to-cart, checkout started, each checkout step, payment success and refunds, with revenue and product properties. Reconcile orders with your store backend for a week before trusting the funnel.
2. Segment before you optimize
Split the funnel by device, traffic source, new versus returning customers and country. Mobile shoppers often add to cart at similar rates but complete checkout much less, which points to a mobile checkout problem, not a product problem.
3. Find the biggest leak in money terms
Multiply each step's drop-off by the average order value. A 5-point drop on payment can be worth more than a 10-point drop on product views.
4. Diagnose with qualitative evidence
Watch session replays of abandoned checkouts, read heatmaps of product pages, and read chat conversations from shoppers on cart and checkout pages. Shoppers often say exactly what is missing: delivery dates, sizes, return rules.
5. Prioritize fixes
Common high-impact changes for stores:
- Show total cost (delivery, taxes) on the product page or cart, not only at payment.
- Offer guest checkout and autofill-friendly forms.
- Add the payment methods your customers use in each country.
- Put delivery date, returns and stock status next to the add-to-cart button.
- Improve product search and filters for large catalogs.
- Keep product and checkout pages fast on mobile.
6. Test and measure revenue, not just conversion
Use A/B tests where traffic allows. Judge results on revenue per visitor and average order value as well as conversion rate.
7. Watch post-purchase
Refund rate and repeat purchase rate show whether CRO brought the right customers. A promotion that lifts conversion but doubles refunds is not a win.
Worked example: a fashion store
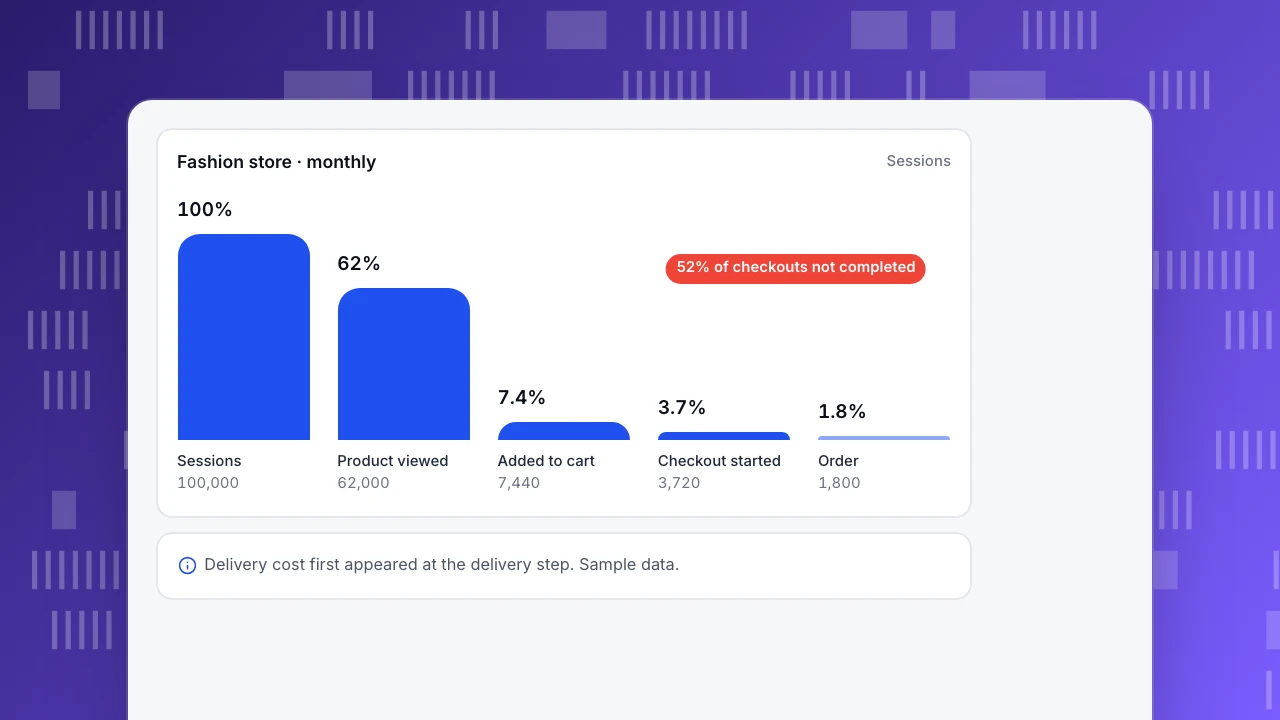
A fashion store (sample data) has 100,000 sessions a month, a 1.8% conversion rate and a €68 average order value: 1,800 orders and €122,400 revenue.
| Funnel step | Sessions | Step rate |
|---|---|---|
| Viewed a product | 62,000 | 62% |
| Added to cart | 7,440 | 12% of product viewers |
| Started checkout | 3,720 | 50% of carts |
| Completed order | 1,800 | 48% of checkouts |
Replays and chat logs showed shoppers asking "when will it arrive?" and leaving at the delivery step, where delivery cost (€5.90) first appeared. The store added an estimated delivery date and the delivery cost to product pages and the cart. Checkout completion rose from 48% to 55%: about 2,050 orders a month, or €17,000 more revenue at the same average order value, with no change in refund rate.
Fashion store · monthly
SessionsSessions
100,000
Product viewed
62,000
Added to cart
7,440
Checkout started
3,720
Order
1,800
Common mistakes
- Optimizing conversion rate alone. Discounts raise conversion and can lower margin; watch revenue per visitor.
- Treating all traffic as one. Paid social, search and email shoppers convert at very different rates.
- Testing button colors before fixing costs and errors. Fix the leaks shoppers tell you about first.
- Forgetting payment failures. Declined payments look like abandonment unless you track them separately.
- Ignoring returns. Some conversion gains come back as refunds.
Ecommerce CRO in TapCub
- Commerce reports: All-platform analytics › Business › Commerce & revenue shows revenue, orders, buyers, average order, paying rate, repeat rate, refunds, and cart abandon rate (sessions with add-to-cart and no purchase) with the value left behind. Set it up with track ecommerce purchases.
- Funnels: build a product → cart → checkout → order funnel and split it by device and channel.
- Behavior: heatmaps on product pages, rage clicks, JavaScript errors and session replay of abandoned checkouts.
- Chat: proactive chat on cart and checkout pages, and conversations linked to the shopper's pages.
TapCub does not run A/B tests; annotate test dates and compare results in your reports. Related reading: ecommerce conversion rate, cart abandonment rate, ecommerce KPIs.
FAQ
What is a good ecommerce conversion rate? It varies widely by category, price and traffic mix. Many stores sit between 1% and 3% of sessions. Compare yourself with your own history by channel and device rather than a single benchmark.
What should I optimize first in an online store? The checkout and the information shoppers need before it: total cost, delivery date, returns and payment methods. These usually have the largest money impact.
How is ecommerce CRO different from general CRO? It deals with product catalogs, carts, payments and returns, and measures revenue and order value as well as conversion rate.
Do I need A/B testing for ecommerce CRO? For design and copy changes on busy pages, yes. Bug fixes, missing information and payment issues can be fixed directly and checked with before/after data.
Sources
- Baymard Institute. Cart abandonment rate statistics.
- Baymard Institute. Checkout usability research.
- Google. Measure ecommerce (GA4 developer guide).
Was this article helpful?
We use your answers to fix and expand this page.
Couldn’t send. Please try again in a minute.
Thanks for the feedback. We’ll use it to improve this page.You’ve already sent feedback on this page. Thanks.

Product Experience Specialist
Explores usability, user journeys, and feature adoption through practical examples of onboarding and everyday product use.