Try it on your own data
Every report in this article is in the free plan. One snippet for web and apps, up to 10 sites.
Start freeAn ecommerce funnel measures the steps from arriving at a store to buying, and buying again. This guide lists each stage with its metric and formula, shows how step rates multiply into conversion rate, how to build and segment the funnel, and an example where splitting by device revealed a mobile checkout bug worth about €47,000 a month.
What you will learn
- Measure every step from product view to purchase
- Step rates multiply into overall conversion
- Segment by device, channel and customer type
- Rank leaks by money lost, not percentage
- Track payment failures and repeat purchases
What is an ecommerce funnel?
An ecommerce funnel is the sequence of steps shoppers go through from arriving at an online store to buying, and, in a fuller version, buying again. Measuring it step by step shows where shoppers drop out, which tells you whether to work on traffic, product pages, the cart, checkout or retention.
A typical store funnel has five steps: visit → product view → add to cart → checkout → purchase. Some stores add repeat purchase as a sixth step, because for many categories most profit comes from returning customers.
Ecommerce funnel stages and metrics
| Stage | Shopper's question | Key metric | Formula |
|---|---|---|---|
| Visit | Is this store relevant? | Product view rate | Sessions with a product view ÷ sessions |
| Product view | Is this the right product at the right price? | Add-to-cart rate | Sessions with add to cart ÷ sessions with a product view |
| Cart | Do I still want it at the total cost? | Cart-to-checkout rate | Checkouts started ÷ sessions with add to cart |
| Checkout | Can I pay easily and safely? | Checkout completion rate | Orders ÷ checkouts started |
| Purchase | — | Conversion rate, AOV | Orders ÷ sessions; revenue ÷ orders |
| Repeat | Will I come back? | Repeat purchase rate | Customers with 2+ orders ÷ customers |
Multiplying the step rates gives the overall conversion rate. A store with 60% product view, 10% add-to-cart, 50% cart-to-checkout and 50% checkout completion converts 0.6 × 0.10 × 0.5 × 0.5 = 1.5% of sessions.
| Funnel type | Use it for |
|---|---|
| Session-based | Quick purchases, checkout problems |
| People-based, multi-day | Considered purchases, browse-now-buy-later |
| With repeat purchase | Retention and lifetime value |
Keep the choice consistent across reports.
How to build and analyze an ecommerce funnel
1. Track the events
Product viewed, added to cart, checkout started, each checkout step (shipping, payment), order completed with revenue, and refunds. Use the same product and order IDs your store uses so numbers reconcile.
2. Choose sessions or people
Session-based funnels show what happens in one visit; people-based funnels over several days capture shoppers who browse today and buy next week. High-consideration products usually need a people-based funnel with a longer window.
3. Segment
Split the funnel by device, traffic source, new vs returning customers, country and product category. Averages hide the problem: a funnel can look fine overall while mobile checkout is broken.
4. Find the step with the largest money loss
Multiply each step's drop-off by the average order value and the downstream conversion rate. Focus on the largest number, not the largest percentage.
5. Diagnose and fix
Use heatmaps on product pages, session replays of cart and checkout abandoners, error reports and chat questions to find causes, then fix or test changes.
Worked example: where to focus
An online home goods store (sample data), monthly, average order value €82:
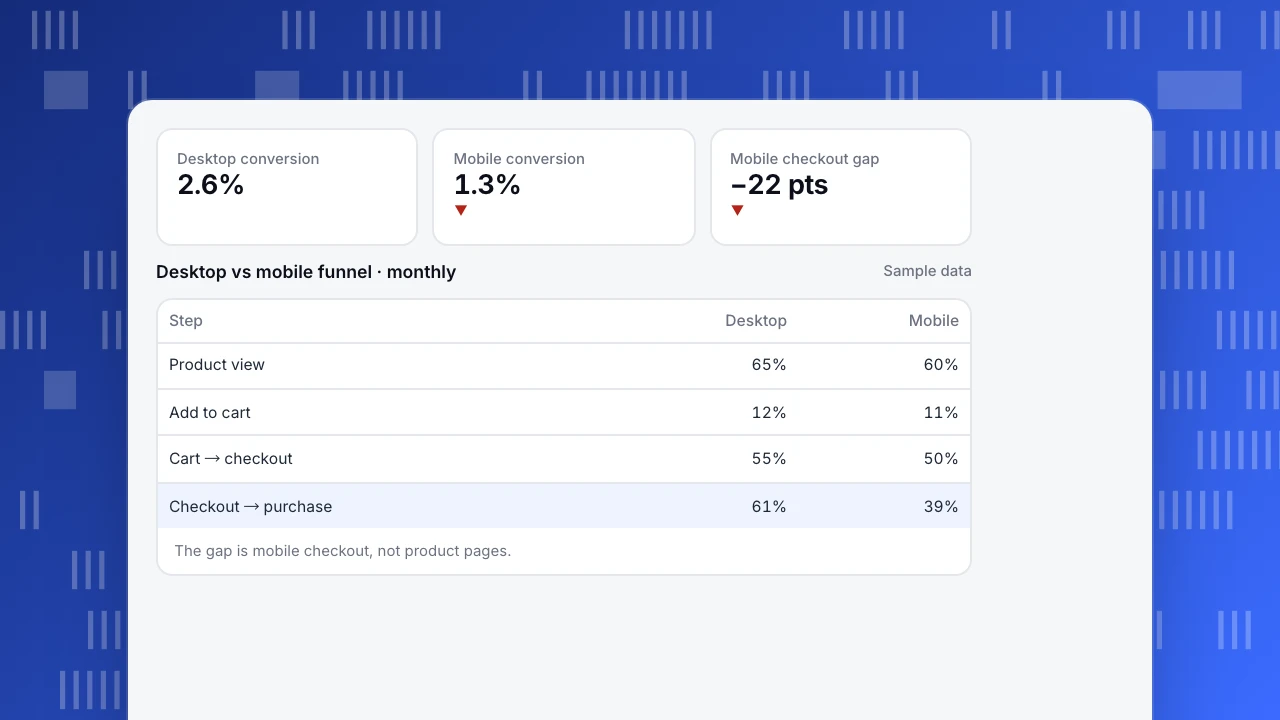
| Step | Desktop | Mobile |
|---|---|---|
| Sessions | 40,000 | 80,000 |
| Product view | 26,000 (65%) | 48,000 (60%) |
| Add to cart | 3,120 (12%) | 5,280 (11%) |
| Checkout started | 1,720 (55%) | 2,640 (50%) |
| Purchase | 1,050 (61%) | 1,030 (39%) |
| Conversion rate | 2.6% | 1.3% |
Product view and add-to-cart rates are similar across devices; the gap is mobile checkout (39% vs 61%). If mobile checkout matched desktop, mobile orders would rise from 1,030 to about 1,610: around €47,000 more revenue a month. Replays showed the mobile payment step reloading and clearing the card form when users switched apps to get a one-time code. That bug, not product pages, was the priority.
Desktop conversion
2.6%
Mobile conversion
1.3%
▼
Mobile checkout gap
−22 pts
▼
Desktop vs mobile funnel · monthly
Sample data| Step | Desktop | Mobile |
|---|---|---|
| Product view | 65% | 60% |
| Add to cart | 12% | 11% |
| Cart → checkout | 55% | 50% |
| Checkout → purchase | 61% | 39% |
The gap is mobile checkout, not product pages.
Common mistakes
- Only looking at overall conversion rate. It does not tell you which step to fix.
- Mixing sessions and people. Pick one and keep it consistent across reports.
- Too short a window. Considered purchases happen over days; session funnels undercount them.
- Not tracking payment failures. They look like abandonment.
- Ignoring repeat purchase. Acquisition-only funnels miss where profit comes from.
Ecommerce funnels in TapCub
- Funnels: build a product view → add to cart → checkout → purchase funnel by session or person, with a time window, and split it by device, channel or country. See build a funnel.
- Commerce & revenue: revenue, orders, average order, paying rate, repeat rate, refunds and cart abandon rate with the value left behind. Set up ecommerce purchase tracking.
- Diagnosis: heatmaps, rage clicks, JavaScript errors, session replay and chat conversations from cart and checkout pages.
Related: ecommerce CRO, purchase path, cart abandonment rate, ecommerce KPIs.
FAQ
What are the stages of an ecommerce funnel? Visit, product view, add to cart, checkout and purchase, often followed by repeat purchase.
What is a good add-to-cart rate? It varies by category and traffic; many stores see single-digit to low double-digit percentages of product-viewing sessions. Track your own trend by device and channel.
How is an ecommerce funnel different from a marketing funnel? A marketing funnel describes awareness to purchase across channels. An ecommerce funnel measures concrete on-site steps with event data.
Should I use session-based or user-based funnels? Session-based for quick purchases and checkout problems; user-based with a multi-day window for considered purchases.
Sources
- Google. Measure ecommerce (GA4 developer guide).
- Baymard Institute. Cart abandonment rate statistics.
Was this article helpful?
We use your answers to fix and expand this page.
Couldn’t send. Please try again in a minute.
Thanks for the feedback. We’ll use it to improve this page.You’ve already sent feedback on this page. Thanks.

Data Engineer
Writes about event design, data quality, and collection workflows, with verifiable implementation methods for reliable analytics.