Try it on your own data
Every report in this article is in the free plan. One snippet for web and apps, up to 10 sites.
Start freeThe purchase path, or path to purchase, is the sequence of steps a shopper takes from first noticing a product to completing an order. Online, most of it can be measured: product views, add to cart, checkout and purchase each leave an event. This guide explains the stages, how to measure them, and how to find and fix the step that loses the most shoppers.
What you will learn
- Split the path into stages you can measure: view item, add to cart, checkout, purchase
- Measure it per session first, then across visits for products people research
- Send the purchase from your server with an order ID so revenue is reliable
What a purchase path is
A purchase path is the route from first interest to a paid order. Shopper marketing often describes it as awareness, consideration, intent and purchase. Online, each of these stages has a measurable action, which turns the path into a funnel you can read.
Paths vary by product. A phone case is often bought in one session. A sofa might take five visits over three weeks. Measure both the single-session path and the multi-visit one.
Stages and the events behind them
The table lists each stage and the event that measures it. Two rules make the data reliable:
- Keep cart and checkout as behaviour events. They feed the funnel.
- Send the purchase from your server on payment success, with an order ID, amount and currency, so revenue does not depend on the browser.
In TapCub, the purchase funnel in commerce is per session: view item, add to cart, checkout, purchase. The event names are editable in business settings.
| Stage | What the shopper does | Event to measure it |
|---|---|---|
| Discover | Sees an ad, a search result or a post | Landing page and source |
| Consider | Views products and compares | view_item |
| Intent | Adds to cart | add_to_cart |
| Checkout | Enters shipping and payment | begin_checkout |
| Purchase | Pays | purchase, with order ID, amount and currency |
Event names are examples; use the ones your business settings expect.
Measure the path
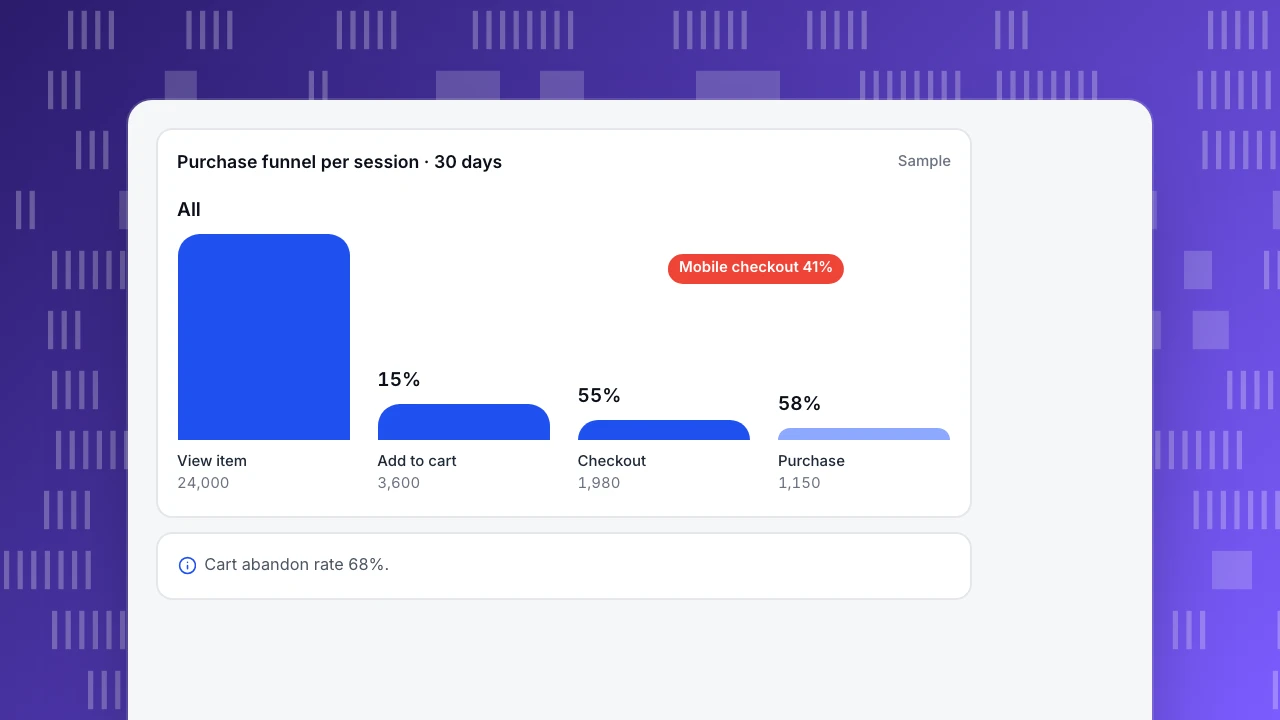
The sample funnel shows 24,000 sessions with a product view, 15% of them adding to cart, 55% of those starting checkout and 58% of checkouts ending in a purchase.
Split each step by device and source. In the sample, desktop checkouts convert at 71% while mobile converts at 41%. That one gap is worth more than any change at the top of the funnel.
Purchase funnel per session · 30 days
SampleView item
24,000
Add to cart
3,600
Checkout
1,980
Purchase
1,150
Cart abandonment
Cart abandonment rate is the share of sessions with an add-to-cart and no purchase. In the sample it is 68%. TapCub also shows the value left behind in those carts, which helps you size the problem in money rather than percentages.
Paths across visits
For considered purchases, look beyond one session:
- Visits to purchase: how many sessions buyers had before the order.
- Days to purchase: from first visit to order.
- Sources along the way: the first visit often comes from search or social, the last from direct or email. See conversion paths.
Fixing the biggest leak
In the sample, mobile checkout loses most shoppers. A short check finds the payment form needs zooming on small screens and the shipping cost appears only at the last step. The team shows shipping on the cart page and fixes the form layout, then compares the next two weeks.
Common fixes by step:
- View to cart: clear price, stock and delivery time on the product page.
- Cart to checkout: total cost up front, guest checkout.
- Checkout to purchase: fewer fields, familiar payment options, error messages that say what to fix.
FAQ
What is the path to purchase?
The steps a shopper takes from first noticing a product to buying it, usually grouped as awareness, consideration, intent and purchase.
How is a purchase path different from a funnel?
The path is the shopper's journey; the funnel is how you measure it, as counts at each step.
Why does revenue not match my cart numbers?
Cart events are behaviour; revenue counts only completed purchases. A cart with no purchase adds to abandonment, not revenue.
See also: Ecommerce funnel.
Was this article helpful?
We use your answers to fix and expand this page.
Couldn’t send. Please try again in a minute.
Thanks for the feedback. We’ll use it to improve this page.You’ve already sent feedback on this page. Thanks.

Data Engineer
Writes about event design, data quality, and collection workflows, with verifiable implementation methods for reliable analytics.