Try it on your own data
Every report in this article is in the free plan. One snippet for web and apps, up to 10 sites.
Start freeFunnel steps multiply, so the same relative lift on any step adds the same share to the end result. This guide explains how that changes which step to optimise, sets out a six-step loop from measurement to test, and works through a SaaS sign-up funnel.
What you will learn
- A 10% lift on any step adds about 10% at the end, because steps multiply
- Pick the step that is cheapest and most likely to move, not just the biggest drop
- Split by device and source before diagnosing; test one change at a time
The arithmetic most guides skip
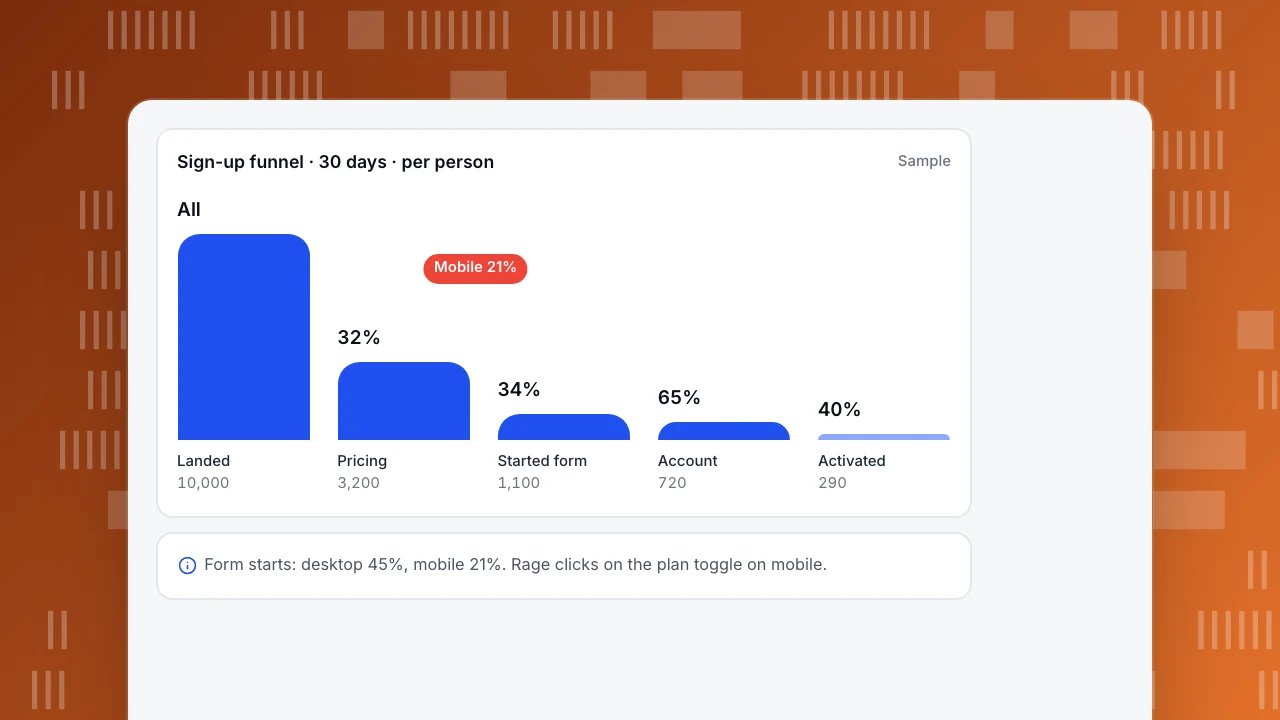
A conversion funnel is a chain of steps, and the end result is the product of the step rates. In the sample sign-up funnel, 32% of visitors reach pricing, 34% of those start the form, 65% of those create an account and 40% of new accounts activate:
10,000 visitors → 3,200 → 1,100 → 720 → 290 activated accounts (2.9%). The end rate is the step rates multiplied together (rounded here).
Because the steps multiply, a 10% relative improvement on any one step adds 10% to the end: 290 becomes about 319, whichever step you improve. Raising pricing visits from 32% to 35.2% has exactly the same effect as raising activation from 40% to 44%.
That changes the usual advice. "Fix the biggest drop" sounds right, but the biggest drop is not automatically the best place to work. Pick the step where a lift is cheapest and most likely: a confusing form you can shorten this week beats a homepage redesign that might, in a quarter, move a big number by a little.
The optimisation loop
The table lays out six steps. Teams that improve funnels steadily run this loop every few weeks on one funnel, rather than trying everything at once.
| Step | What to do | Tools |
|---|---|---|
| 1. Measure | Define steps as events, count people, set a window | Funnel report |
| 2. Pick | Choose the step where a lift is cheapest and most likely | Step rates, people lost, effort estimate |
| 3. Split | Break that step down by device, source, new vs returning | Funnel breakdown, segments |
| 4. Diagnose | Watch what happens where people leave | Heatmaps, rage clicks, session replay, form errors |
| 5. Test | Change one thing, split traffic, plan the sample size | A/B test or holdout |
| 6. Re-measure | Read the end of the funnel, not only the step | Funnel report, goals |
Run the loop on one funnel every few weeks.
A worked example: a SaaS sign-up funnel
Measure. The funnel above, over 30 days, counted per person with a seven-day window.
Pick. The largest losses in people are at the top (6,800 never reach pricing) and between pricing and the form (2,100). But the form step has the clearest diagnosis available, so the team starts there.
Split. Broken down by device, desktop visitors on pricing start the form at 45%; mobile visitors at 21%. Mobile is where the step is weak.
Diagnose. The pricing-page heatmap on mobile shows many taps on the plan comparison table and rage clicks on a "Compare plans" toggle that does not respond on small screens. Session replays show visitors scrolling sideways through the table and leaving.
Test. A mobile pricing page with stacked plan cards and one "Start free" button per plan, split 50/50 against the current page.
Re-measure. If mobile form starts reach 30%, the overall step rate rises from 34% to roughly 38%, about a 12% relative lift on that step, which carries through to about 12% more activated accounts with no extra traffic. Then the loop starts again on the next step.
Sign-up funnel · 30 days · per person
SampleLanded
10,000
Pricing
3,200
Started form
1,100
Account
720
Activated
290
What usually moves each kind of step
- Arrival to interest (landing to pricing or product): match the page to the ad or query, make the next step obvious, speed on mobile.
- Interest to start (pricing to form): fewer choices, clear plan differences, a visible free option, trust signals near the button.
- Start to complete (form to account): fewer fields, social sign-in, inline error messages, no surprise requirements.
- Complete to value (account to activation): a short path to the first useful result, sample data, and a checklist. See onboarding metrics.
Common mistakes
- Optimising a funnel with broken steps. If a step event fires twice or not at all on one template, fix the tracking first.
- Using sessions for a multi-day funnel. Sign-up and activation often happen on different days. Count people, with a window that fits.
- Changing several things at once. You will not know which one worked, or which one hurt.
- Stopping at the step you improved. A higher form-start rate that brings worse sign-ups is not a win; always read the end of the funnel.
FAQ
What is conversion funnel optimization?
The repeated process of measuring each step of a funnel, finding the step where a change is most likely to raise conversions, diagnosing why people leave there, testing a fix and measuring the result.
Which funnel step should I optimise first?
Because steps multiply, the same relative lift on any step has the same effect on the end. Start where a lift is cheapest and most likely: usually the step with the clearest, most fixable problem, often on one device or source.
How many steps should a funnel have?
Three to six. Enough to locate the drop, few enough that each step has meaningful volume. Add detail with a separate funnel for a single step, such as the form.
What tools do I need for funnel optimisation?
A funnel report that counts people over a window and can break down by device and source, plus heatmaps and session replay to see why people leave, and a way to split traffic for tests.
Related: marketing funnel and landing page conversion rate.
See also: CRO audit, Website optimization.
Was this article helpful?
We use your answers to fix and expand this page.
Couldn’t send. Please try again in a minute.
Thanks for the feedback. We’ll use it to improve this page.You’ve already sent feedback on this page. Thanks.

Product Adoption Consultant
Explores customer onboarding, live conversations, and self-service, turning common usage questions into practical guidance and improvements.