Try it on your own data
Every report in this article is in the free plan. One snippet for web and apps, up to 10 sites.
Start freeLanding page conversion rate is the share of visitors to a landing page who complete its goal. This guide gives the formula, explains why builder averages make poor targets, shows one page converting at 22%, 12% and 4% by source, and lists what usually moves the rate most.
What you will learn
- Count one goal, landing visitors only, per distinct visitor
- Every traffic source has its own rate; the average depends on the mix
- Fix traffic-to-page match first, then the page, then test one change at a time
The formula
Landing page conversion rate = visitors who completed the page's goal ÷ visitors who landed on the page × 100.
Three choices make the number meaningful:
- One goal per page. A webinar page converts on registration, a lead page on the form, a sale page on checkout start. Count that one action.
- Landing visitors only. Count people whose session started on the page, not everyone who passed through it.
- Per visitor, usually. A person registers once, so divide by distinct visitors. If you divide by sessions, say so.
In TapCub, a goal's conversion rate is distinct people who completed it divided by distinct visitors, and the goal report breaks it down by entry page and by source, so filtering to the landing page gives this number directly.
What is a good landing page conversion rate?
Landing-page builders publish averages from their customers, often somewhere in the mid single digits across all industries. Those numbers mix sign-ups with sales, cold traffic with warm, and pages that ask for an email with pages that ask for a credit card, so they are a weak target.
A better test: compare the page with itself by source, and with your other landing pages for the same kind of offer. The example below shows why.
A worked example: one page, three rates
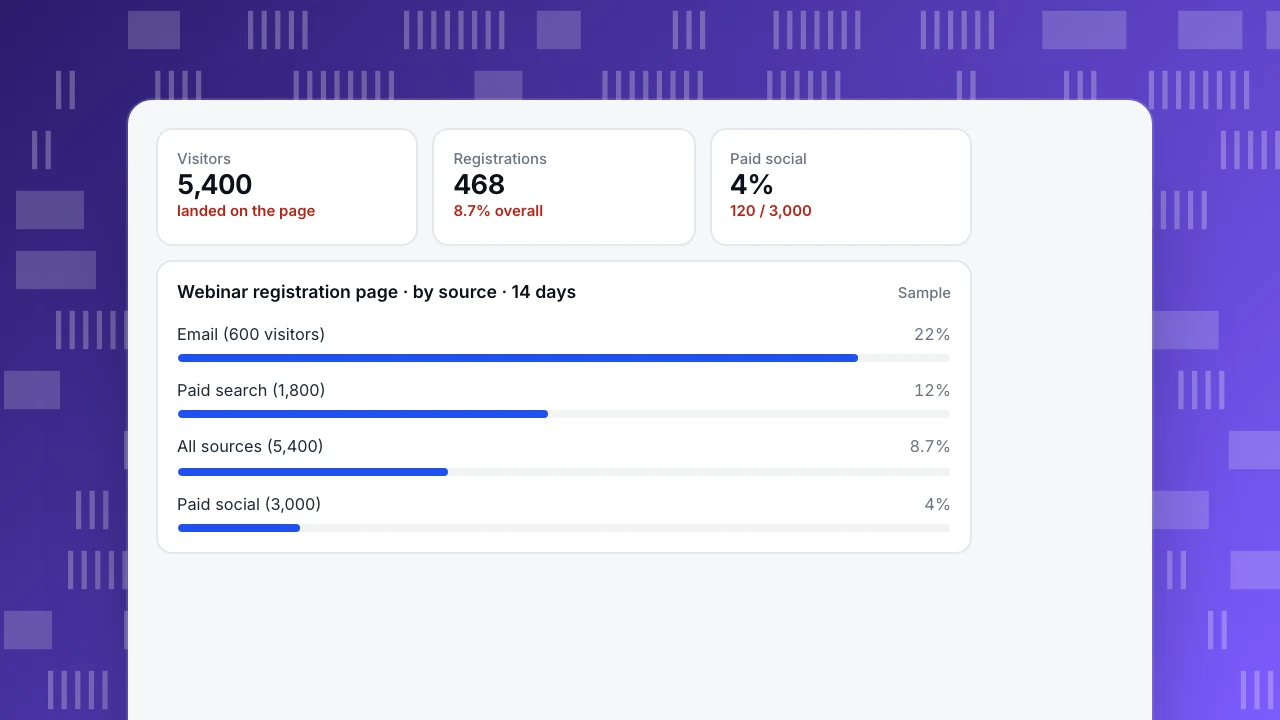
A webinar registration page gets 5,400 visitors in two weeks and 468 registrations: 8.7%. By source:
- Email to existing subscribers: 600 visitors, 132 registrations, 22%. They know the brand and asked for this kind of content.
- Paid search on a problem keyword: 1,800 visitors, 216 registrations, 12%. Intent is high.
- Paid social: 3,000 visitors, 120 registrations, 4%. Cold audience, interrupted while scrolling.
Is 8.7% good? It depends entirely on the mix. Doubling the social budget would push the average down even if nothing about the page changed. And the page is not one page for everyone: social visitors arrive knowing nothing, so they need the problem explained, proof that the webinar is worth an hour, and a shorter form. A separate social version of the page is the obvious test, while email and search visitors keep the current one.
Visitors
5,400
landed on the page
Registrations
468
8.7% overall
Paid social
4%
120 / 3,000
Webinar registration page · by source · 14 days
SampleChecklist: what usually moves the rate
Work through the table from the top. The first three items are about the visitor arriving at the right page; the rest are about the page itself.
| # | Check | Why it matters |
|---|---|---|
| 1 | Ad and page say the same thing | Mismatch is the most common cause of a low rate on paid traffic |
| 2 | Right audience for the offer | Cold audiences need more explanation or a smaller first step |
| 3 | One page per starting point | Warm and cold visitors need different amounts of context |
| 4 | Offer clear in the first screen | Visitors decide in seconds whether to read on |
| 5 | One call to action | Several choices split attention and lower completions |
| 6 | Short form, only fields you use | Each extra field costs completions; ask the rest later |
| 7 | Fast on mobile, trust shown | Slow pages and missing proof lose paid visitors first |
Start at the top; most low rates are fixed in rows 1–3.
Test changes properly
Change one thing at a time on the source with the most visitors and the lowest rate, split traffic randomly between versions, and run until you reach the sample size you planned. A 4% to 5% lift on 3,000 visitors a fortnight needs several weeks to tell apart from noise; see how to calculate statistical significance. Track a micro-conversion such as "started the form" alongside the goal: it moves sooner and shows where the page loses people.
FAQ
How do you calculate landing page conversion rate?
Conversions on the page's goal divided by visitors who landed on that page, times 100. Use distinct visitors for one-time goals such as registrations.
Why is my landing page conversion rate low?
Most often the traffic does not match the page: the ad promised something else, or the audience is cold. Then speed on mobile, an unclear offer, a long form and a weak call to action. Split by source before changing the page.
Should every campaign have its own landing page?
Every audience with a different starting point should. A cold social audience and a warm email list need different amounts of explanation, so one page rarely serves both well.
Does page speed affect landing page conversion rate?
Yes, especially on mobile and for paid traffic, where visitors leave quickly if the page is slow. Check the page's Web Vitals for mobile visitors first.
See also: Convert visitors into customers, Call to action.
Was this article helpful?
We use your answers to fix and expand this page.
Couldn’t send. Please try again in a minute.
Thanks for the feedback. We’ll use it to improve this page.You’ve already sent feedback on this page. Thanks.

Growth Strategist
Explores acquisition channels, activation, and conversion experiments, turning data insights into actionable growth hypotheses and evaluation methods.