Try it on your own data
Every report in this article is in the free plan. One snippet for web and apps, up to 10 sites.
Start free"Lead conversion rate" can mean visitor to lead, lead to qualified, or lead to customer. This guide gives the formula for each, explains why dividing this month's customers by this month's leads misleads, and shows how to measure by lead cohort with a fixed window.
What you will learn
- Name which of the three rates you mean
- Measure lead to customer by cohort with a fixed window
- Compare channels on 90-day cohort rate, not lead volume
Three rates with one name
People say "lead conversion rate" for at least three different numbers, and mixing them is the most common reporting error:
- Visitor → lead: how well the website turns visitors into leads. Leads ÷ unique visitors.
- Lead → qualified: how many leads are worth sales time. Qualified leads ÷ leads.
- Lead → customer: how many leads end up buying. New customers from those leads ÷ leads.
Say which one you mean in every report. The table gives the formula, who usually owns each and what it is used for.
| Rate | Formula | Usually owned by | Use it to |
|---|---|---|---|
| Visitor → lead | Leads ÷ unique visitors | Marketing / website | Judge pages, forms and offers |
| Lead → qualified | Qualified leads ÷ leads | Marketing and sales | Judge lead quality by channel |
| Lead → customer | New customers from a lead cohort ÷ leads in it | Sales / revenue | Forecast and compare channels |
State which rate a report shows.
Period method vs cohort method
The quick way is the period method: customers closed in October ÷ leads created in October. It is easy, but if your sales cycle is longer than a few days, October's customers came mostly from leads created in July, August and September. A month with many new leads looks worse; a month with few looks better. Neither says anything about lead quality.
The cohort method follows a group of leads: of the leads created in July, how many became customers within 30, 60 and 90 days? Every cohort is measured over the same window, so months are comparable, and you can see how long conversion takes.
A cohort example
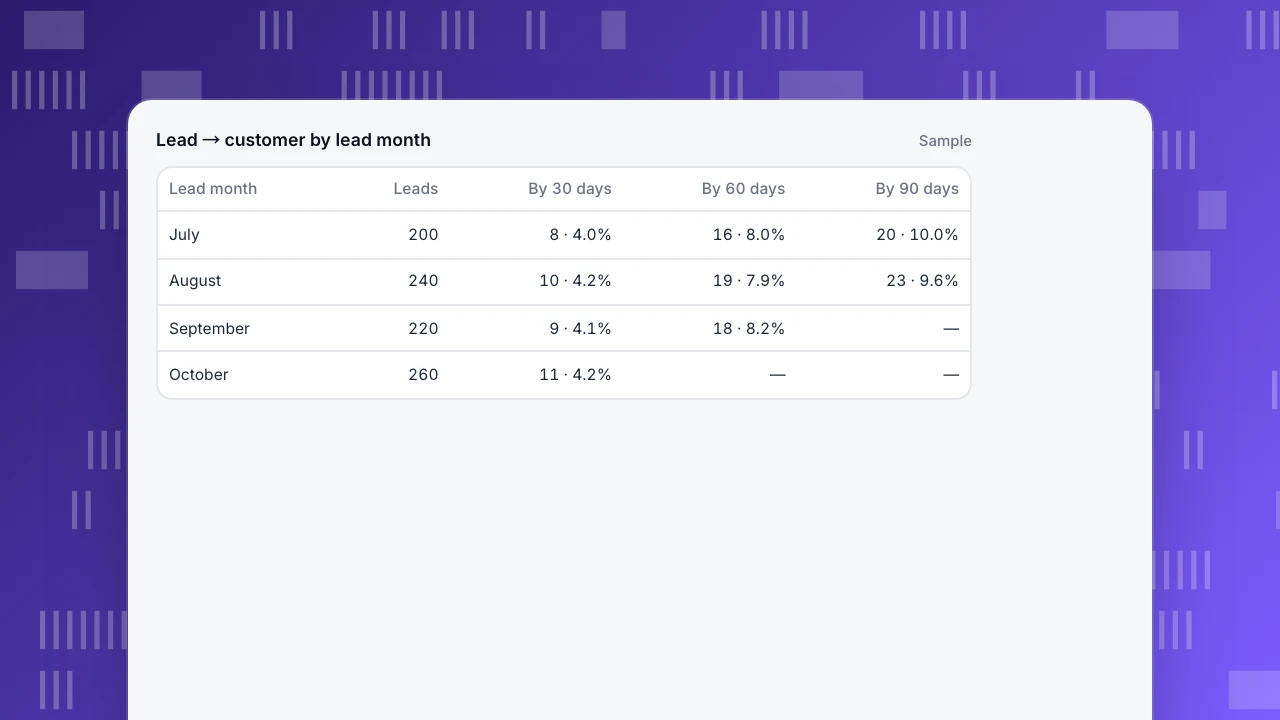
In the example, about 4% of each month's leads become customers within 30 days, about 8% within 60 days and about 10% within 90 days. The recent months are not worse: they simply have not had 60 or 90 days yet, and their cells stay empty rather than zero.
Using the period method on the same business, October would show 21 customers ÷ 260 leads = 8.1%, a number that mixes four cohorts. The cohort table says more clearly what to expect: about 10% of leads convert, most within 60 days.
Lead → customer by lead month
Sample| Lead month | Leads | By 30 days | By 60 days | By 90 days |
|---|---|---|---|---|
| July | 200 | 8 · 4.0% | 16 · 8.0% | 20 · 10.0% |
| August | 240 | 10 · 4.2% | 19 · 7.9% | 23 · 9.6% |
| September | 220 | 9 · 4.1% | 18 · 8.2% | — |
| October | 260 | 11 · 4.2% | — | — |
Read it by channel
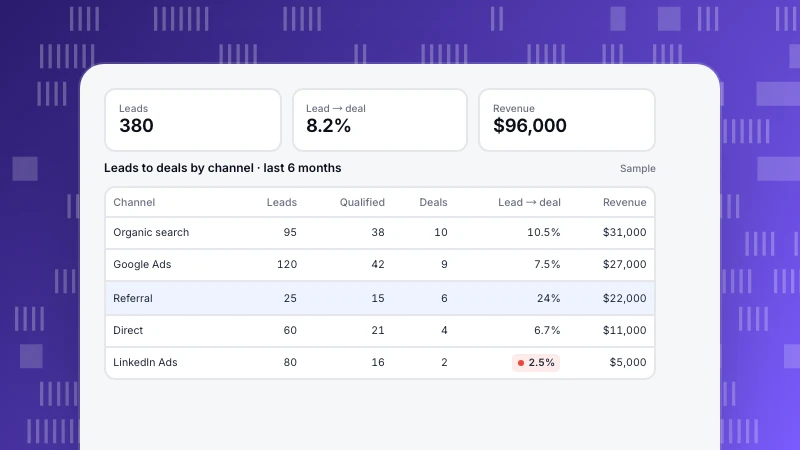
Split the cohort rate by lead source. Channels that produce many leads often convert at lower rates, and the difference only appears in lead → customer, not in visitor → lead. Capture the source at landing and keep it on the lead (see lead tracking), then compare channels on 90-day lead → customer rate and revenue.
How to improve it
- Respond faster. Leads that wait days for a reply cool off.
- Qualify early. Ask one or two questions on the form that separate buyers from researchers.
- Fix the handover. Check that every lead reaches sales with its source and history.
- Nurture the rest. Most leads are not ready now; keep in touch until they are.
- Cut channels that never convert. Judge them on the 90-day cohort rate, not lead volume.
Lead conversion in TapCub
A funnel from the lead event to the deal event gives the cohort rate directly: the window defaults to 7 days and can be set up to 180 days, steps can be ordered, strict or any order, and identity can be person so the same lead is followed across sessions (funnels). Run it with 30-, 60- and 90-day windows to see how conversion matures. The lead generation industry pack installs lead_submit and deal_closed (with amount) plus optional qualification and loss events, and a lead conversion funnel (industry packs). More in conversion rate, cohort and B2B website metrics.
FAQ
How do you calculate lead conversion rate?
For lead to customer: new customers from a group of leads ÷ the number of leads in that group, within a fixed window such as 90 days.
What is a good lead conversion rate?
It depends on how leads are defined, the price and the sales cycle. Compare your own cohorts over time and by channel rather than with other companies.
What is the difference between lead conversion rate and conversion rate?
Conversion rate usually means visitors who complete a goal. Lead conversion rate starts from leads and measures how many qualify or buy.
Why does my lead conversion rate drop when leads go up?
With the period method, a spike in new leads raises the denominator before those leads have had time to close. Use cohorts.
How long a window should I use?
Long enough to cover most of your sales cycle. Check when the cohort curve flattens; for many B2B products that is 60 to 90 days.
Was this article helpful?
We use your answers to fix and expand this page.
Couldn’t send. Please try again in a minute.
Thanks for the feedback. We’ll use it to improve this page.You’ve already sent feedback on this page. Thanks.

Product Experience Specialist
Explores usability, user journeys, and feature adoption through practical examples of onboarding and everyday product use.