Try it on your own data
Every report in this article is in the free plan. One snippet for web and apps, up to 10 sites.
Start freeB2B buyers research in groups, anonymously, over weeks. This guide lists the website metrics that follow that process, from high-intent page visits to lead-to-qualified rate and time to convert, with formulas and a sample monthly scorecard.
What you will learn
- Track intent and pipeline, not just traffic and bounce rate
- Judge channels on lead-to-qualified rate, not form counts
- Account metrics need identified users; anonymous visits stay visitors
Why B2B websites need different metrics
A B2B purchase is rarely one visit by one person. Several people from the same company read the site over weeks, most of them anonymously, and the decision happens in a sales conversation you cannot see from analytics. Traffic and bounce rate barely move with that process. The metrics that do follow buying intent and connect the website to pipeline.
Metrics by stage
The table groups the metrics into five stages with a formula for each. You do not need all of them. A workable monthly set is: visitors by channel, high-intent page visitors, demo or trial requests, visitor-to-lead rate, lead-to-qualified rate by channel and time to convert. Account metrics come later, once people log in.
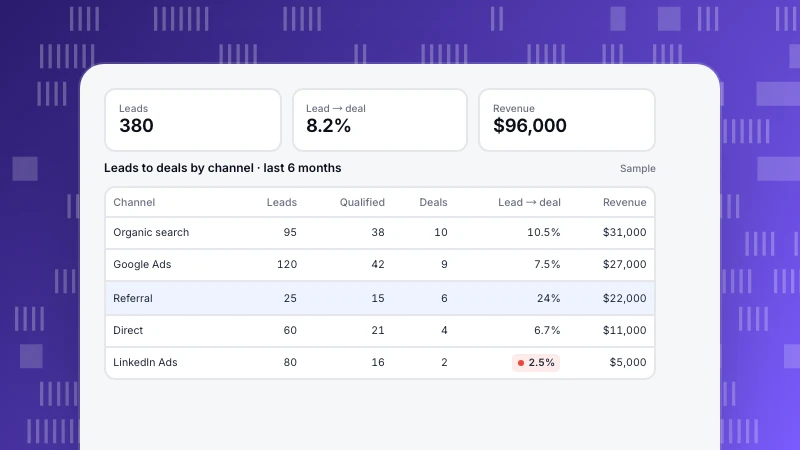
Two of these deserve a note. Lead-to-qualified by channel is the metric that changes budget decisions, because channels that produce many forms often produce few real opportunities (see lead tracking). Time to convert, the days from first visit to lead, tells you how long to wait before judging a campaign.
| Stage | Metric | Formula |
|---|---|---|
| Reach | Visitors by channel | Unique visitors per source channel |
| Engage | High-intent page visitors | Visitors who viewed pricing, security, integrations or case studies |
| Engage | Engaged session rate | Engaged sessions ÷ sessions |
| Convert | Demo or trial requests | Count of the request event |
| Convert | Visitor → lead rate | Leads ÷ unique visitors |
| Pipeline | Lead → qualified rate | Qualified leads ÷ leads, by channel |
| Pipeline | Website-sourced opportunities | Opportunities whose lead source is the website |
| Pipeline | Time to convert | Days from first visit to lead (median) |
| Accounts | Active accounts | Accounts with activity in 30 days (after login) |
Pick five or six for a monthly scorecard.
A monthly scorecard
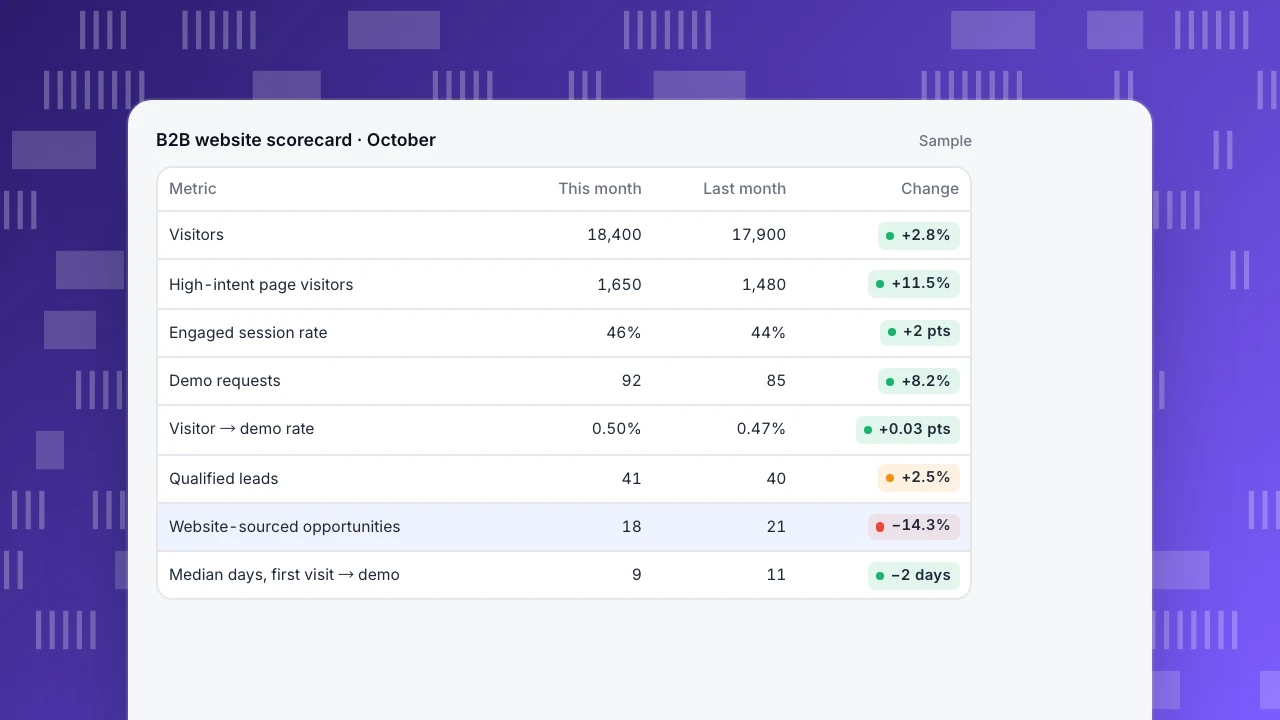
The example shows one month for a B2B software site. Traffic is flat, but visitors to high-intent pages rose by about 11% and demo requests by about 8%, while website-sourced opportunities fell from 21 to 18. With numbers this small, a drop of three opportunities is within normal variation; look at three months before reacting. The useful reading is that intent is up and the drop is probably downstream, in qualification or sales follow-up, not on the site.
B2B website scorecard · October
Sample| Metric | This month | Last month | Change |
|---|---|---|---|
| Visitors | 18,400 | 17,900 | +2.8% |
| High-intent page visitors | 1,650 | 1,480 | +11.5% |
| Engaged session rate | 46% | 44% | +2 pts |
| Demo requests | 92 | 85 | +8.2% |
| Visitor → demo rate | 0.50% | 0.47% | +0.03 pts |
| Qualified leads | 41 | 40 | +2.5% |
| Website-sourced opportunities | 18 | 21 | −14.3% |
| Median days, first visit → demo | 9 | 11 | −2 days |
High-intent pages
Some pages are read mostly by people who are evaluating: pricing, security and compliance, integrations, case studies, comparison pages and documentation for setup. Count visitors who view any of them as a separate metric. It moves earlier than leads, and it tells you whether content and campaigns attract evaluators or only readers.
Define the list once, as a page goal with prefix or wildcard rules, so the number stays comparable month to month. See conversion tracking.
Accounts, and what they need
Account-level metrics, such as active accounts or how many people from one company use the product, need people to be identified, usually after login. Analytics tools that respect privacy do not turn an anonymous visitor's address into a company name, so for the pre-lead website the unit is the visitor, not the account. Once leads and customers log in, account metrics become useful for trials, onboarding and expansion. See SaaS metrics.
B2B website metrics in TapCub
Engaged sessions count sessions of at least 10 seconds, two or more pageviews, or a key event. Goals can be page goals (exact, prefix or wildcard), which suits a high-intent page list, or event goals with property filters for demo requests, and goal rate is converting visitors divided by unique visitors. Interval analysis under Distribution shows the time between two actions, such as first visit and demo request (distribution & interval).
For accounts, call tapcub.group('company', id, traits) after login. Accounts shows account count, accounts active in 30 days, members and a 0–100 health score built from active members (40 points), active days (30) and recency (30). Membership requires an identified user, so anonymous visitors are never members (accounts). More in conversion rate, source channel and marketing KPIs.
FAQ
What are the most important B2B website metrics?
High-intent page visitors, demo or trial requests, visitor-to-lead rate, lead-to-qualified rate by channel and time to convert.
What is a good conversion rate for a B2B website?
It depends on traffic mix and offer. Track your own rate by channel and page over time instead of comparing with averages from other sites.
How do I connect website metrics to pipeline?
Capture the lead's source on the website and send qualification and opportunity stages back from your CRM with the same lead ID.
Can analytics tell me which companies visit my site?
Not without identification. Privacy-respecting analytics does not map anonymous visitors to companies; account metrics start once people log in or identify themselves.
How often should I review B2B website metrics?
Monthly, with a three-month view for anything based on small numbers such as opportunities.
Was this article helpful?
We use your answers to fix and expand this page.
Couldn’t send. Please try again in a minute.
Thanks for the feedback. We’ll use it to improve this page.You’ve already sent feedback on this page. Thanks.

Growth Strategist
Explores acquisition channels, activation, and conversion experiments, turning data insights into actionable growth hypotheses and evaluation methods.