Try it on your own data
Every report in this article is in the free plan. One snippet for web and apps, up to 10 sites.
Start freeMost SaaS metric lists give 16 formulas side by side. This guide ties the revenue metrics to one MRR bridge, computes NRR, GRR, quick ratio and CAC payback from a worked example, and pairs each line with the product signal that predicts it.
What you will learn
- New, expansion, reactivation, contraction and churned MRR explain every change in MRR
- NRR, GRR, revenue churn and quick ratio all come from the same bridge
- Billing data is the source for revenue; product data gives the earlier signals
Start with the MRR bridge
Lists of SaaS metrics usually run to 16 or 17 items, each with its own formula. Most of the revenue metrics are really views of one table: the MRR bridge, which explains how monthly recurring revenue moved from the start of a month to the end.
start MRR + new + expansion + reactivation − contraction − churned = end MRR
- New MRR: first subscriptions from customers who had never paid.
- Expansion MRR: upgrades, extra seats, add-ons from existing customers.
- Reactivation MRR: customers who had churned and came back.
- Contraction MRR: downgrades and removed seats.
- Churned MRR: subscriptions cancelled or not renewed.
MRR counts recurring charges only, with annual plans divided by 12. One-off fees and usage overages are usually kept out, or tracked separately, so the bridge balances.
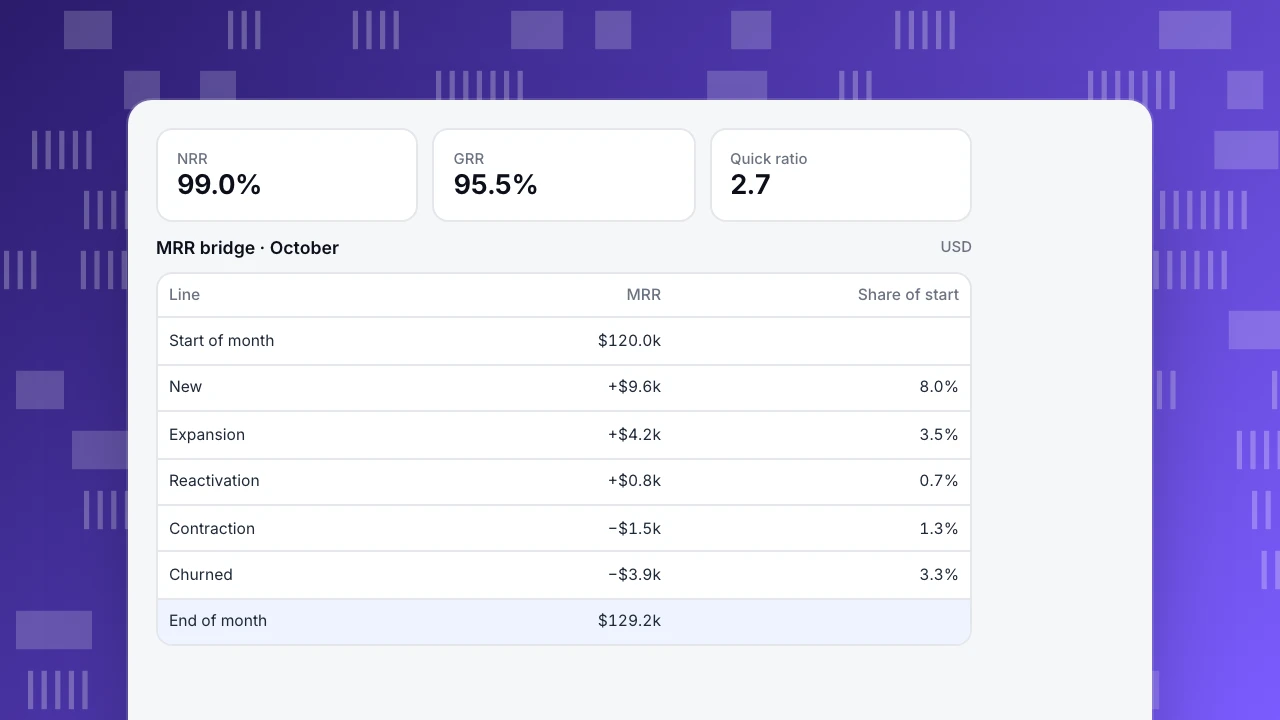
In the example the month starts at $120.0k and ends at $129.2k. Growth looks healthy, but the bridge shows why: new sales carry it, while existing customers shrank slightly.
NRR
99.0%
GRR
95.5%
Quick ratio
2.7
MRR bridge · October
USD| Line | MRR | Share of start |
|---|---|---|
| Start of month | $120.0k | |
| New | +$9.6k | 8.0% |
| Expansion | +$4.2k | 3.5% |
| Reactivation | +$0.8k | 0.7% |
| Contraction | −$1.5k | 1.3% |
| Churned | −$3.9k | 3.3% |
| End of month | $129.2k |
Ratios from the bridge
Using the example numbers:
- Net revenue retention (NRR) = (start + expansion − contraction − churned) ÷ start = (120.0 + 4.2 − 1.5 − 3.9) ÷ 120.0 = 99.0%. It leaves out new customers, so it answers: does the existing base grow by itself? Above 100% means expansion outruns losses.
- Gross revenue retention (GRR) = (start − contraction − churned) ÷ start = 114.6 ÷ 120.0 = 95.5%. It ignores expansion, so it can never exceed 100%, and it shows how much revenue leaks.
- Revenue churn rate = (contraction + churned) ÷ start = 4.5%, which is 1 − GRR.
- Quick ratio = (new + expansion + reactivation) ÷ (contraction + churned) = 14.6 ÷ 5.4 = 2.7. Revenue added per dollar lost.
Revenue churn and customer churn can tell different stories: losing many small customers raises customer churn but barely moves revenue churn. Report both. More in churn rate vs retention rate and churn.
Acquisition efficiency
Growth from new MRR is only good if it is affordable.
- CAC = sales and marketing spend in a period ÷ new customers in that period.
- CAC payback (months) = CAC ÷ (new MRR per new customer × gross margin). The months of gross profit it takes to earn back acquisition cost.
- LTV to CAC = lifetime gross profit per customer ÷ CAC. LTV estimates are sensitive to the churn assumption, so payback months are often easier to trust.
- ARPU or ARPA: MRR ÷ paying users or accounts, to see whether growth comes from more customers or bigger ones.
Formula reference
The table gathers the formulas and, more importantly, where each number comes from. Revenue lines come from billing; the leading signals come from product data.
| Metric | Formula | Data from |
|---|---|---|
| MRR | Sum of monthly recurring charges (annual ÷ 12) | Billing |
| NRR | (start + expansion − contraction − churned) ÷ start | Billing |
| GRR | (start − contraction − churned) ÷ start | Billing |
| Quick ratio | (new + expansion + reactivation) ÷ (contraction + churned) | Billing |
| Customer churn | Customers lost ÷ customers at start | Billing |
| CAC payback | CAC ÷ (new MRR per customer × gross margin) | Billing + spend |
| Trial conversion | Trials that subscribe ÷ trials started | Product events |
| Account health | Active members, active days, recency | Product events |
NRR excludes new customers; GRR also excludes expansion.
Product signals that lead the bridge
Billing data tells you what happened at renewal. Product data tells you earlier:
- Churned and contraction MRR are led by falling account activity, fewer active seats and core features going unused in the weeks before renewal.
- Expansion MRR is led by seats approaching plan limits, invites sent and new teams adopting the product.
- New MRR is led by trial activation and the trial-to-paid funnel.
Pair each bridge line with the product signal that predicts it, as in leading vs lagging indicators.
SaaS metrics in TapCub
The billing system stays the source of truth for MRR. TapCub covers the product side and the subscription events. The B2B / SaaS industry pack defines events such as signed_up, feature_used, trial_started, subscription_started (with plan and mrr), subscription_upgraded and subscription_cancelled, and sets up metrics including trial conversion rate, new MRR, upgrade MRR, churned MRR and subscription churn rate, plus funnels and dashboards (industry packs). Subscription amounts should be sent from the server.
Events attach to accounts with group, and each account gets a 0–100 health score from active members, active days and recency (accounts), a direct leading signal for churned and expansion MRR. See industry templates, revenue tracking and the SaaS solution page.
FAQ
What are the most important SaaS metrics?
MRR and its bridge (new, expansion, contraction, churned), NRR, GRR, CAC payback and customer churn. Most other revenue metrics derive from these.
What is the difference between NRR and GRR?
NRR includes expansion from existing customers; GRR does not. NRR can exceed 100%, GRR cannot.
How do you calculate MRR?
Sum the monthly recurring charges of all active subscriptions, with annual plans divided by 12. Leave out one-off fees.
What is a good SaaS quick ratio?
It depends on stage and segment. Read it as revenue added per dollar lost and watch its trend; a falling ratio with stable new MRR means losses are growing.
Which SaaS metrics come from product analytics?
The leading ones: activation, feature adoption, active seats and account health. Revenue lines come from billing.
See also: Unit economics, Subscription analytics, Revenue growth rate.
See also: SaaS customer journey, Value metric.
Was this article helpful?
We use your answers to fix and expand this page.
Couldn’t send. Please try again in a minute.
Thanks for the feedback. We’ll use it to improve this page.You’ve already sent feedback on this page. Thanks.

Data Engineer
Writes about event design, data quality, and collection workflows, with verifiable implementation methods for reliable analytics.