Try it on your own data
Every report in this article is in the free plan. One snippet for web and apps, up to 10 sites.
Start freeRevenue, churn and renewals tell you how you did, weeks after it was too late to change. Leading indicators promise an earlier warning, but only if they really predict the outcome. This guide pairs leading and lagging indicators by stage, shows a method to find and validate one in your own data, and explains how to alert on it.
What you will learn
- Lagging indicators judge the result; leading indicators let you change it in time
- Find a leading indicator by comparing outcome rates of people who did an early behaviour and those who did not
- Measure the lag, keep the lagging partner on the same dashboard, and revalidate every quarter
Leading vs lagging indicators, defined
A lagging indicator measures an outcome after it has happened: revenue, churn, renewals, annual retention. It is what you are judged on, and it moves too late to steer by. A leading indicator measures behaviour that tends to come before the outcome: trial accounts that reach their first result, weekly use of the core feature, qualified demo requests. It moves early enough to act on, but it is only useful if it really predicts the outcome.
The comparison is not "which is better". You need lagging indicators to know whether you won, and leading indicators to change the result while there is still time.
Leading and lagging pairs by stage
Every lagging indicator worth tracking should have at least one leading indicator paired with it. The table gives typical pairs for a product with a website and a free trial, following the stages of the AARRR framework. Treat them as candidates; whether they lead in your business has to be tested.
| Stage | Lagging indicator | Leading indicator candidates |
|---|---|---|
| Acquisition | New customers per month | Qualified sign-ups per week by channel |
| Activation | Trial-to-paid rate | Trials reaching the first result within 3 days |
| Retention | Week-8 retention, churn | Weekly use of the core feature |
| Revenue | MRR, net revenue retention | Accounts hitting plan limits, seats added |
| Referral | Referred customers | Invites sent per active account |
Candidates only: test each against the outcome in your own data.
Leading indicators move first
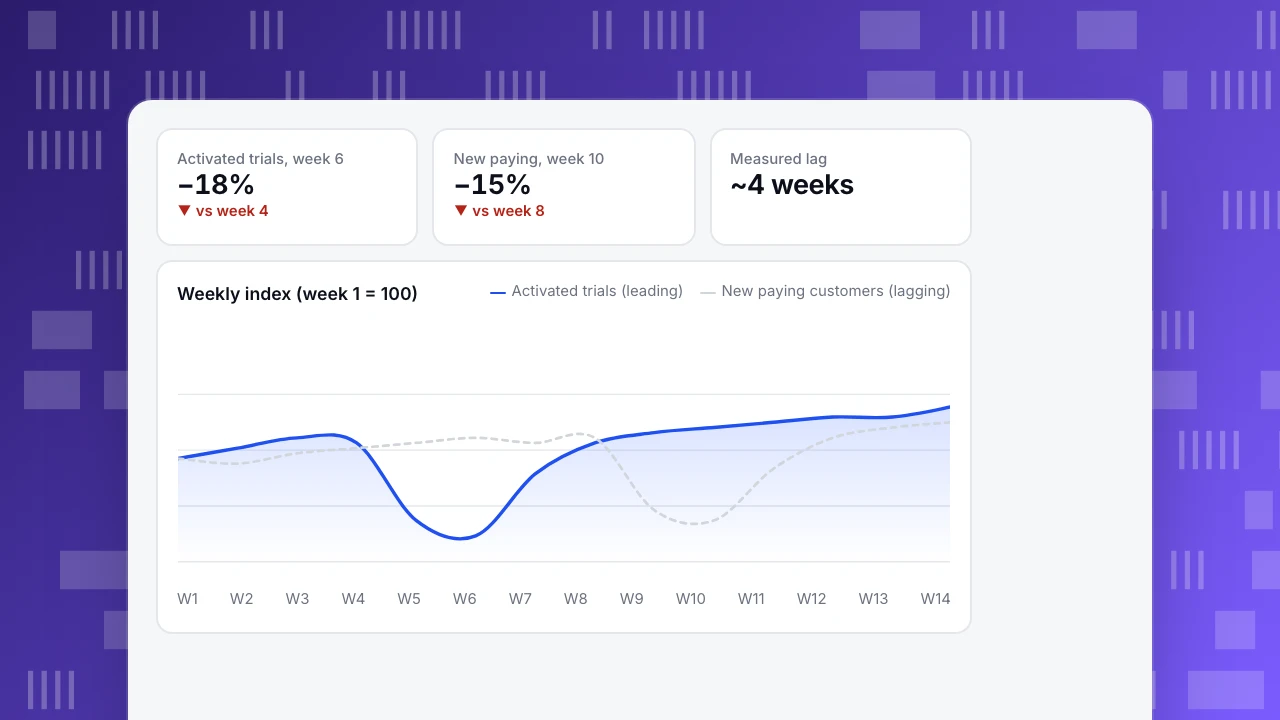
The chart shows the pattern you are looking for. Weekly activated trial accounts (leading) dip in weeks 5 and 6 after a sign-up form change; new paying customers (lagging) dip about four weeks later, when those trials would have converted. By the time revenue shows the problem, a month of trials has already been lost. Watching the leading series would have caught it in week 5.
Measuring that delay, the lag time, matters as much as finding the indicator. It tells you how long to wait before judging a change and how far ahead your leading indicator can warn you.
Activated trials, week 6
−18%
▼ vs week 4
New paying, week 10
−15%
▼ vs week 8
Measured lag
~4 weeks
Weekly index (week 1 = 100)
Activated trials (leading)New paying customers (lagging)How to find a leading indicator in your data
- Start from the lagging outcome you care about, for example "converted to paid within 30 days" or "still active in week 8".
- List early behaviours that could plausibly cause it, taken from the first days of use: created a project, invited a teammate, used the core feature three times.
- Compare groups. Split a past cohort by whether people did each behaviour early, and compare the outcome rate of the two groups. A behaviour where the outcome rate differs sharply is a candidate; see onboarding metrics for the activation version of this test.
- Check it over time. Plot the weekly count of the behaviour against the outcome a few weeks later. If the two move together with a steady delay across several months, you have a leading indicator and its lag time.
Correlation is not proof of cause. The test is whether improving the leading indicator later moves the lagging one. If you push more people through a behaviour and the outcome does not follow, the behaviour was a symptom, not a driver.
Common mistakes
- Choosing what is easy to count. Page views and logins move early, but they rarely predict revenue.
- Gaming the indicator. Once a leading indicator becomes a target, teams find ways to move it that do not move the outcome, such as prompting users to click the "core action" without getting value. Keep the lagging indicator on the same dashboard.
- Ignoring the lag. Judging a change by revenue one week later, when the lag is four weeks, leads to wrong conclusions.
- Never revalidating. Product changes can break the link. Re-run the group comparison every quarter.
Review cadence
Review leading indicators weekly, or daily for high-volume products, and lagging indicators monthly or quarterly. Put each pair side by side on one dashboard, with the lag written next to it, so nobody celebrates a leading spike without checking the outcome later.
Leading indicators in TapCub
Any leading indicator built from events can be saved as a metric in TapCub and put on a dashboard next to its lagging partner. To catch a drop before the outcome moves, add a monitor: it checks a built-in measure or a saved metric hourly, daily, weekly or monthly, with a fixed threshold, a period-over-period change, a forecast band (after 14 days of history) or an anomaly rule based on the same weekday over 28 days, and notifies you when it fires (monitors).
Annotations on charts mark releases and campaigns, which makes it easier to see a leading indicator react to a change and the lagging indicator follow weeks later.
FAQ
What is the difference between leading and lagging indicators?
A lagging indicator measures an outcome after it happened, such as revenue or churn. A leading indicator measures earlier behaviour that tends to predict that outcome, such as activated trials or weekly use of a core feature.
What are examples of leading indicators for a SaaS product?
Trial accounts reaching their first result, weekly active accounts using the core feature, teammates invited in the first week, and qualified demo requests. Each needs to be tested against the outcome in your own data.
Is revenue a leading or lagging indicator?
Lagging. It confirms what already happened in acquisition, activation and retention.
How do I know a leading indicator really leads?
Compare outcome rates for people who did and did not do the behaviour, check that the weekly series moves before the outcome with a steady delay, and confirm that improving it later moves the outcome.
How many leading indicators should I track?
One or two per lagging outcome. More than that dilutes attention and makes it hard to tell which one actually predicts the result.
Was this article helpful?
We use your answers to fix and expand this page.
Couldn’t send. Please try again in a minute.
Thanks for the feedback. We’ll use it to improve this page.You’ve already sent feedback on this page. Thanks.

Growth Strategist
Explores acquisition channels, activation, and conversion experiments, turning data insights into actionable growth hypotheses and evaluation methods.