Try it on your own data
Every report in this article is in the free plan. One snippet for web and apps, up to 10 sites.
Start free"Our retention is 40%" can mean five different calculations. This guide lists the retention metrics that genuinely differ, shows how to calculate retention rate with a worked example, explains the counting choices that move the number, and suggests which metric fits which kind of business.
What you will learn
- Several different calculations are called "retention rate"; state which one you use
- Read a cohort table along rows, down columns and across the latest diagonal
- Bounded vs unbounded, alignment and the return event all change the number
What retention metrics measure
Retention metrics measure how many people keep coming back, or keep paying, after a starting point. They answer the most important question in a subscription or repeat-purchase business: does the value last? Acquisition and activation get people in; retention decides whether that effort compounds.
The trouble is that "retention rate" is several different calculations. Two teams can both report "40% retention" and mean completely different things. Pick the metric that answers your question, write down how it is counted, and do not compare numbers counted differently.
The retention metrics, side by side
The table lists the retention metrics that genuinely differ, with the formula and the question each answers. Many articles also list NPS, CSAT or lifetime value as retention metrics; they relate to retention but do not measure it.
| Metric | Formula | Question it answers |
|---|---|---|
| Customer retention rate | (End − new) ÷ start customers | Did we keep paying customers this period? |
| N-day / N-week retention | Cohort active in period N ÷ cohort size | Do new users come back at a given age? |
| Unbounded retention | Cohort active in period N or later ÷ cohort size | Do they come back at all from that point? |
| Revenue retention | Revenue from a cohort now ÷ at start | Does revenue from existing customers hold? |
| Repeat purchase rate | Buyers with 2+ orders ÷ buyers | Do customers buy again? |
| DAU/MAU | Daily active ÷ monthly active | How often do active users show up? |
NPS, CSAT and lifetime value relate to retention but do not measure it.
How to calculate retention rate
The customer retention rate for a period is:
(customers at the end − new customers acquired during the period) ÷ customers at the start
Worked example: you start the month with 400 paying customers, gain 60 new ones and end with 420. Retention rate = (420 − 60) ÷ 400 = 90%. The churn rate for the month is the other 10%: 40 of the starting customers left.
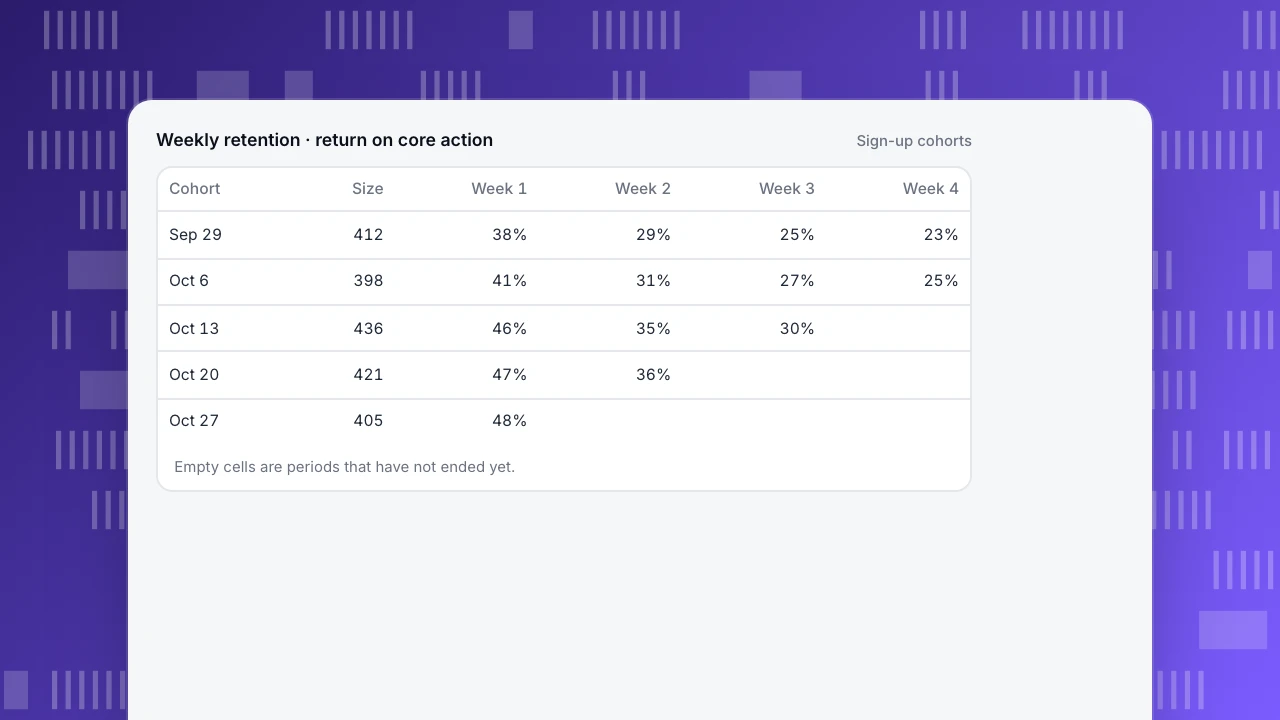
For user retention in a product, the calculation follows a cohort instead: take everyone who signed up in a given week (the cohort), and for each following week count how many were active. Week-4 retention = cohort members active in week 4 ÷ cohort size. You can try both calculations in the retention calculator.
Read a cohort table
A cohort table puts one cohort per row and one period per column. Read it in three directions:
- Along a row: how one cohort decays over time. A curve that flattens is good news; a curve that keeps falling means no lasting group of users forms.
- Down a column: whether newer cohorts retain better than older ones at the same age. This is how you see whether product changes worked.
- The last diagonal: the most recent period for every cohort, where seasonal effects and outages show up for everyone at once.
In the example, later cohorts retain better at week 1 and week 2, a sign that an onboarding change helped. The newest cohort's week-4 cell is empty because that week has not ended yet: an unfinished period must be shown as empty, not as zero, or the newest cohort looks like a disaster.
Weekly retention · return on core action
Sign-up cohorts| Cohort | Size | Week 1 | Week 2 | Week 3 | Week 4 |
|---|---|---|---|---|---|
| Sep 29 | 412 | 38% | 29% | 25% | 23% |
| Oct 6 | 398 | 41% | 31% | 27% | 25% |
| Oct 13 | 436 | 46% | 35% | 30% | |
| Oct 20 | 421 | 47% | 36% | ||
| Oct 27 | 405 | 48% |
Empty cells are periods that have not ended yet.
Counting choices that change the number
- Exact period or period-or-later. "Returned in week 4" (bounded) counts only people active in that week. "Returned in week 4 or later" (unbounded) also counts people who skipped week 4 and came back in week 6; its curve never rises and always sits higher.
- Personal or calendar alignment. Day 7 can mean seven days after each person's start, or the seventh calendar day of the cohort. Personal alignment is fairer when sign-ups spread across a week.
- What counts as returning. Any activity, or a specific value event. Retention on "any page view" is always higher and less meaningful than retention on the core action.
- The average. Average cohort rates weighted by cohort size, or a small cohort can swing the overall number.
Pick a retention metric by business model
- Subscription SaaS: customer retention rate and revenue retention monthly; user retention on the core action weekly.
- Apps used daily: day-1, day-7 and day-30 retention, plus DAU/MAU.
- Online stores: repeat purchase rate within 90 or 180 days; weekly retention is meaningless when people buy twice a year.
- Content and media: weekly returning readers, aligned by calendar week.
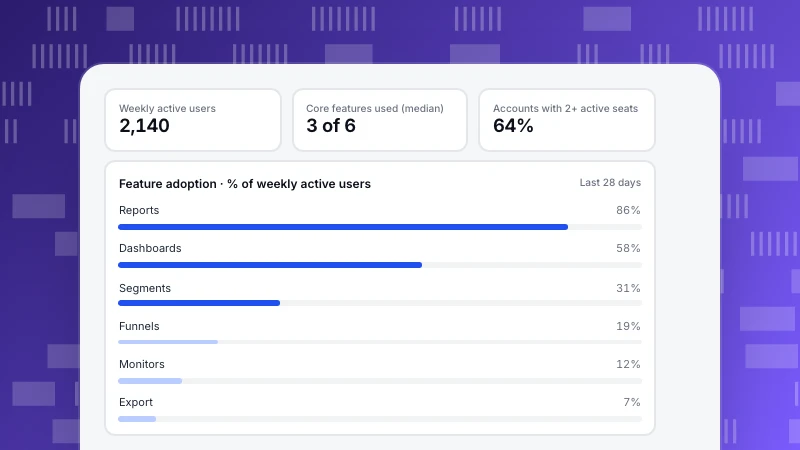
Retention also depends on what happens at the start. If retention is weak, check onboarding and feature adoption before blaming the later experience.
Retention metrics in TapCub
TapCub's retention analysis lets you set an optional start event and return event (any activity if both are empty), a period of day, week or month, and one of three modes: returned in period N exactly, returned in period N or any later period, or how many periods each person returned. Alignment defaults to each person's own start, with calendar periods as an option. Each row is a cohort with its size and a count and rate per period; a period that has not ended is empty, not zero, and the line under the table is the size-weighted average (retention).
The lifecycle view next to it splits active people into new, returning and resurrected over time, which helps explain a retention change. A numeric property such as revenue can be accumulated per period, which gives revenue per retained user for each cohort.
FAQ
What are retention metrics?
Measurements of how many people keep using or paying for a product after a starting point: customer retention rate, N-day user retention, revenue retention and repeat purchase rate.
How do you calculate retention rate?
For customers: (customers at the end − new customers in the period) ÷ customers at the start. For users: cohort members active in period N ÷ cohort size.
What is the difference between retention rate and churn rate?
For customers over one period, churn rate is roughly 100% minus retention rate. For user cohorts they are not simple opposites, because people can skip a period and come back.
What is a good retention rate?
It depends on the business model and on how you count. Compare cohorts with each other and with your own past before comparing with published figures.
Why is the newest cohort's retention so low?
Usually because its later periods have not finished. Unfinished periods should be shown as empty, not zero.
See also: User status segmentation.
Was this article helpful?
We use your answers to fix and expand this page.
Couldn’t send. Please try again in a minute.
Thanks for the feedback. We’ll use it to improve this page.You’ve already sent feedback on this page. Thanks.

Product Analyst
Focuses on event analysis, conversion funnels, and retention, using clear metric definitions and structured analysis to explain product performance.