Try it on your own data
Every report in this article is in the free plan. One snippet for web and apps, up to 10 sites.
Start freeUser status segmentation classifies users each week or month as new, returning, resurrected, at risk or dormant, so you can see the flows behind your active user count. This guide defines each status, explains the growth accounting identity and quick ratio, lists actions per status, and shows a week where a campaign doubled new users but sent many straight to dormant.
What you will learn
- Match the period to your product’s natural usage interval
- Define activity by a core action, not opens
- Δ active = new + resurrected − dormant
- Quick ratio above 1 means the base grows
- Act differently on each status
What is user status segmentation?
User status segmentation groups users by where they are in their lifecycle with your product right now: new, active (returning), resurrected (back after a gap), at risk and dormant (inactive). Instead of one "active users" number, you see the flows between these states each week or month, which explains why the active base grows or shrinks.
A growing user count can hide trouble. If new users pour in while most of them go dormant a week later, growth is being bought, not earned. Status segmentation makes that visible.
The standard user statuses
| Status | Definition (weekly example) | What it tells you |
|---|---|---|
| New | First activity ever happened this week | Acquisition is working |
| Returning | Active this week and last week | The core of a healthy product |
| Resurrected | Active this week, inactive last week, active at some earlier point | Win-back and seasonality |
| At risk | Active before, but past their usual return interval | Who to reach before they leave |
| Dormant (churned) | Active last week, inactive this week | Where the active base is leaking |
The period (day, week or month) should match how often your product is naturally used. A daily messaging app and a monthly invoicing tool need different windows.
| Status | Main lever |
|---|---|
| New | Onboarding, time to first value |
| Returning | Feature depth, upgrades, referrals |
| Resurrected | Repeat what brought them back |
| At risk | Timely, relevant reminders |
| Dormant | Win-back with a reason; learn why they left |
Save each status as a segment to compare behavior and revenue.
The growth accounting identity
Active users this period = new + returning + resurrected, and the change from last period is:
Δ active = new + resurrected − dormant
A related ratio, sometimes called the quick ratio for users, is (new + resurrected) ÷ dormant. Above 1 the active base grows; below 1 it shrinks. Products with healthy organic growth often sit well above 1; mature products hover near 1 with large returning bases.
How to use status segmentation
1. Choose the activity definition
Decide what counts as "active": any session, or a core action such as "created an invoice". Core actions give a truer picture.
2. Pick the period
Weekly for products used several times a week, monthly for products used a few times a month.
3. Read the flows, not just the totals
Each period, look at how many users entered (new, resurrected) and left (dormant). A stable total with high churn and high acquisition is a fragile business.
4. Act on each status differently
- New: onboarding and time to first value.
- Returning: deeper feature adoption, upgrades, referrals.
- Resurrected: find what brought them back (season, campaign, feature) and repeat it.
- At risk: reminders tied to their past use, help content, check-ins for valuable accounts.
- Dormant: win-back campaigns with a reason to return; learn why they left.
5. Track segments over time
Save each status as a segment so you can compare conversion, revenue and feature use across them.
Worked example: weekly lifecycle
A project management app (sample data), weekly active users defined as "updated a task":
| Week | New | Returning | Resurrected | Dormant | Active | Quick ratio |
|---|---|---|---|---|---|---|
| W1 | 1,200 | 8,100 | 600 | −1,500 | 9,900 | 1.20 |
| W2 | 1,400 | 8,300 | 550 | −1,600 | 10,250 | 1.22 |
| W3 | 2,600 | 8,400 | 500 | −1,850 | 11,500 | 1.68 |
| W4 | 2,500 | 8,900 | 450 | −2,600 | 11,850 | 1.13 |
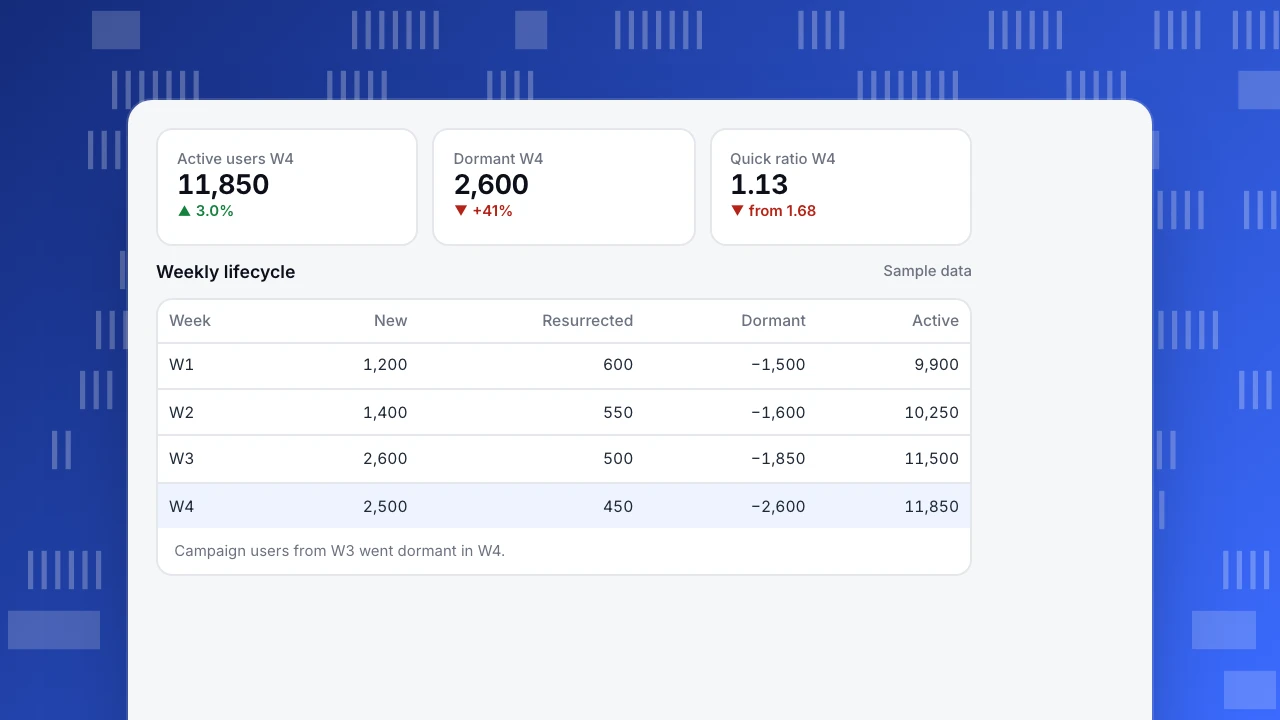
Week 3's campaign more than doubled new users and active users jumped 12%. But dormant users rose to 2,600 in week 4: many campaign sign-ups did not return. The quick ratio fell back to 1.13. The next action was not more campaign budget but a better first-week experience for campaign users.
Active users W4
11,850
▲ 3.0%
Dormant W4
2,600
▼ +41%
Quick ratio W4
1.13
▼ from 1.68
Weekly lifecycle
Sample data| Week | New | Resurrected | Dormant | Active |
|---|---|---|---|---|
| W1 | 1,200 | 600 | −1,500 | 9,900 |
| W2 | 1,400 | 550 | −1,600 | 10,250 |
| W3 | 2,600 | 500 | −1,850 | 11,500 |
| W4 | 2,500 | 450 | −2,600 | 11,850 |
Campaign users from W3 went dormant in W4.
Common mistakes
- Using a window that does not match usage. Monthly statuses for a daily app hide churn; daily statuses for a monthly app show false churn.
- Counting opens as activity. Use the core action where possible.
- Watching only total active users. The flows explain the total.
- One message for all statuses. At-risk and dormant users need different approaches.
- Ignoring resurrection. It is often a large and cheap source of active users.
User status segmentation in TapCub
- Lifecycle view: All-platform analytics › Behavior › Behavior analysis › Lifecycle shows four counts per week or month: new, returning, resurrecting and dormant (drawn as negative on the next period). You can set an optional activity event and an "established" cutoff (default 7 days).
- Inactivity buckets: see how many people have been inactive for at least 7, 14, 30, 60 and 90 days.
- Segments: create rule-based user segments such as "active before, not seen in 14 days" and compare their behavior; RFM segments split buyers by recency, frequency and value.
- Retention: cohort retention for the same activity definition. See how to do cohort analysis.
Related: user segmentation examples, retention metrics.
FAQ
What is the difference between user status segmentation and cohort analysis? Cohort analysis follows groups of users who started at the same time. Status segmentation looks at all users in each period and classifies them by their current state.
How do I define a dormant user? Someone who was active in the previous period and inactive in this one, using the same activity definition and period length.
What is a resurrected user? A user who is active this period, was inactive in the previous period, and had been active at some point before.
Which period should I use? Match the natural usage interval: daily for apps used several times a day, weekly for apps used several times a week, monthly for occasional tools.
Sources
- Wilson, J. Growth accounting and the quick ratio. Social Capital.
- Mixpanel Docs. Lifecycle and retention reports.
Was this article helpful?
We use your answers to fix and expand this page.
Couldn’t send. Please try again in a minute.
Thanks for the feedback. We’ll use it to improve this page.You’ve already sent feedback on this page. Thanks.

Data Analyst
Explores traffic sources, conversion funnels, and retention, using clear metric definitions and concrete examples to explain what the numbers mean.