Try it on your own data
Every report in this article is in the free plan. One snippet for web and apps, up to 10 sites.
Start freeA user flow diagram is the team’s best guess at how people will complete a task. Real users skip, go back and leave in places nobody drew. This guide shows how to create a user flow, how it differs from a journey map, and how to check it against measured paths, with a worked signup example.
What you will learn
- A user flow maps the steps to complete one task
- Journey maps cover the whole relationship; flows cover one task
- Draw the happy path first, then errors, skips and going back
- Validate the diagram with path analysis after launch
- Count by people for flows that span emails or days
What is a user flow?
A user flow is the sequence of steps a user takes in a product or website to complete one task, such as signing up, buying a product or inviting a teammate. In design, a user flow is usually drawn as a user flow diagram: boxes for screens or pages, diamonds for decisions, arrows for the path between them, from an entry point to a goal.
User flows serve two purposes. Before building, they help a team agree on the shortest path to a goal and spot missing screens and dead ends. After launch, comparing the designed flow with the paths people actually take shows where the design and reality diverge.
User flow vs user journey vs wireflow
| User flow | User journey (journey map) | Wireflow | |
|---|---|---|---|
| Scope | One task inside the product | The whole relationship, across channels and over time | One task, with screen layouts |
| Shows | Screens, decisions, paths | Stages, actions, thoughts, emotions, touchpoints | Wireframes connected by arrows |
| Used for | Interaction design, finding dead ends | Strategy, finding pain points across touchpoints | Handing a flow to engineering |
| Typical author | Product designer | UX researcher, product marketer | Product designer |
A journey map tells you that people are frustrated during onboarding; a user flow shows which of the seven onboarding screens causes it.
| User flow | Journey map | |
|---|---|---|
| Scope | One task | Whole relationship |
| Shows | Screens and decisions | Stages, emotions, touchpoints |
| Used for | Interaction design | Strategy and pain points |
A wireflow is a user flow drawn with wireframes.
How to create a user flow
- Pick one goal. "New user creates a workspace and reaches the dashboard," not "onboarding."
- Define the entry points. Where do users start? An ad landing page, a pricing page, an invite email and the app store lead to different first screens.
- List the steps and decisions. Every screen, form, choice ("Do you have an invite code?") and system action (sending an email).
- Draw the happy path first, then add branches: errors, skips, going back, logged-out states.
- Count the steps and remove some. Ask for each step whether it is needed now or can wait until after the user gets value.
- Validate with real paths. After launch, run a path analysis from the entry point and compare it with the diagram.
Common shapes: an oval or rounded box for entry and end points, a rectangle for a screen, a diamond for a decision, an arrow for direction. Tools such as Figma, FigJam, Miro and Whimsical have user flow templates.
User flow examples
- Signup: landing page → sign-up form → verify email → create workspace → (invite team | skip) → dashboard.
- Checkout: cart → (guest | sign in) → shipping → payment → review → confirmation.
- Password reset: sign-in → "Forgot password" → enter email → open email → set new password → signed in.
- Upgrade: usage limit warning → pricing → choose plan → payment → confirmation → feature unlocked.
Worked example: designed signup flow vs actual paths
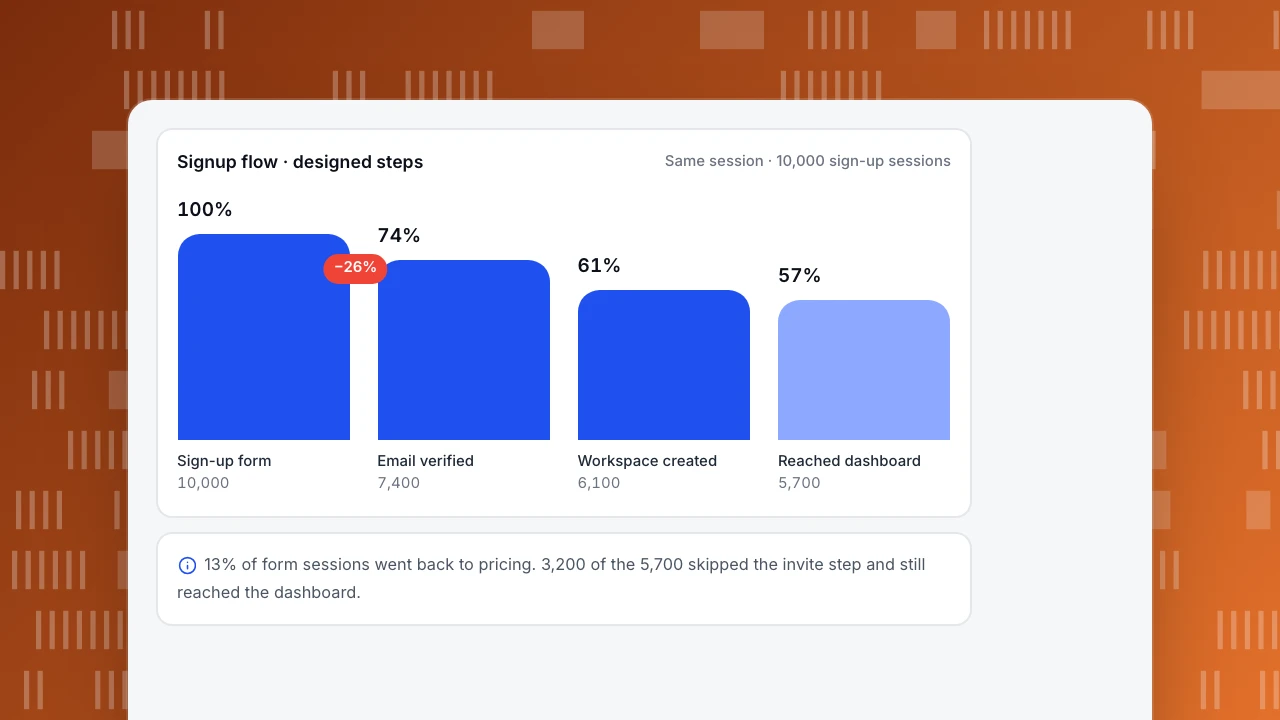
A SaaS product designed a five-step signup flow. After launch, the team ran a forward path analysis from the sign-up form over 10,000 sessions (sample figures):
| Step | Designed next step | Sessions that took it | Biggest unplanned path |
|---|---|---|---|
| Sign-up form | Verify email | 7,400 (74%) | Back to pricing: 1,300 (13%) |
| Verify email | Create workspace | 6,100 of 7,400 (82%) | Left the session: 1,050 |
| Create workspace | Invite team | 2,900 of 6,100 (48%) | Skip to dashboard: 3,200 (52%) |
| Invite team | Dashboard | 2,500 of 2,900 (86%) | Left the session: 330 |
Three findings the diagram could not show:
- 13% went from the form back to pricing. The form asked for company size and phone number, which read as "a sales call is coming." Removing both fields cut that path to 5% and raised form completion from 74% to 81%.
- More than half skipped the invite step, and they were not worse users: their week-1 activation was 41% against 44% for those who invited. The invite screen became an optional prompt shown later, on the dashboard.
- 1,050 sessions ended at the verify screen. Many returned the next day through the email link, so the session-based path overstated the loss; counting by people instead of sessions showed a 9% real loss at that step, not 14%.
Overall, the share of sign-ups reaching the dashboard in the same session rose from 57% to 66% after the changes.
Signup flow · designed steps
Same session · 10,000 sign-up sessionsSign-up form
10,000
Email verified
7,400
Workspace created
6,100
Reached dashboard
5,700
Common mistakes
- Drawing only the happy path. Real users go back, skip and fail; the diagram should show what happens then.
- Mixing several goals in one flow. One diagram per task keeps it readable.
- Never checking against data. A flow diagram is a hypothesis until you compare it with actual paths.
- Counting sessions only. Flows that span an email or a day look worse by session than by person.
- Adding steps for internal reasons. Every extra field or screen costs completion; ask whether it can wait.
Validating user flows in TapCub
In All-platform analytics › Behavior › Behavior analysis, the paths model shows the most common pages, screens or events after a start point or before an end point, 2 to 10 steps, with drop-off at each step. Set the sign-up page as the start anchor, switch counting from sessions to people for flows that span days, and use clean-up rules to merge URLs with IDs into one node (Funnel, goal or path?). To measure completion through fixed steps, build a funnel (Build a funnel). Related reading: Customer journey map, Conversion paths and User friction.
Sources
- Nielsen Norman Group, User journeys vs. user flows.
Was this article helpful?
We use your answers to fix and expand this page.
Couldn’t send. Please try again in a minute.
Thanks for the feedback. We’ll use it to improve this page.You’ve already sent feedback on this page. Thanks.

Product Adoption Consultant
Explores customer onboarding, live conversations, and self-service, turning common usage questions into practical guidance and improvements.