Try it on your own data
Every report in this article is in the free plan. One snippet for web and apps, up to 10 sites.
Start freeA customer journey map shows the stages customers go through, what they do and feel at each one, and where they get stuck. This guide gives six steps to build one from research and analytics, a filled-in SaaS trial example, and a way to keep the map measured after the workshop.
What you will learn
- Map one customer type and one scenario, in stages named from their point of view
- Put a number on every stage, then use interviews and replays to explain the worst drop
- Define stages as pages or events so the map can be measured every week
What a customer journey map is
A customer journey map is a one-page picture of how a type of customer gets from first hearing about you to the outcome they wanted. It is laid out in stages (for example discover, evaluate, sign up, get value, buy), and for each stage it shows what the customer is trying to do, where they interact with you (the touchpoints), what they think and feel, and what goes wrong.
The map is useful because no one inside a company sees the whole journey. Marketing sees the ad and the landing page, product sees onboarding, support sees the problems. The map puts them side by side, so the team can agree where the biggest problem is.
A map built only in a workshop records what the team believes happens. Adding a number to every stage records what actually happens. You need both: research explains why, data shows how many.
How to create one in six steps
- Pick one customer and one scenario. "A marketing lead at a 20-person company evaluating us for the first time" is a journey; "all users" is not. Different customers take different routes, so one map per main segment.
- Set the stages from the customer's point of view. Name them by what the customer is doing, not by your department. Four to seven stages is usually enough.
- List touchpoints per stage. Pages, emails, ads, sales calls, docs, chat, the product itself. Use your analytics to find the pages and events people actually hit in each stage, not just the ones you designed.
- Put a number on each stage. How many people reach it, how many move on, how long it takes. This is where drop-off becomes visible.
- Add the why. Interview five to ten customers who went through it recently, read support conversations, look at session replays or heatmaps on the stage with the worst drop. Write down their goals, questions and frustrations in their words.
- Mark the moments that matter and give each an owner. Circle the one or two stages where the most people are lost or the most frustration shows up, and assign someone to each.
A filled-in example: a SaaS free trial
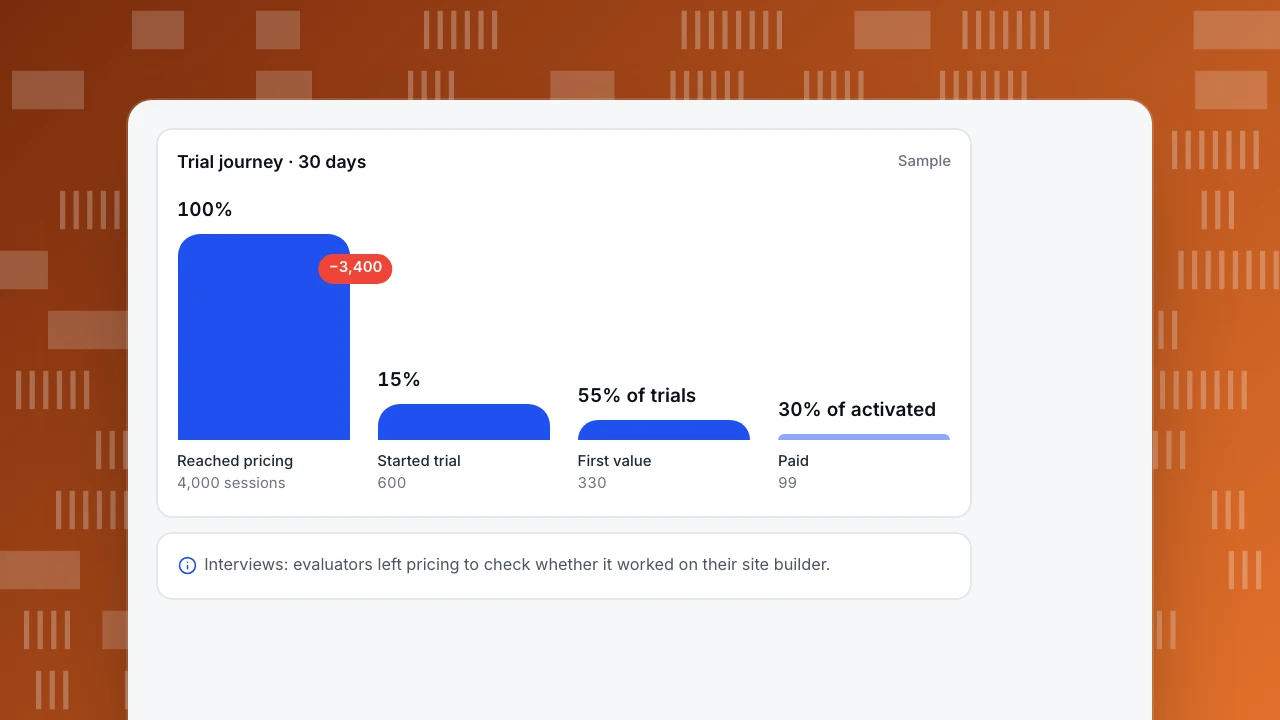
The sample below follows evaluators of a B2B tool through 30 days. Of 4,000 sessions that reached the pricing page, 600 started a trial (15%). Of those, 330 reached first value, which for this product means installing the tracking code and seeing data (55% of trials). Of the activated accounts, 99 paid (30%).
The biggest absolute loss is between pricing and sign-up, but the research column changes the story. Interviews showed that evaluators who left pricing mostly wanted to know whether the tool worked on their site builder before signing up. A short "works with" section and an install guide link on the pricing page addressed the question at the point it was asked. The second problem, trials that never installed, pointed at onboarding: people who had to ask a developer stalled for days.
Trial journey · 30 days
SampleReached pricing
4,000 sessions
Started trial
600
First value
330
Paid
99
Template: what to fill in per stage
Copy this layout for each stage of your own map. The last column is the one teams usually skip and the one that turns the map into a plan.
| Field | What to write | Sample: "Sign up" stage |
|---|---|---|
| Customer goal | What they are trying to get done | Try it on my own site without a sales call |
| Touchpoints | Pages, emails, people, product screens | Pricing page, sign-up form, welcome email |
| Actions | What they actually do (from analytics) | Read pricing, open install docs, start trial |
| Number | Reach and move-on rate | 600 of 4,000 pricing sessions (15%) |
| Thoughts and feelings | Their words from interviews and chats | "Will this work on Webflow?" |
| Pain points | What blocks or annoys them | Site-builder support not visible on pricing |
| Owner and next step | Who fixes it, what they try first | Marketing: add a works-with block and install link |
Sample content. One table per stage, or one column per stage on a wide canvas.
Turn the map into something you measure
A map on a wall goes stale in a quarter. Make the stages measurable so you can check them every week:
- Define each stage as pages or events. "Evaluate" = pricing page or comparison pages; "first value" = the event that marks it, such as a first report viewed. See how to measure product adoption for picking that event.
- Use a journey report for in-session stages. In TapCub, journey maps take up to 20 stages, each defined by page patterns or events, and show reach, the move to the next stage, and a sentiment score built from errors, rage clicks and exits on that stage. Reach is counted per session.
- Use a funnel for stages days apart. Discover-to-buy rarely happens in one visit. A funnel with a conversion window (up to 180 days in TapCub) counts people who complete the steps over several sessions.
- Review it with the owners. A monthly look at the stage numbers and a few new interviews keep the map honest.
FAQ
What is the difference between a customer journey map and a user flow?
A journey map covers the whole relationship across channels, including feelings and offline steps. A user flow is the sequence of screens for one task inside the product. A journey stage often contains several flows.
How many customer journey maps do I need?
One per main segment whose route differs: self-serve versus sales-led, or new versus returning customers. Start with the segment that brings most revenue.
What data do I need for a customer journey map?
Stage reach and drop-off from analytics, time between stages, top pages and events per stage, plus qualitative input: interviews, support conversations and survey answers.
How often should a journey map be updated?
Check the numbers monthly and revisit the whole map when the product, pricing or main acquisition channel changes.
See also: User flow.
See also: Customer journey optimization, SaaS customer journey.
Was this article helpful?
We use your answers to fix and expand this page.
Couldn’t send. Please try again in a minute.
Thanks for the feedback. We’ll use it to improve this page.You’ve already sent feedback on this page. Thanks.

Product Adoption Consultant
Explores customer onboarding, live conversations, and self-service, turning common usage questions into practical guidance and improvements.