Try it on your own data
Every report in this article is in the free plan. One snippet for web and apps, up to 10 sites.
Start freeThe customer lifecycle is the set of stages a person passes through with your business: reach, acquisition, activation, retention and loyalty. Lifecycle metrics give each stage one number, so you can see where people stall. This guide gives a metric and formula per stage, a sample scorecard and a way to see movement between stages.
What you will learn
- Choose one primary metric per stage and define it from events
- Read stages as a chain: a drop in one shows up in the next stage weeks later
- Track movement between states (new, returning, resurrecting, dormant), not only totals
What customer lifecycle metrics are
Customer lifecycle metrics measure how people move through the stages of their relationship with you. Most models use some version of reach, acquisition, activation, retention, revenue and loyalty. The AARRR framework is one well-known version.
The point is not the number of metrics. It is having one clear number per stage, so a problem can be traced to where it starts.
Stages and their metrics
The table gives one primary metric per stage and how to calculate it. Each needs an event behind it: a sign-up event for acquisition, a key-action event for activation, any activity for retention, a purchase for revenue.
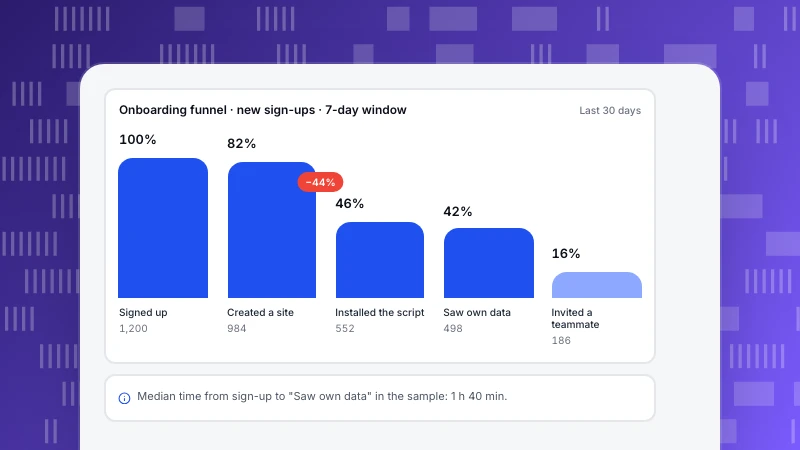
Activation is the stage most teams skip. Define it as the action that predicts people staying, then measure the share of new sign-ups who do it within a fixed window. See onboarding metrics.
| Stage | Metric | How to calculate |
|---|---|---|
| Reach | New visitors | Distinct first-time visitors in the period |
| Acquisition | Sign-up rate | Sign-ups ÷ new visitors |
| Activation | Activation rate | Sign-ups who complete the key action within 7 days ÷ sign-ups |
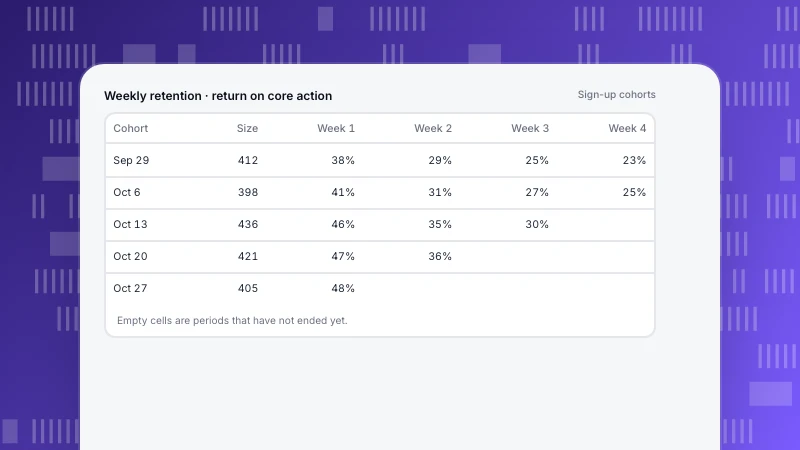
| Retention | Week-4 retention | Share of a weekly cohort active in week 4 |
| Revenue | Paid conversion, ARPU | Paying customers ÷ active; revenue ÷ paying customers |
| Loyalty | Repeat or referral rate | Customers with 2+ purchases or a referral ÷ customers |
Pick one definition per metric and keep it stable.
Read stages as a chain
Stages feed each other. If activation falls in March, retention will look worse in April and revenue in May. When a later metric drops, look one or two stages earlier first.
A sample scorecard
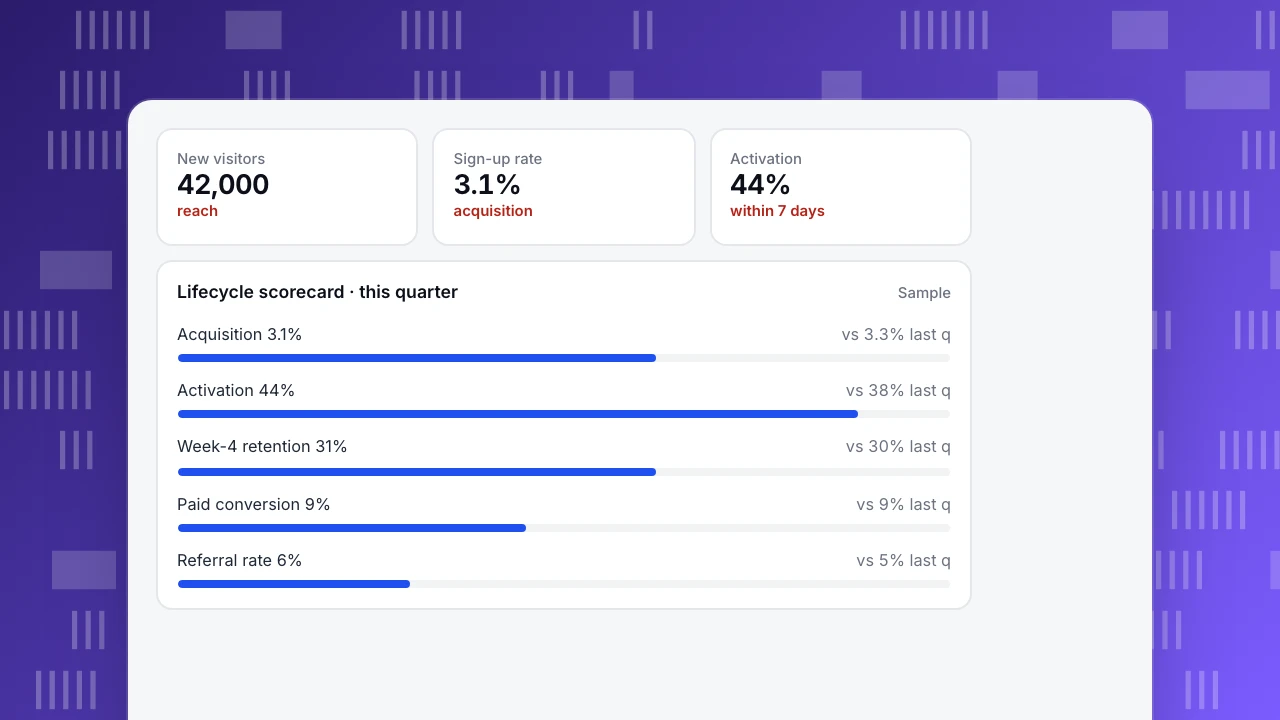
The scorecard shows one quarter for a subscription product. Activation rose from 38% to 44% after the team shortened setup. Retention moved only one point so far, which is expected: the newly activated cohorts are still young.
New visitors
42,000
reach
Sign-up rate
3.1%
acquisition
Activation
44%
within 7 days
Lifecycle scorecard · this quarter
SampleMovement between states
Totals hide churn and return. A count of active customers can stay flat while many leave and many come back. Lifecycle states make that visible. In TapCub, each week or month splits active people into:
- New: first seen in the period.
- Returning: also active in the previous period.
- Resurrecting: active before, but not in the previous period.
- Dormant: active in this period, absent in the next.
A growing dormant bar with a steady total means you are replacing customers rather than keeping them.
Common mistakes
- Too many metrics per stage, none of them owned.
- Changing a definition mid-quarter and comparing across the change.
- Measuring activation without a time window, so it keeps creeping up.
FAQ
What are the stages of the customer lifecycle?
Commonly reach, acquisition, activation, retention, revenue and loyalty or referral. Some models merge or rename stages; what matters is a consistent definition.
What is the difference between lifecycle metrics and funnel metrics?
A funnel measures steps within one flow, often one session. Lifecycle metrics measure stages across weeks or months of a customer relationship.
How often should I review lifecycle metrics?
Weekly for acquisition and activation, monthly for retention and revenue, since those need time to settle.
Was this article helpful?
We use your answers to fix and expand this page.
Couldn’t send. Please try again in a minute.
Thanks for the feedback. We’ll use it to improve this page.You’ve already sent feedback on this page. Thanks.

Data Engineer
Writes about event design, data quality, and collection workflows, with verifiable implementation methods for reliable analytics.