Try it on your own data
Every report in this article is in the free plan. One snippet for web and apps, up to 10 sites.
Start freeMost acquisition reports stop at traffic, which is the one number that cannot tell a good channel from a bad one. This guide groups acquisition metrics into volume, quality and cost, measures them per channel, and explains why two tools never agree on where your customers came from.
What you will learn
- Acquisition metrics come in three layers: volume, quality and cost
- Measure every channel down to sign-ups and paying customers, not visits
- Channel numbers differ by scope, rules and missing tags; pick one scope per question
What acquisition metrics measure
Acquisition metrics describe how people find you and what it costs to bring them in. In the AARRR framework acquisition is the top stage, and the temptation is to measure it with traffic alone. Traffic is the least useful acquisition number: it tells you nothing about whether the people who came were the ones you wanted.
Useful user acquisition metrics answer three questions per channel: how many people came, how many of them became something (a sign-up, a lead, a customer), and what each of those cost.
Three layers of acquisition metrics
The table groups the common acquisition metrics into volume, quality and cost. Read them together: volume without quality is noise, and cost without quality rewards the cheapest, worst traffic.
Two definitions worth fixing before you report:
- CAC is spend divided by new customers, not new sign-ups. Cost per sign-up is a different, earlier number; label it as such.
- CAC payback is CAC divided by monthly gross margin per customer. It needs revenue data, so it belongs in the cost layer only once payments are tracked.
| Layer | Metric | Formula |
|---|---|---|
| Volume | Visitors by channel | Unique visitors per channel |
| Volume | New sign-ups by channel | Sign-ups credited to each channel |
| Quality | Sign-up rate | Sign-ups ÷ visitors, per channel |
| Quality | Activation rate | Activated ÷ sign-ups, per channel |
| Cost | Cost per sign-up | Channel spend ÷ sign-ups |
| Cost | CAC | Spend ÷ new paying customers |
| Cost | CAC payback | CAC ÷ monthly gross margin per customer |
Report cost per sign-up and CAC separately; they answer different questions.
Measure acquisition per channel
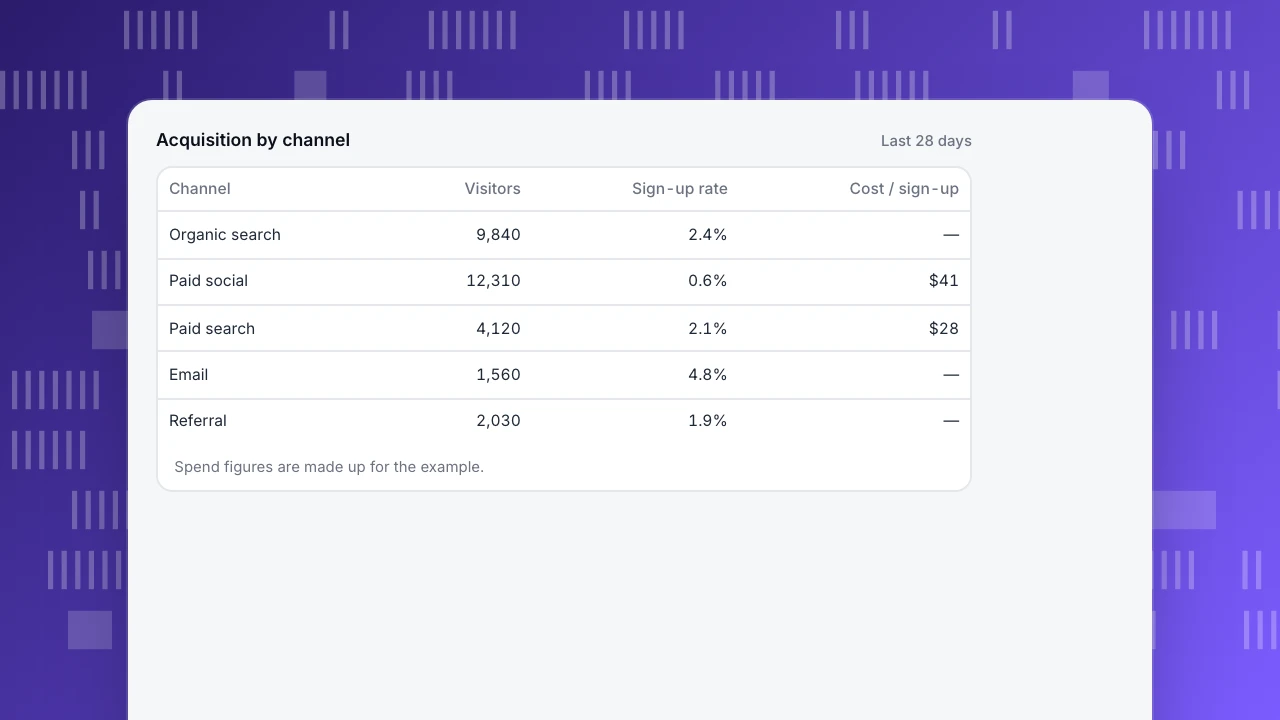
The same metrics, split by channel, are where decisions come from. In the example, paid social brings the most visitors at the lowest cost per visit, and the worst sign-up rate. Organic search brings fewer visitors with no media cost and converts best. Email is small and converts well because it reaches people who already know you.
A per-channel table like this changes the conversation from "we need more traffic" to "which channel gives us customers at a cost we can afford". It also shows when a channel's quality changes: a sudden drop in sign-up rate from one channel usually means targeting or the landing page changed.
Acquisition by channel
Last 28 days| Channel | Visitors | Sign-up rate | Cost / sign-up |
|---|---|---|---|
| Organic search | 9,840 | 2.4% | — |
| Paid social | 12,310 | 0.6% | $41 |
| Paid search | 4,120 | 2.1% | $28 |
| 1,560 | 4.8% | — | |
| Referral | 2,030 | 1.9% | — |
Spend figures are made up for the example.
Why channel numbers disagree
Two tools rarely agree on channels, and even one tool can show different totals depending on the view. The usual reasons:
- Scope. A user-scoped dimension credits the channel that first brought someone; a session-scoped one credits the channel of each visit (Google: scopes of traffic-source dimensions). The same sign-up can be "organic" in one report and "email" in another.
- Channel rules. Each tool has its own channel grouping rules (Google: default channel group). A link tagged
utm_medium=social-paidmay land in "paid social" in one tool and "other" in another. - Missing tags. Untagged emails, app links and private messages arrive without a referrer and fall into direct. Consistent UTM parameters fix most of it; the UTM builder helps keep names consistent.
- Click IDs. Ad platforms add click IDs such as
gclid. A tool that reads them can classify paid visits even when UTM tags are missing.
Pick one scope for each question (first touch for "where do customers come from", session for "which campaigns drive visits") and keep it.
A weekly acquisition routine
- Look at sign-ups and paying customers by channel for the week, not visitors.
- Check sign-up rate by channel against the previous four weeks; investigate any drop larger than normal variation.
- Compare cost per sign-up with the target per channel; move budget from the worst to the best only after two consistent weeks.
- Check the share of direct traffic. If it grows while campaigns run, tags are missing somewhere.
- Once a month, review CAC and payback per channel with revenue data and LTV.
Acquisition metrics in TapCub
TapCub's sources report groups traffic by channel using UTM, the referring host and click IDs; rules you add for the site take priority over the defaults. Visits with gclid, msclkid, wbraid, gbraid, yclid or bd_vid count as paid search, visitors arriving from an AI product form their own channel, and visits with no source are direct (sources and channels).
Channels and referrers can be counted two ways: by the first source of each session (the default) or by every arrival, which also counts arrivals from an external site in the middle of a session. Each channel row has visitors, sessions, pageviews, bounce and duration, and the channel table also shows conversions. Click a row to filter every other report by that channel, for example a sign-up funnel for paid social only. The AARRR guide covers where acquisition fits among the other stages.
FAQ
What are acquisition metrics?
Numbers that describe how people find you and what it costs: visitors and sign-ups by channel, conversion rate by channel, cost per sign-up, CAC and CAC payback.
What is the difference between user and customer acquisition metrics?
User acquisition metrics count people who sign up or install. Customer acquisition metrics count people who pay. CAC uses customers; cost per sign-up uses users.
Which acquisition metric matters most?
The one closest to revenue that you can measure reliably per channel. For most teams that is sign-ups (or qualified leads) by channel, then CAC once payments are tracked.
Why is so much traffic "direct"?
Visits without a referrer or tags land in direct: untagged emails, links in apps and chat, bookmarks and some redirects. Tag every link you control.
How often should acquisition metrics be reviewed?
Volume and quality weekly, cost and payback monthly, because spend and revenue data usually arrive more slowly than traffic data.
See also: User acquisition.
See also: Product vs marketing analytics.
Was this article helpful?
We use your answers to fix and expand this page.
Couldn’t send. Please try again in a minute.
Thanks for the feedback. We’ll use it to improve this page.You’ve already sent feedback on this page. Thanks.

Growth Strategist
Explores acquisition channels, activation, and conversion experiments, turning data insights into actionable growth hypotheses and evaluation methods.