Try it on your own data
Every report in this article is in the free plan. One snippet for web and apps, up to 10 sites.
Start freeEngagement metrics promise to tell you whether people care, and most of them only tell you that something happened. This guide separates session engagement from user engagement, lists the metrics with their formulas and blind spots, shows how engaged sessions are counted, and suggests one metric per kind of page.
What you will learn
- Session engagement (sites) and user engagement (products) answer different questions
- Every engagement metric hides something; pair it with one that covers the gap
- Compare engagement between pages with the same job, and check it moves conversions
Two kinds of engagement metrics
"Engagement" is used for two different things, and most confusion about engagement metrics comes from mixing them:
- Session engagement asks whether a visit was more than a glance. It is what web analytics measures: engaged sessions, engaged rate, pages per session, duration, scroll depth.
- User engagement asks whether a person keeps using the product. It is what product analytics measures: active users, DAU/MAU, frequency, feature usage, retention.
A content site lives on the first kind. A SaaS product lives on the second, and uses the first only for its marketing site. Decide which question you are asking before picking metrics.
The engagement metrics, with formulas
The table lists the common engagement metrics, how each is calculated and, more importantly, what each one hides. No single metric is complete; the useful habit is to pair one of them with a metric that covers its blind spot.
A few notes on the formulas:
- Duration is measured from the first to the last recorded event of a session, so a single-page visit with no further events has a duration of zero, however long the person read. That is why duration alone underrates content pages.
- DAU/MAU (stickiness) only makes sense for products people are meant to use often. A tax tool with 5% stickiness can be healthy.
- Feature usage needs events: someone has to decide which actions count, which is what an event tracking plan is for.
| Metric | Formula | What it misses |
|---|---|---|
| Engaged rate | Engaged sessions ÷ sessions | Treats 11 seconds and 11 minutes the same |
| Pages per session | Pageviews ÷ sessions | Rewards pagination and confusing navigation |
| Average duration | Session time ÷ sessions | Last page has no end time; single-page visits read as zero |
| Scroll depth | Share reaching 50% / 90% | Scrolling is not reading |
| DAU/MAU | Daily active ÷ monthly active | Penalises products meant for weekly use |
| Feature usage | Users doing X ÷ active users | Needs a decision on which events count |
| Retention | Users returning in period N ÷ cohort | Slow to move; reacts weeks after a change |
Pair a session metric with a product or conversion metric.
How engaged sessions are counted
An engaged session is a session that passed a minimum bar of attention. Google Analytics 4 counts a session as engaged when it lasts longer than 10 seconds, has a key event, or has at least two page or screen views; engagement rate is engaged sessions divided by sessions (Google Analytics Help: engagement).
That definition makes engagement rate roughly the opposite of bounce rate, and it inherits a weakness of bounce: the 10-second threshold. A reader who spends three minutes on one article and leaves is engaged; a visitor who opens the page in a background tab and closes it later may be too. Treat the engaged rate as a filter for empty visits, not as a measure of interest.
Compare engagement by page type
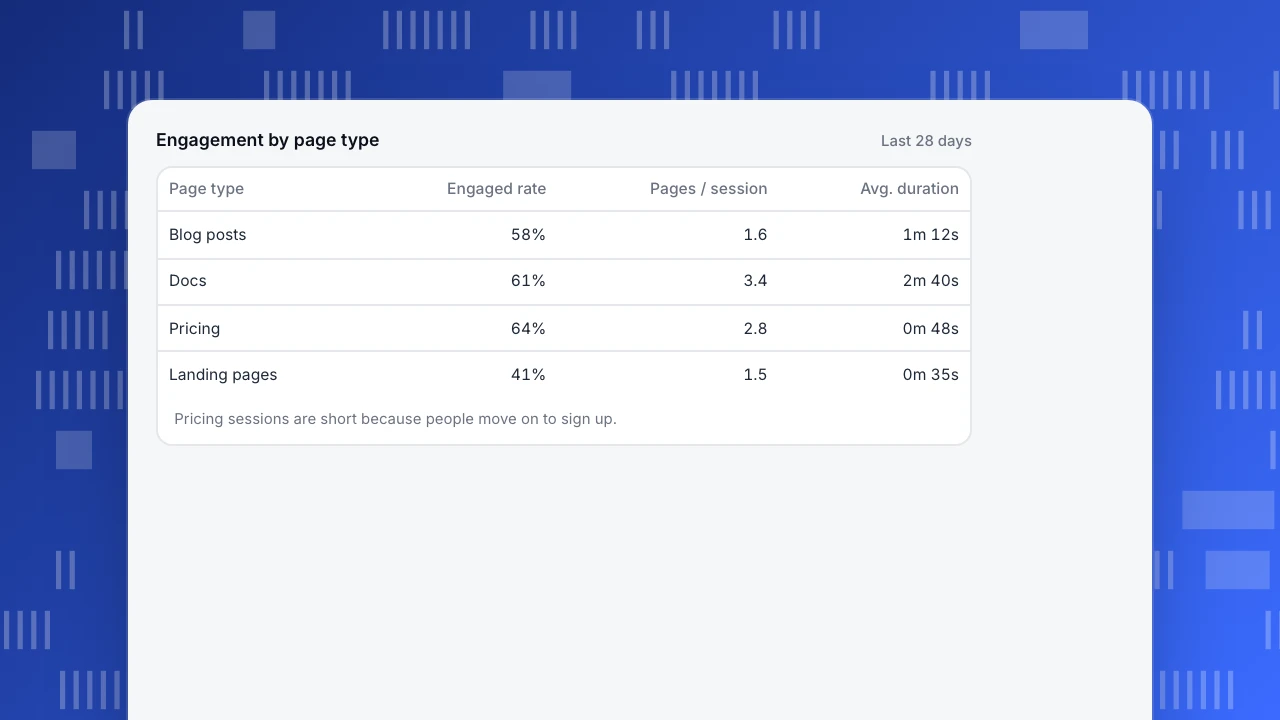
Engagement metrics become useful when you compare pages that have the same job. In the example, blog posts have a lower pages-per-session figure than docs but a similar engaged rate, because people read one article and leave. Pricing has the shortest duration and the highest share of sessions that reach the sign-up page, which is what a pricing page is for. Comparing the pricing page's duration with a blog post's would point you in the wrong direction.
Engagement by page type
Last 28 days| Page type | Engaged rate | Pages / session | Avg. duration |
|---|---|---|---|
| Blog posts | 58% | 1.6 | 1m 12s |
| Docs | 61% | 3.4 | 2m 40s |
| Pricing | 64% | 2.8 | 0m 48s |
| Landing pages | 41% | 1.5 | 0m 35s |
Pricing sessions are short because people move on to sign up.
Pick one engagement metric per surface
- Content and blog: engaged rate plus scroll depth or a "read to the end" event. Duration only as a tie-breaker.
- Landing and pricing pages: click-through to the next step (sign-up, contact, cart). Engagement here means moving on.
- Docs and help: engaged rate plus searches without a click, which shows what people could not find.
- Product: weekly active users who did the core action, plus retention. DAU/MAU only if daily use is the goal.
How to increase user engagement
Raise engagement by removing reasons to leave, not by making people click more:
- Match the promise. Low engaged rate on a landing page usually means the page does not match the ad or search result. Fix the headline before the design.
- Give a next step. Related posts, a clear call to action and links to the next doc keep people who wanted more.
- Shorten the time to value. In a product, the earlier someone does the core action, the more likely they return.
- Do not inflate. Splitting articles into pages or adding "read more" gates raises pages per session and lowers satisfaction. If a change moves the metric but not conversions or retention, it moved the metric only.
Engagement metrics in TapCub
TapCub reports engaged rate, average duration, pages per session and bounce rate for websites, all defined in the metric definitions. A session is engaged if it lasts at least 10 seconds or has at least two pageviews; a hit on an event goal marked as a key event also counts. If no goal is marked as a key event, the rule is in practice only "10 seconds or 2 pages".
For apps, an engaged session lasts at least 10 seconds, includes at least two screens or includes a key event, and the report shows engaged sessions per active user (app metrics). Product-side engagement (frequency, feature usage, retention) comes from custom events; see the analytics metrics guide for how these fit with traffic and conversion metrics.
FAQ
What are engagement metrics?
Measurements of how much attention or use something gets: for websites, engaged sessions, pages per session and duration; for products, active users, frequency, feature usage and retention.
What is an engaged session?
A session that meets a minimum bar: in GA4 and TapCub, at least 10 seconds, at least two pages or screens, or a key event.
What is a good engagement rate?
It depends on page type and traffic source. Compare pages with the same purpose, and compare with your own history rather than with a published average.
Is time on site a good engagement metric?
Only as a secondary one. It misses the last page of each visit and reads short, successful visits (such as finding a phone number) as failures.
How do I increase user engagement?
Make sure each page delivers what brought people there, give a clear next step and shorten the time to the core action. Check that conversions or retention rise with the engagement metric.
See also: Improve website engagement.
Was this article helpful?
We use your answers to fix and expand this page.
Couldn’t send. Please try again in a minute.
Thanks for the feedback. We’ll use it to improve this page.You’ve already sent feedback on this page. Thanks.

Product Experience Specialist
Explores usability, user journeys, and feature adoption through practical examples of onboarding and everyday product use.