Try it on your own data
Every report in this article is in the free plan. One snippet for web and apps, up to 10 sites.
Start freeWebsite engagement is how actively visitors interact with a site, and the right measure depends on the page: a guide should lead somewhere, a checkout should be quick. This guide lists the engagement metrics, twelve tactics, a four-step process and an example where contextual links, a checklist and removing a pop-up quadrupled newsletter sign-ups from the same traffic.
What you will learn
- Define the next meaningful step for each page type
- Read engagement metrics together, not alone
- Answer first, then link to the logical next step
- Diagnose with scroll and click heatmaps
- Remove friction: slow pages, broken links, intrusive pop-ups
What is website engagement?
Website engagement describes how actively visitors interact with a site after they arrive: whether they read, scroll, click through to related content, use tools, watch, sign up or come back. High engagement means visitors find the site useful enough to spend attention on it; low engagement means they leave before getting what they came for.
Engagement is a means, not a goal. More time on page is good on a guide and bad on a checkout. The useful definition is "visitors taking the next meaningful step for this page", and every page type has a different next step.
How to measure website engagement
| Metric | Definition | Good sign when |
|---|---|---|
| Engaged session rate | Sessions that last 10 s+, view 2+ pages or trigger a key event ÷ sessions | It rises on content and landing pages |
| Bounce rate | Single-page sessions with no interaction ÷ sessions | It falls on pages meant to lead somewhere |
| Scroll depth | Share of visitors reaching 50% and 90% of the page | Key content is seen |
| Pages per session | Pageviews ÷ sessions | Visitors explore related content |
| Return visitor rate | Returning visitors ÷ all visitors | The site earns repeat visits |
| Micro-conversions | Newsletter sign-ups, downloads, video plays, tool uses | Visitors take steps toward the main goal |
Read them together and by page type. A blog post with low pages per session but high scroll depth and newsletter sign-ups is doing its job.
12 ways to improve website engagement
- Match the page to the intent that brought people in. The headline and first paragraph should answer the search query or ad promise.
- Load fast. Slow pages lose visitors before they engage; keep LCP under 2.5 s on mobile.
- Put the answer first. Lead with the conclusion, then the detail.
- Make pages scannable. Short paragraphs, descriptive headings, lists and tables.
- Use visuals that explain. Diagrams, annotated screenshots and charts, not decoration.
- Link to the logical next step. Related guides, the product page, a tool or a template, placed where readers finish a section.
- Add interactive tools. Calculators, checklists and templates turn readers into users.
- Offer one clear call to action per page section. Too many options cause none to be chosen.
- Improve on-site search. Visitors who search often convert more; poor results lose them.
- Personalize lightly. Show returning visitors where they left off or content related to what they read.
- Invite conversation where people hesitate. A chat entry or FAQ on pricing and comparison pages answers questions on the spot.
- Fix friction. Rage clicks, broken links, layout shifts and intrusive pop-ups all cut engagement.
A four-step process
1. Group pages by purpose
Guides, landing pages, product pages, pricing, help. Each group gets its own engagement metric and next step.
2. Find underperformers
Compare pages with similar traffic and purpose. Look for high bounce, low scroll depth or few clicks to the next step.
3. Diagnose with heatmaps and replays
Scroll maps show where attention stops; click maps show what people try to click; replays show confusion.
4. Change, annotate, compare
Change one element, annotate the date and compare four weeks before and after on matching days.
| Page type | Engagement goal |
|---|---|
| Guide / blog | Scroll to key sections, click to next step, subscribe |
| Landing page | Click the main CTA |
| Product page | View details, start trial or add to cart |
| Help article | Problem solved, no support contact |
| Pricing | Choose a plan or ask a question |
Time on page is good on guides and bad on checkouts.
Worked example: a guide that did not lead anywhere
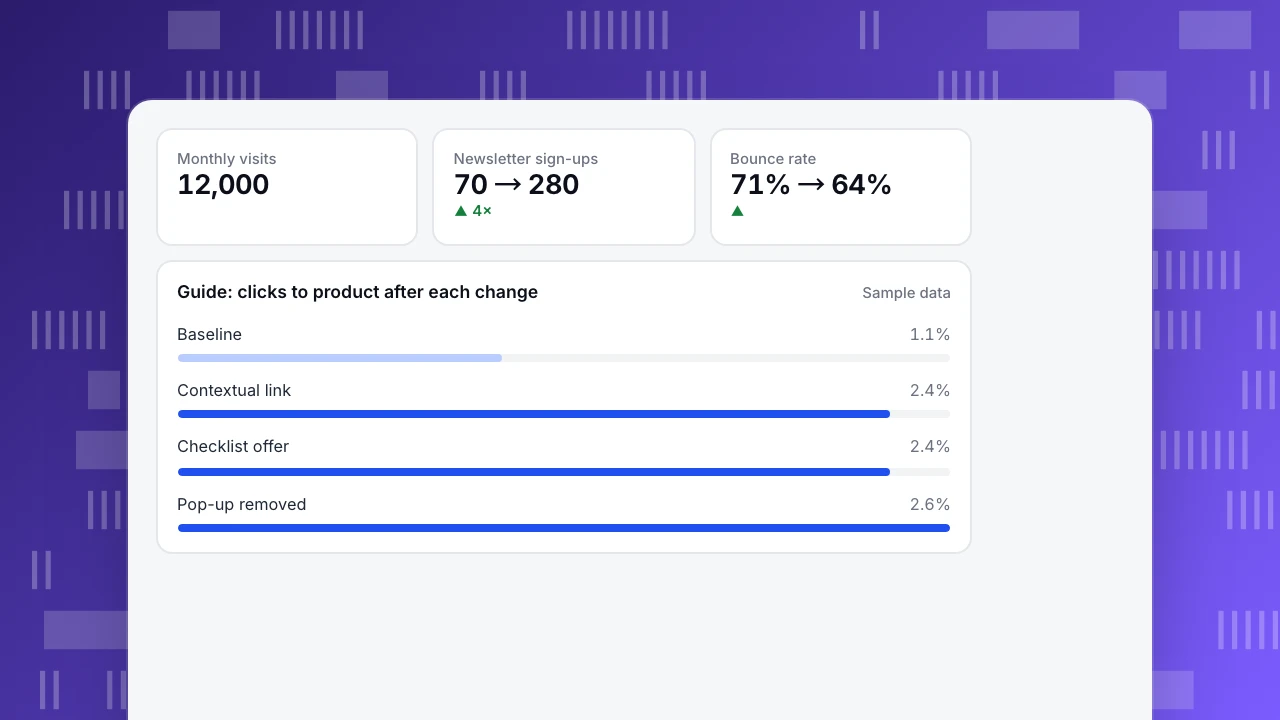
A software company's top guide (sample data) gets 12,000 visits a month from search. Scroll maps show 70% of visitors reach the end, but only 1.1% click to the product and 0.6% sign up for the newsletter.
| Change | Click to product | Newsletter sign-ups |
|---|---|---|
| Baseline: one CTA at the very bottom | 1.1% | 0.6% |
| Added a contextual link after the "how to measure" section | 2.4% | 0.6% |
| Added a downloadable checklist in exchange for email | 2.4% | 2.1% |
| Removed a full-screen pop-up shown after 5 seconds | 2.6% | 2.3% |
Product clicks more than doubled and newsletter sign-ups nearly quadrupled, from roughly 70 to 280 a month, without more traffic. Removing the pop-up also reduced bounce rate from 71% to 64%.
Monthly visits
12,000
Newsletter sign-ups
70 → 280
▲ 4×
Bounce rate
71% → 64%
▲
Guide: clicks to product after each change
Sample dataCommon mistakes
- Chasing time on page. Longer is not better if visitors are lost.
- One metric for all pages. A help article and a landing page have different goals.
- Engagement tricks. Auto-play videos, infinite pop-ups and split articles inflate numbers and annoy visitors.
- Ignoring mobile layout. Most engagement problems appear on small screens first.
- Not counting bots. Bot traffic distorts bounce and session metrics; filter it.
Measuring website engagement in TapCub
- Pages: bounce rate, time on page, exits and downstream pageviews (pageviews later in the same session) per page in Web analytics › Pages.
- Engaged sessions: sessions with meaningful activity; see engaged session.
- Scroll and clicks: track scroll depth, click and scroll heatmaps, rage clicks.
- Micro-conversions: set goals for sign-ups, downloads and tool use; see micro-conversions.
- Conversation: live chat on high-intent pages, with chat vs no-chat conversion.
- Bots: filtered automatically and shown separately.
Related: engagement metrics, how to reduce bounce rate, content performance metrics.
FAQ
What is a good website engagement rate? It depends on page type and traffic source. Compare similar pages on your own site and track the trend, rather than relying on a single benchmark.
How do I increase engagement on a blog? Answer the query early, make posts scannable, link to the logical next step, and offer a relevant download or tool.
Does website engagement affect SEO? Search engines aim to rank pages that satisfy searchers. Pages that answer the query well tend to both engage visitors and perform in search; engagement metrics in your analytics are not a direct ranking input.
Are pop-ups bad for engagement? Intrusive pop-ups that cover content, especially on mobile, often increase bounce. Inline offers placed after useful content usually perform better.
Sources
- Google Search Central. Avoid intrusive interstitials and dialogs.
- Nielsen Norman Group. How users read on the web.
- web.dev. Web Vitals.
Was this article helpful?
We use your answers to fix and expand this page.
Couldn’t send. Please try again in a minute.
Thanks for the feedback. We’ll use it to improve this page.You’ve already sent feedback on this page. Thanks.

Product Experience Specialist
Explores usability, user journeys, and feature adoption through practical examples of onboarding and everyday product use.