Try it on your own data
Every report in this article is in the free plan. One snippet for web and apps, up to 10 sites.
Start freeImproving app performance means faster starts, smooth scrolling, fewer crashes and ANRs, and graceful behavior on slow networks, measured on real devices. This guide lists the metrics and their targets, eight concrete steps, and a startup trace where deferring SDKs and decoding images at view size cut the median cold start from 3.4 to 1.6 seconds.
What you will learn
- Measure performance from real devices, then profile in the lab
- Defer everything the first screen does not need
- Keep disk, parsing and network off the main thread
- Watch the median and the 90th percentile, not averages
- Track every release so regressions show up early
What does it mean to improve app performance?
Improving app performance means making a mobile app start faster, respond to touches without delay, scroll smoothly, use less memory and battery, and handle slow networks gracefully, measured on the devices your users actually have. It is a narrower job than general app optimization: the goal is not more sign-ups directly, but removing the technical reasons people give up before they get there.
Performance work starts with measurement. Without a baseline from real devices you cannot tell whether a change helped, and you will optimize what is easy to see on a developer's phone instead of what hurts users on a three-year-old mid-range device.
The mobile app performance metrics that matter
| Metric | What it measures | Typical target | Notes |
|---|---|---|---|
| Cold start time | Process launch to first frame drawn | Under 2 s for most apps; Android vitals flags 5 s or more | Most affected by work in Application/AppDelegate init |
| Warm and hot start | Return from background to usable screen | Under 1 s | Slow hot starts often come from re-fetching data |
| Frame rendering (jank) | Share of frames that miss the display deadline | Few slow or frozen frames | 60 Hz gives 16.7 ms per frame |
| ANR rate (Android) | Main thread blocked for 5 s or more on input | Below 0.47% of users (Android vitals bad-behavior threshold) | iOS equivalent: hangs |
| Crash-free users | 1 − users who crashed ÷ active users | 99.5% or higher is a common goal | Track per version |
| Memory | Peak and average memory per session | Stable, no growth over a session | Growth suggests leaks |
| Network | Request latency, error rate, payload size | Depends on API | Test on throttled 3G/4G |
| App size | Download and install size | As small as practical | Larger apps install less on cellular |
How to improve app performance in eight steps
1. Measure in the field, not only in the lab
Lab tools (Android Studio Profiler, Xcode Instruments, Macrobenchmark) find causes; field data from real users tells you where the problem is and how big it is. Collect cold start, crashes, ANRs and memory from production builds, split by device model, OS version and app version.
2. Cut cold start work
List everything that runs before the first frame: SDK initialization, database migrations, config fetches, dependency injection graphs. Defer anything not needed for the first screen to after the first frame or to first use. On Android, Baseline Profiles let the runtime precompile hot code paths.
3. Keep the main thread free
Move disk access, JSON parsing, image decoding and network calls off the main thread. On Android enable StrictMode in debug builds to catch accidental main-thread I/O; on iOS use the Main Thread Checker and hang reporting.
4. Fix rendering jank
Flatten deep view hierarchies, avoid layout passes inside scroll callbacks, use recycled lists, and size images to the view instead of decoding full-resolution files. Profile the screens with the highest share of slow frames first.
5. Control memory
Release large bitmaps when screens disappear, cap in-memory caches, and look for leaks in long sessions. Out-of-memory kills often appear as crashes on low-RAM devices only.
6. Make the network forgiving
Cache responses, request only the fields a screen needs, compress payloads, set timeouts and retries with backoff, and show cached content while refreshing. Test every critical flow on a throttled connection.
7. Shrink the app
Remove unused resources and libraries, use Android App Bundles and asset catalogs so devices download only what they need, and compress images.
8. Guard against regressions
Add startup and frame benchmarks to CI, and compare field metrics for every release in its first days. Performance regresses one dependency at a time.
| Problem | Likely cause | First fix |
|---|---|---|
| Slow cold start | SDK init and blocking fetches on launch | Defer to after first frame |
| Janky scrolling | Full-size image decoding, deep layouts | Decode at view size, flatten views |
| ANRs | Disk or network on main thread | Move work to background threads |
| Crashes on low-RAM devices | Memory pressure, leaks | Release bitmaps, cap caches |
Find the slow screen with field data first, then reproduce it with a profiler.
Worked example: halving a cold start
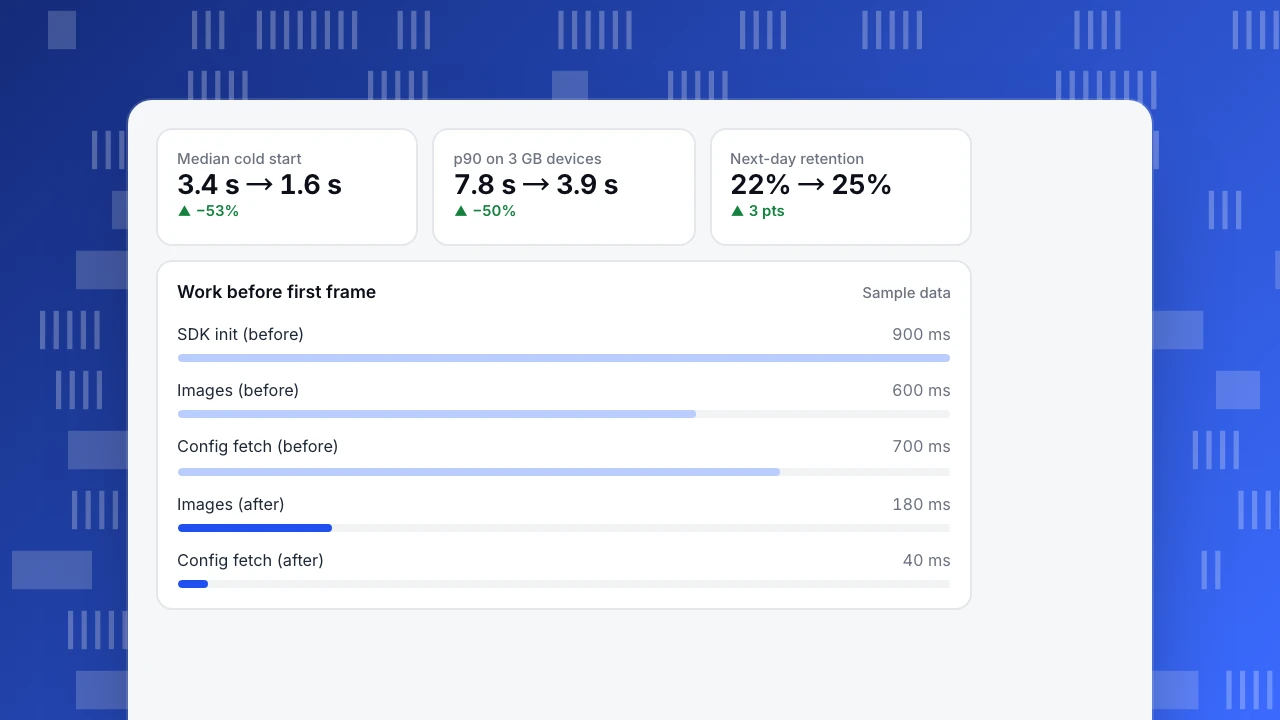
A shopping app (sample data) had a median cold start of 3.4 s on Android, and 7.8 s at the 90th percentile on devices with 3 GB of RAM. A startup trace showed:
| Work on launch | Time before | Change | Time after |
|---|---|---|---|
| Three analytics and ads SDKs initialized | 900 ms | Initialized after first frame | 0 ms before first frame |
| Remote config fetch, blocking | 700 ms | Use cached config, refresh in background | 40 ms |
| Database migration check | 350 ms | Moved to background thread | 0 ms on main thread |
| Home feed images decoded at full size | 600 ms | Decode at view size | 180 ms |
Median cold start fell from 3.4 s to 1.6 s, and the 90th percentile on 3 GB devices from 7.8 s to 3.9 s. Next-day retention for new Android users in the two weeks after the release rose from 22% to 25%; other changes shipped in the same release, so the startup fix is a likely but not proven cause.
Median cold start
3.4 s → 1.6 s
▲ −53%
p90 on 3 GB devices
7.8 s → 3.9 s
▲ −50%
Next-day retention
22% → 25%
▲ 3 pts
Work before first frame
Sample dataCommon mistakes
- Testing on a flagship phone over office Wi-Fi. The slowest 10% of your users are on very different hardware and networks.
- Looking at averages. Use the median and the 90th percentile; averages hide the long tail that drives uninstalls.
- Initializing every SDK on launch. Third-party SDKs are a frequent cause of slow cold starts.
- Fixing performance once. Without per-release tracking, new code brings the problem back.
- Ignoring crash and ANR clusters by device. One device family can account for most problems.
Tracking app performance in TapCub
TapCub's mobile SDKs report app starts and, where the platform supports it, crashes and performance samples:
- App analytics › Quality & attribution › Stability shows crash-free users, crashes, ANRs and UI freezes, plus the median cold start, hot start and memory, with error groups you can mark resolved.
- Devices splits active users by model, OS version, resolution and network, so you can see whether a problem sits on a device family.
- Versions & channels shows crashes per version to catch release regressions. See track app versions and crash-free rate.
Two notes from the documentation: cold start time comes from the duration on the start event, so it stays empty if the SDK adapter does not set it; and the frame-rate chart needs performance sampling turned on. TapCub is an analytics tool, not a profiler: use Android Studio or Xcode to find the code that causes a slowdown.
FAQ
What is a good cold start time for a mobile app? Aim for under two seconds at the median on mid-range devices. Android vitals considers cold starts of five seconds or longer excessive.
What is the difference between a cold, warm and hot start? A cold start launches the app process from scratch. A warm start reuses the process but recreates the activity or screen. A hot start brings an app that is still in memory back to the foreground.
How do I find what slows down my app? Use field data to find which screen, version or device is slow, then reproduce it with a profiler (Android Studio Profiler, Xcode Instruments) to find the code responsible.
Do analytics SDKs slow down apps? Any SDK initialized on launch adds work before the first frame. Initialize analytics asynchronously and defer non-essential SDKs until after the first screen.
Sources
- Android Developers. App startup time.
- Android Developers. Android vitals.
- Apple Developer. Reducing your app's launch time.
- Android Developers. Baseline Profiles overview.
Was this article helpful?
We use your answers to fix and expand this page.
Couldn’t send. Please try again in a minute.
Thanks for the feedback. We’ll use it to improve this page.You’ve already sent feedback on this page. Thanks.

Technical Engineer
Focuses on tracking code, SDKs, and API integrations, with practical guidance on implementation checks and troubleshooting.