Try it on your own data
Every report in this article is in the free plan. One snippet for web and apps, up to 10 sites.
Start freeImplementing web analytics means getting trustworthy data from your site into an analytics tool: a tracking plan, installation, events and goals, data hygiene, privacy and verification. This guide gives an eight-phase plan with owners and a verification example where a duplicate goal and a missing single-page route explained a 75% gap between analytics and the backend.
What you will learn
- Start from business questions, then write a tracking plan
- Count single-page app route changes as pageviews
- Exclude internal traffic and filter bots
- Decide consent needs per market
- Verify conversions against your backend
What does implementing web analytics involve?
Implementing web analytics is the work of getting trustworthy data from your website into an analytics tool and making it useful: deciding what to measure, installing the tracking script, configuring events and goals, excluding noise such as bots and internal visits, meeting privacy requirements, and verifying that the numbers match reality. Installation takes minutes; a good implementation is the plan and checks around it.
A weak implementation is expensive in a quiet way. Decisions get made on duplicate conversions, missing pages or traffic inflated by your own team, and nobody notices until someone compares the numbers with the CRM.
A web analytics implementation plan
| Phase | Output | Owner |
|---|---|---|
| 1. Goals and questions | Three to five business questions and the metric for each | Marketing / product lead |
| 2. Tracking plan | List of pages, events, properties and goals, with naming rules | Analyst |
| 3. Installation | Script on every page, including single-page app routes | Developer |
| 4. Events and goals | Sign-ups, purchases, form submissions, key clicks | Developer + analyst |
| 5. Data hygiene | Internal traffic excluded, bots filtered, domains and time zone set | Analyst |
| 6. Privacy | Consent setup, data minimization, retention settings, privacy policy text | Legal / owner |
| 7. Verification | Real-time checks, comparison with backend counts | Analyst |
| 8. Reporting | Dashboards, alerts, scheduled reports | Analyst |
| Check before launch | How |
|---|---|
| Every page tracked | Browse key templates in realtime |
| Events fire once | Trigger each event; compare with backend |
| Internal traffic excluded | Visit from the office; confirm it is not counted |
| Domains and time zone | Match reporting to business days |
| Privacy text | Policy describes what is collected |
Repeat the checks after every release that touches templates, forms or checkout.
Step by step
1. Start with questions, not tags
Write the questions the data must answer: "Which channels bring trials that convert to paid?", "Where do visitors drop out of checkout?" Every event you track should serve one of them.
2. Write a tracking plan
For each event record its name, when it fires, its properties and the question it serves. Use one naming convention (for example object_action: signup_completed, plan_selected) and keep it in a shared document or tool.
3. Install the script
Choose the method that fits your stack: a script tag in the site template, a tag manager, a CMS or ecommerce plugin (WordPress, Shopify), or a framework package for React, Vue or Next.js. For single-page applications make sure route changes are counted as pageviews.
4. Configure events and goals
Track the actions that represent value: form submissions, sign-ups, purchases with revenue, file downloads, outbound clicks. Mark the most important ones as goals so conversion rates are calculated.
5. Set up data hygiene
Exclude your office IPs or team members, register all domains the site uses, set the reporting time zone, and check that bots and crawlers are filtered.
6. Handle privacy and consent
Decide whether the setup needs a consent banner in each market. Cookieless, aggregate measurement can often run without one; identifying individual visitors, advertising pixels and cross-site tracking usually require consent under the GDPR and ePrivacy rules. Document what you collect in your privacy policy.
7. Verify
Use real-time reports to trigger each event yourself, then compare a week of conversions and orders with your backend. A difference above a few percent needs an explanation (ad blockers, consent rates, duplicate events).
8. Report and maintain
Build one dashboard per audience, set alerts for sudden traffic drops, and re-check tracking after every release that changes templates, forms or checkout.
Worked example: checking an implementation
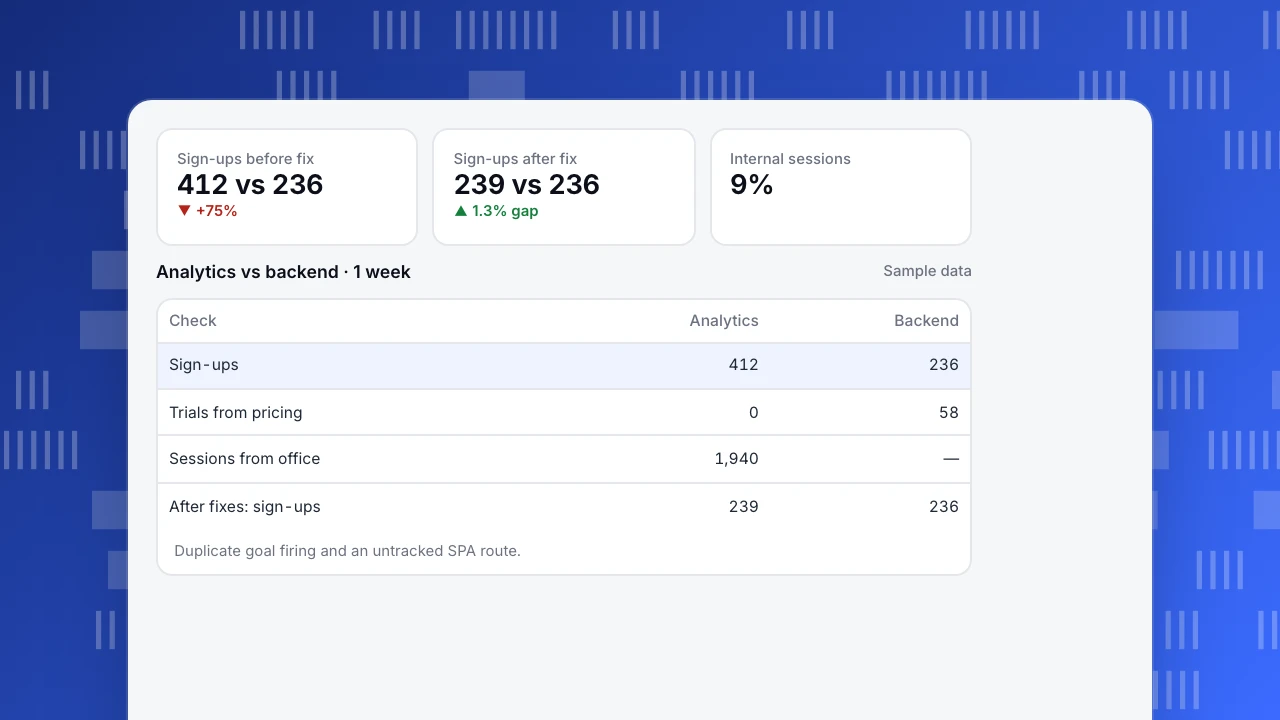
A SaaS site (sample data) compares one week of analytics with its backend:
| Check | Analytics | Backend | Finding | Fix |
|---|---|---|---|---|
| Sign-ups | 412 | 236 | Goal fired on page load and on success | Fire only on the success response |
| Trials from pricing page | 0 | 58 | Pricing page is a SPA route; no pageview recorded | Enable route-change tracking |
| Sessions from office | 1,940 | — | 9% of sessions came from the team | Exclude internal traffic |
| Bot sessions | Filtered | — | 3,100 crawler requests excluded | No action |
After the fixes, analytics showed 239 sign-ups against 236 in the backend: a 1.3% gap, explained by test accounts.
Sign-ups before fix
412 vs 236
▼ +75%
Sign-ups after fix
239 vs 236
▲ 1.3% gap
Internal sessions
9%
Analytics vs backend · 1 week
Sample data| Check | Analytics | Backend |
|---|---|---|
| Sign-ups | 412 | 236 |
| Trials from pricing | 0 | 58 |
| Sessions from office | 1,940 | — |
| After fixes: sign-ups | 239 | 236 |
Duplicate goal firing and an untracked SPA route.
Common mistakes
- Tracking everything "just in case". Unused events clutter reports and add privacy risk.
- No naming convention. "SignUp", "signup" and "sign_up_complete" become three events.
- Forgetting single-page app routes. Pageviews only on the first load hide most of the journey.
- Never comparing with the backend. Analytics should be checked against orders and sign-ups.
- Treating implementation as done. Every redesign, new form or checkout change can break tracking.
Implementing web analytics with TapCub
- Install: add the script tag or use a guide for any website, Google Tag Manager, WordPress, Shopify or single-page apps.
- Plan events: create a tracking plan; autocapture records clicks and form submissions, and unplanned events land in an inbox for review.
- Goals: set up goals for pages, events or revenue.
- Hygiene: exclude internal traffic and register website domains; bots are filtered and shown separately.
- Privacy: cookieless counting by default; see do I need a consent banner?.
- Verify: check the installation and use realtime to trigger events yourself.
Related: event tracking, web analytics best practices, web analytics audit.
FAQ
How long does it take to implement web analytics? Installing a script takes minutes. A full implementation with a tracking plan, goals, hygiene and verification usually takes one to three weeks for a typical marketing site or SaaS product.
Should I use a tag manager? It helps when marketers need to add tags without deploys. For a single analytics script, a direct install is simpler and loads faster.
Do I need a developer? For basic pageview tracking on common platforms, no. For custom events, single-page apps and server-side events, yes.
How do I know my analytics data is accurate? Trigger events yourself in real time, then compare a week of conversions with your backend. Investigate any gap above a few percent.
Sources
- European Data Protection Board. Guidelines 05/2020 on consent under Regulation 2016/679.
- W3C. Beacon API.
- Google Search Central. Understand JavaScript SEO basics.
Was this article helpful?
We use your answers to fix and expand this page.
Couldn’t send. Please try again in a minute.
Thanks for the feedback. We’ll use it to improve this page.You’ve already sent feedback on this page. Thanks.

Technical Engineer
Focuses on tracking code, SDKs, and API integrations, with practical guidance on implementation checks and troubleshooting.