Try it on your own data
Every report in this article is in the free plan. One snippet for web and apps, up to 10 sites.
Start freeIncreasing app engagement means more users returning at the right interval and doing the core action, not just opening the app. This guide shows how to measure engagement, ten tactics that work, a five-step plan, and a language-learning app where letting users start a lesson before sign-up and smarter reminders lifted day-30 retention from 11% to 16%.
What you will learn
- Define engagement by one core action, not opens
- Match reminders to the product’s natural interval
- Get new users to value in the first session
- Compare engaged and churned users’ first week
- Watch opt-outs and uninstalls as guardrails
What does it mean to increase app engagement?
Increasing mobile app engagement means getting more users to come back regularly and do the thing the app exists for: complete a workout, send a message, check a balance, place an order. Engagement is not the same as opens. A user who opens the app from a notification and closes it two seconds later has not engaged. Useful engagement is frequent (users return at the interval your product expects), deep (they use the core feature, not just the home screen) and broad (over time they adopt more of the features that matter).
The practical goal is a habit: a reliable reason to return, a fast path to value each time, and a product that gets more useful the more someone uses it.
Measure engagement before you try to raise it
| Metric | Formula or definition | What it tells you |
|---|---|---|
| DAU/MAU (stickiness) | Daily active users ÷ monthly active users | How many monthly users come back on a typical day |
| Engaged sessions per user | Sessions that last 10 s+, view 2+ screens or include a key event ÷ active users | Whether visits are meaningful |
| Core action rate | Users who did the core action ÷ active users | Whether people get value, not just open |
| Return interval | Time between two consecutive sessions | The natural rhythm of use |
| Day-1 / Day-7 / Day-30 retention | New users active N days later ÷ new users | Whether engagement lasts |
| Feature adoption | Users of a feature ÷ active users | Breadth of use |
Pick one core action for your app and treat it as the main engagement metric. For a fitness app it might be "completed a workout", for a banking app "viewed account details".
Ten ways to increase app engagement
- Shorten time to first value. Cut onboarding steps until a new user reaches the core action in the first session.
- Match the product's natural interval. A budgeting app used weekly should build a weekly ritual, not push daily notifications.
- Personalize the first screen. Show the next most useful thing for this user: continue where they left off, recent items, saved progress.
- Use notifications with a reason. Trigger them from user actions or real events (an order shipped, a friend replied), cap the frequency, and let users choose topics.
- Make progress visible. Streaks, progress bars and history give users a reason to return, as long as they reflect real value.
- Remove friction in the core loop. Every extra tap in the core action reduces how often people do it. Fix crashes and slow screens first.
- Teach features in context. Show a feature when the user needs it, not in a tour on day one.
- Bring in social and shared value. Shared lists, team spaces or sharing results make the app more useful the more people use it.
- Win back lapsing users with relevance. Target users who have passed their usual return interval with content tied to what they used before.
- Listen in-app. Offer help or feedback at the point of doubt; questions reveal what stops people from engaging.
A five-step plan
1. Define the core action and the expected interval
Write them down: "Engaged user = completed at least one lesson in the last 7 days."
2. Find where new users stall
Build a first-week funnel from install to second core action. The step with the biggest drop is the first target.
3. Segment engaged and disengaged users
Compare what retained users did in their first week with users who churned. Features or behaviors that separate the groups are candidates to promote (correlation, not proof).
4. Change one thing per release
Ship one change aimed at the stalled step, then compare cohorts before and after on the same metric.
5. Watch for empty engagement
If opens rise but the core action rate does not, you are buying attention, not engagement. Check uninstalls and notification opt-outs.
| User type | What helps |
|---|---|
| New | Fast first value, fewer steps before the core action |
| Regular | Personalized first screen, visible progress |
| Power | Advanced features, shared spaces |
| Lapsing | Relevant win-back tied to past use |
One engagement strategy for everyone usually fits no one.
Worked example: a language-learning app
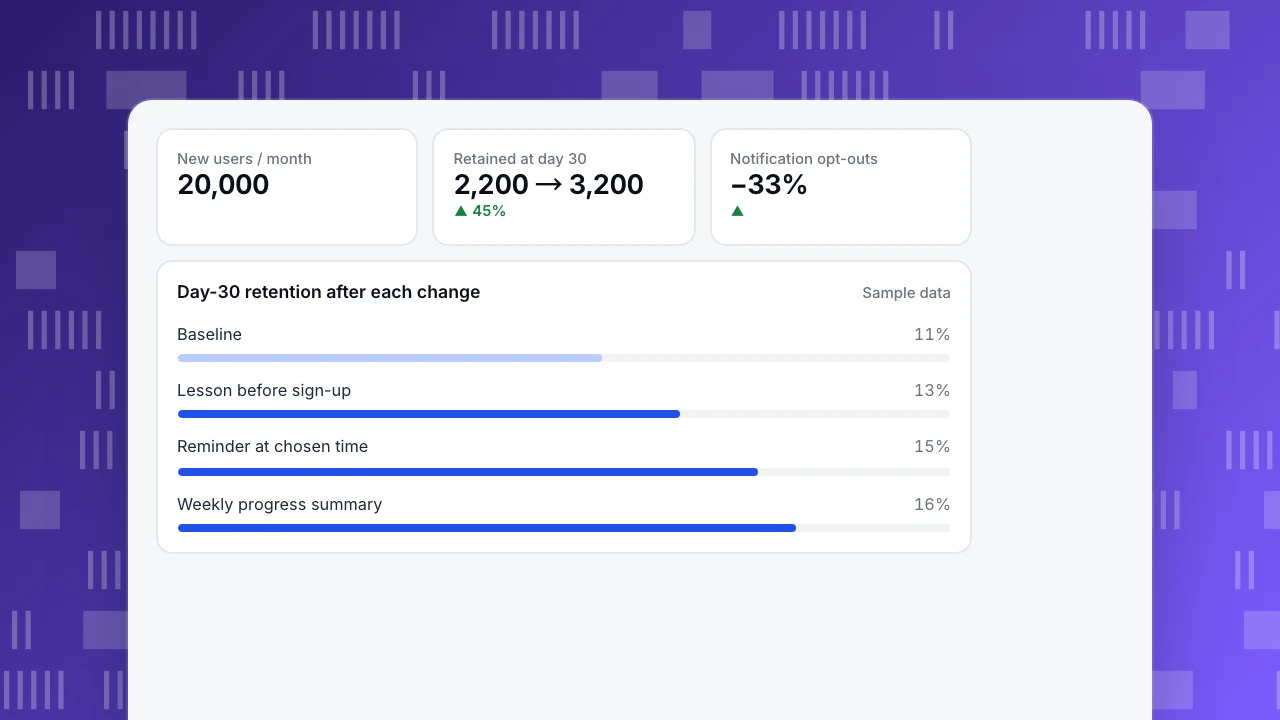
A language app (sample data) defines engagement as "completed a lesson". Among 20,000 new users per month:
| Change | First-week lesson completers | Day-30 retention |
|---|---|---|
| Baseline (account required before first lesson) | 42% | 11% |
| First lesson before sign-up | 55% | 13% |
| Reminder at the user's chosen time instead of 9 a.m. for all | 57% | 15% |
| Weekly progress summary instead of daily "come back" push | 57% | 16% |
Day-30 retention rose from 11% to 16%: from 2,200 to 3,200 retained users per monthly cohort. Notification opt-outs fell by a third when daily generic pushes were replaced.
New users / month
20,000
Retained at day 30
2,200 → 3,200
▲ 45%
Notification opt-outs
−33%
▲
Day-30 retention after each change
Sample dataCommon mistakes
- Counting opens as engagement. Measure the core action.
- Over-notifying. Notification fatigue drives opt-outs and uninstalls.
- Gamification without value. Streaks for actions that do not help users feel hollow and fade.
- One strategy for all users. New users, power users and lapsing users need different things.
- Ignoring stability. Crashes and slow starts cut engagement more than any feature.
Measuring app engagement in TapCub
- Users & retention: active users (daily, weekly, monthly), new users, next-day retention and retention cohorts. See app retention rate.
- Engagement: engaged sessions (at least 10 seconds, two screens or one key event) and five distributions: session duration, frequency, interval between starts, screens per session and starts per day.
- Lifecycle: new, returning, resurrecting and dormant users per week or month.
- Funnels and paths: first-week funnels and paths from screen views and events, plus user segments.
- Stability: crash-free users and cold start by version.
Related: app engagement metrics, DAU/MAU, aha moment.
FAQ
What is a good DAU/MAU ratio? It depends on the product's natural frequency. Messaging and social apps can exceed 50%; many utility and shopping apps sit between 10% and 20%. Compare against your own expected interval.
How do push notifications affect engagement? Relevant, well-timed notifications can bring users back; frequent generic ones lead to opt-outs and uninstalls. Measure the core action rate, not just opens.
What is the difference between engagement and retention? Retention says whether users come back at all; engagement says how often and how deeply they use the app when they do.
How long does it take to see engagement improve? First-week behavior changes show within a couple of weeks; retention effects need at least one full cohort cycle (for example 30 days).
Sources
- Eyal, N. (2014). Hooked: How to Build Habit-Forming Products. Author site.
- Android Developers. Notifications overview.
- Apple. Human Interface Guidelines: notifications.
Was this article helpful?
We use your answers to fix and expand this page.
Couldn’t send. Please try again in a minute.
Thanks for the feedback. We’ll use it to improve this page.You’ve already sent feedback on this page. Thanks.

Product Adoption Consultant
Explores customer onboarding, live conversations, and self-service, turning common usage questions into practical guidance and improvements.