Try it on your own data
Every report in this article is in the free plan. One snippet for web and apps, up to 10 sites.
Start freeMost apps lose the majority of new users within days. Whether yours is in trouble depends on how you calculate retention and whether the curve flattens. This guide covers the formula, the three calculation methods, the curve, and a worked onboarding change measured over eight weekly cohorts.
What you will learn
- Day-N retention = cohort users active on day N ÷ cohort size
- Classic, range and unbounded retention differ a lot on the same data
- A healthy curve drops early and then flattens
- Measure changes by cohort and check acquisition mix
- Watch Day 30 and beyond, not just Day 1
What is app retention rate?
App retention rate is the percentage of users who come back to a mobile app after a given number of days since they first opened it. Day-1, Day-7 and Day-30 retention are the most common checkpoints. If 10,000 people install and open an app on Monday and 2,600 of them open it again on Tuesday, Day-1 retention is 26%.
Retention is the clearest signal of whether an app delivers ongoing value. Acquisition can be bought; retention has to be earned by the product.
How to calculate app retention rate
Day-N retention = users from the cohort active on day N ÷ users in the cohort × 100
The cohort is the group of users who first opened the app on the same day (or week). Day 0 is the install day. There are three common variants, and they give very different numbers for the same app:
| Method | Counts a user as retained on day 7 if they were active… | Example, same cohort |
|---|---|---|
| Classic (N-day) | Exactly on day 7 | 13% |
| Range (bracket) | At any point in days 7–13 | 24% |
| Unbounded (rolling) | On day 7 or any day after | 31% |
Classic retention is the standard in mobile benchmarks and is the strictest. Unbounded retention is useful for apps used occasionally, such as travel or tax apps. Always state which one you report, and never compare a number calculated one way with a benchmark calculated another.
| Method | Retained on day 7 if active… | Example |
|---|---|---|
| Classic | Exactly on day 7 | 13% |
| Range | Any day 7–13 | 24% |
| Unbounded | Day 7 or later | 31% |
Same cohort, three methods. State which one you report.
What does a typical retention curve look like?
Most apps lose the majority of new users within days. Andrew Chen's analysis of Quettra data on Android apps found that the average app lost about 77% of its daily active users within the first 3 days after install, 90% within 30 days and more than 95% within 90 days, while the top apps retained far more.
The shape matters more than any single point. A healthy curve drops steeply in the first days and then flattens: the users who remain have found a habit. A curve that keeps sloping down toward zero means no group of users has found lasting value yet.
Worked example: an onboarding change, measured by cohort
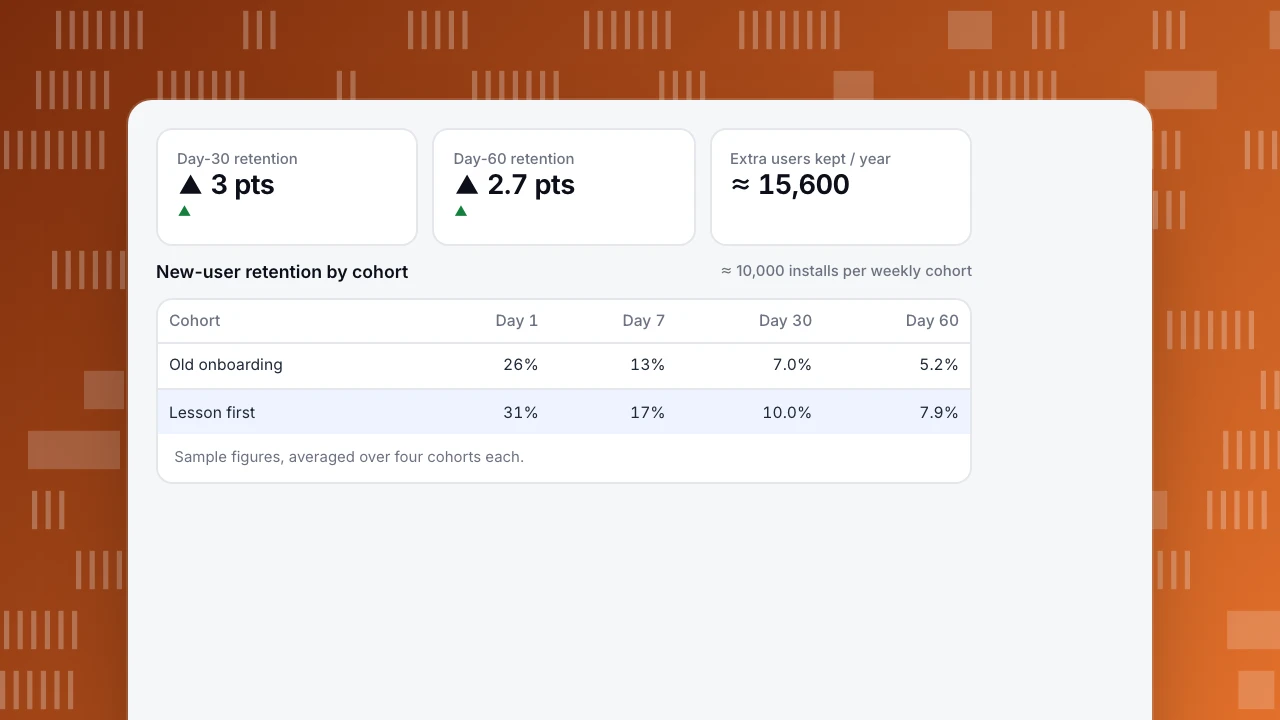
A language-learning app shortened onboarding from six screens to three and moved the first lesson before account creation. It compared four weekly cohorts before and four after (sample figures, averaged per cohort of about 10,000 installs):
| Cohort | Day 1 | Day 7 | Day 30 | Day 60 |
|---|---|---|---|---|
| Before (old onboarding) | 26% | 13% | 7.0% | 5.2% |
| After (lesson first) | 31% | 17% | 10.0% | 7.9% |
| Change | +5 pts | +4 pts | +3 pts | +2.7 pts |
What made the result trustworthy:
- The gain held. Day-60 retention improved by 2.7 points, not just Day 1, so it was not only curiosity.
- The curve flattened earlier. From Day 30 to Day 60 the old cohorts lost 26% of the remaining users (7.0% → 5.2%); the new ones lost 21% (10.0% → 7.9%).
- Acquisition mix was checked. Paid installs were 40% of each cohort in both periods, so the change was not caused by a different traffic source.
- The effect on the base is large. At 10,000 installs a week, 3 extra points of Day-30 retention means about 300 more users a week still active a month later, or about 15,600 a year, without spending more on acquisition.
Day-30 retention
▲ 3 pts
▲
Day-60 retention
▲ 2.7 pts
▲
Extra users kept / year
≈ 15,600
New-user retention by cohort
≈ 10,000 installs per weekly cohort| Cohort | Day 1 | Day 7 | Day 30 | Day 60 |
|---|---|---|---|---|
| Old onboarding | 26% | 13% | 7.0% | 5.2% |
| Lesson first | 31% | 17% | 10.0% | 7.9% |
Sample figures, averaged over four cohorts each.
How to improve app retention
- Deliver value in the first session. Let users try the core action before sign-up walls and permission prompts.
- Find the "aha" action. Compare users retained at Day 30 with those who churned: which action in the first week separates them? Push more new users toward it.
- Fix crashes and slow launches. Stability problems in the first session are a common, avoidable cause of Day-1 churn.
- Use notifications based on behavior, with clear value, and watch opt-out rates.
- Build a return reason: progress, streaks, saved content, collaboration, new content.
- Win back slipping users before they are gone: a user inactive for 7 days is easier to recover than one inactive for 60.
- Measure by cohort and segment: by acquisition channel, platform, country and app version.
Common mistakes
- Mixing methods. Comparing your unbounded retention to a classic benchmark makes you look better than you are.
- Averaging across all users. Use cohorts; otherwise growth in new users hides falling retention.
- Counting not-yet-due days as zero. A cohort from 10 days ago has no Day-30 value yet.
- Ignoring reinstalls and devices. Decide whether retention is per user or per device and be consistent.
- Reading Day 1 only. Early gains from a gimmick often vanish by Day 30.
Measuring app retention in TapCub
App analytics › Users › Retention switches between New-user retention (from the day someone first appears) and Active retention (from people active in a period), at day, week or month grain. Cells that are not due yet are marked as not due rather than zero. Beside the table, User freshness shows the share of active users first seen within 1, 7 or 30 days, and Slipping away shows users inactive for 7, 14, 30, 60 or 90 days. A reinstall does not count as a new user. To choose your own start and return events, open Custom retention in behavior analytics. For weekly new, continuing, returning and churned users, see Users › User composition. Related reading: Good retention rate, How to do cohort analysis and App engagement metrics.
See also: Build a retention report.
See also: Retention curve, Mobile app customer journey.
Sources
- Andrew Chen, New data shows losing 80% of mobile users is normal, and why the best apps do better (2015, Quettra data).
Was this article helpful?
We use your answers to fix and expand this page.
Couldn’t send. Please try again in a minute.
Thanks for the feedback. We’ll use it to improve this page.You’ve already sent feedback on this page. Thanks.

Product Analyst
Focuses on event analysis, conversion funnels, and retention, using clear metric definitions and structured analysis to explain product performance.