Try it on your own data
Every report in this article is in the free plan. One snippet for web and apps, up to 10 sites.
Start free"What is a good retention rate?" has no single answer, and published benchmarks disagree because they measure different things. A more useful question is whether your retention curve flattens, and at what level. This guide explains what changes the number, how to read the curve, and how to set a target from your own cohorts.
What you will learn
- Retention numbers are only comparable with the same definition, period and audience
- The key signal is a curve that flattens: a stable core of people who keep coming back
- Set targets from your own cohorts and improve the flat part, not just day one
Why there is no single good number
Retention benchmarks circulate widely, but they rarely agree. One counts paying customers over a year; another counts app users on day 30. One counts any visit as a return; another requires a purchase. Comparing your number with one of these is only meaningful if all of that matches.
What changes the number
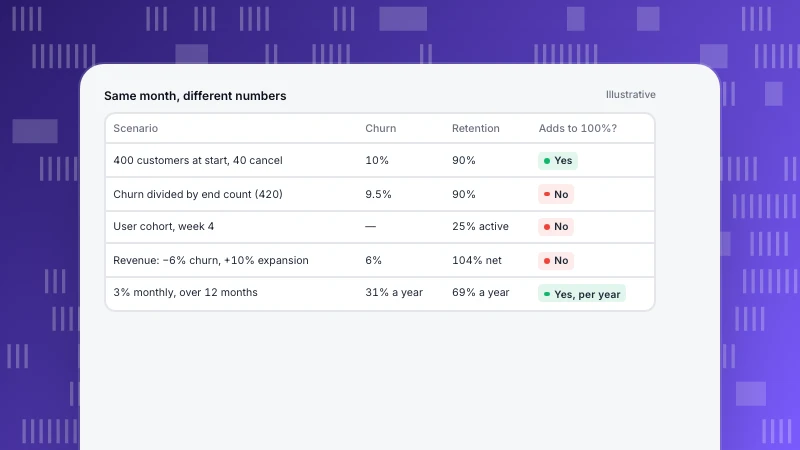
The table lists the five things that change a retention rate the most. If you are going to compare with an outside number, check all five first.
| What changes the number | Why it matters |
|---|---|
| Customers or users | Paying customers retain far better than free sign-ups |
| Period | Day-30 user retention and month-12 customer retention are different questions |
| Return event | Any activity is easier to hit than a meaningful action |
| Usage frequency | A tax tool used yearly cannot be judged on weekly returns |
| Audience and channel | Paid campaigns often bring lower-intent users than referrals |
Before comparing with any benchmark, check that all five match.
Read the curve, not one point
Plot the share of a cohort still active over time. The shape tells you more than any single value:
- A curve that keeps falling towards zero means the product has not found a group that needs it regularly.
- A curve that flattens means a stable core keeps coming back. The level where it flattens is your real retention.
- A curve that rises later (some cohorts improving with age) usually means network effects or growing usage inside accounts.
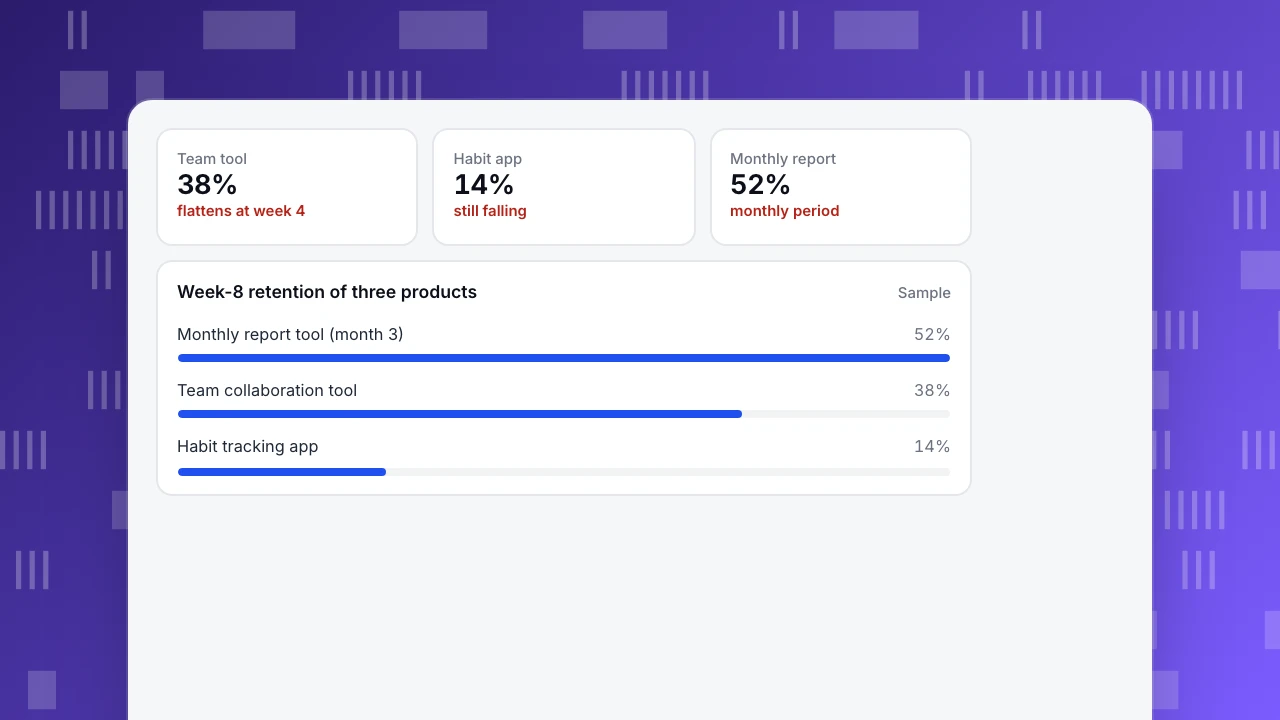
The chart compares three sample products, each on the period that fits it. The team tool flattens at around 38% from week 4. The habit app is still falling at week 8, which is the bigger problem even though its day-one retention was higher.
Team tool
38%
flattens at week 4
Habit app
14%
still falling
Monthly report
52%
monthly period
Week-8 retention of three products
SampleHow to set your own target
- Pick the period that matches usage: days for daily apps, weeks for work tools, months for monthly tasks.
- Choose a meaningful return event, not just any visit.
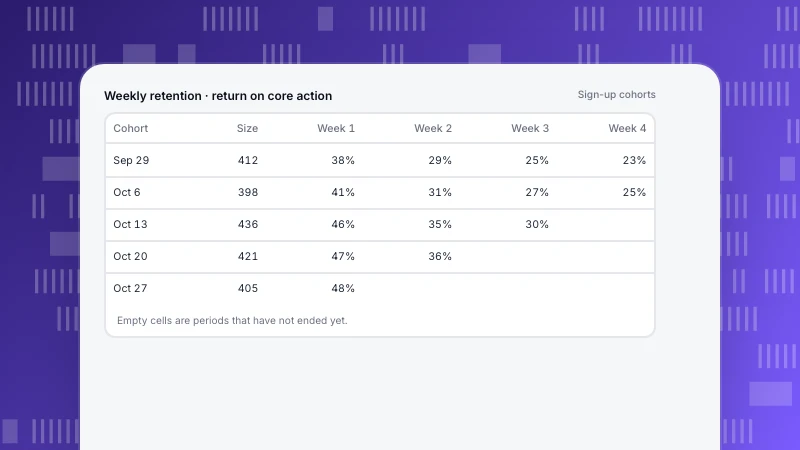
- Measure the last six to twelve cohorts. Note where each curve flattens.
- Set the target relative to that level, for example three points higher at week 8 within two quarters.
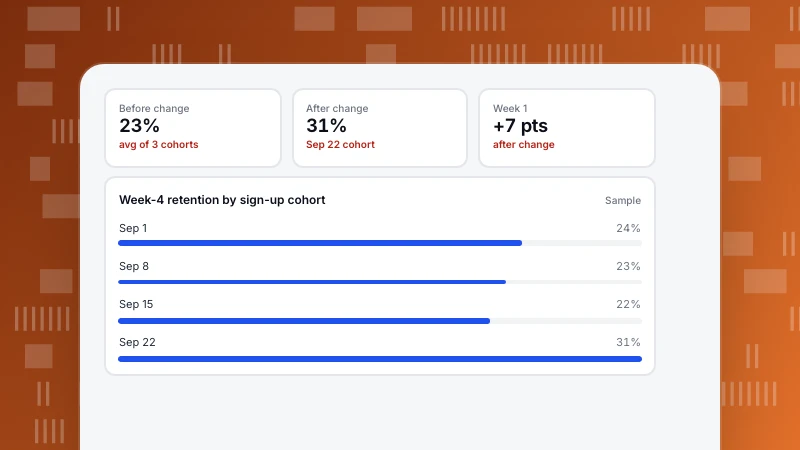
- Track cohorts after each change rather than a blended rate.
See how to do cohort analysis for building the table.
What moves retention
- Faster first value. People who reach the core action early stay longer. See onboarding metrics.
- Reasons to return. Notifications, reports or collaboration that bring people back on their own schedule.
- Fit between channel and product. Campaigns that attract the wrong audience lower retention however good the product is.
FAQ
What is a good customer retention rate?
It depends on the product, period and definition. Rather than chasing an outside number, look for a curve that flattens and improve the level where it does.
What is the difference between "returned in period N" and "N or later"?
The first counts people active in that exact period, so values can go up and down. The second counts people who came back in that period or any later one, so the curve never rises; it shows who has truly gone.
Should retention be measured on users or customers?
Both, separately. User retention shows product engagement; customer retention shows the business.
See also: App retention rate.
Was this article helpful?
We use your answers to fix and expand this page.
Couldn’t send. Please try again in a minute.
Thanks for the feedback. We’ll use it to improve this page.You’ve already sent feedback on this page. Thanks.

Data Engineer
Writes about event design, data quality, and collection workflows, with verifiable implementation methods for reliable analytics.