Quick answer
Cohort analysis groups users by when they started (for example the month they signed up) and compares how each group behaves over the same amount of time since that start, usually retention, repeat purchase or revenue.
What is cohort analysis?
What is cohort analysis? In short, cohort analysis groups users by when they started (the month they signed up, the week of their first order) and then tracks each group separately over the same amount of time since that start. Each group is a cohort. Instead of one average for everyone, you get a row per cohort, and you can see whether people who joined in March behave differently from people who joined in January at the same age.
A cohort has two parts: a starting event and a time window. "Users who signed up in March" is a cohort; so is "customers whose first order was during the spring sale". Once someone is in a cohort they stay in it, which is what makes cohorts useful: you follow the same people as they age.
The idea comes from demography. Norman Ryder's 1965 paper The Cohort as a Concept in the Study of Social Change (American Sociological Review) used birth cohorts to separate change that happens as people get older from change between generations. Product analytics borrows the same logic: separate what happens as users age with your product from what changes between groups of users.
Why averages are not enough
Averages mix old and new users, and the mix keeps changing. If overall retention is flat, it could be that older users are leaving while newer users are staying better, or the reverse. A growing product is especially misleading: a wave of new users drags most averages down, because new users always churn more than people who have stayed for a year.
Cohort analysis answers three questions an average cannot:
- Is the product getting better at keeping people? Compare recent cohorts with older ones at the same age.
- When do people leave? Follow one cohort across time and see where the curve drops and where it flattens.
- Did something on a specific date affect everyone? A dip that hits all cohorts in the same calendar week points to an outage, a season or a campaign, not to a change in who you are acquiring.
Types of cohorts
| Type | Grouped by | Example | Use it to |
|---|---|---|---|
| Acquisition cohort | When people started | Signed up in week 12; first order in March | See whether onboarding, pricing or acquisition quality is improving over time |
| Behavioral cohort | Something people did in a window | Used search in their first week; bought twice in 30 days | Find the actions that go with long-term retention |
| Segment-filtered cohort | An acquisition or behavioral cohort narrowed by a property | March sign-ups from paid search; iOS users who started in Q2 | Compare channels, platforms or plans fairly, at the same age |
Acquisition cohorts tell you whether retention is changing. Behavioral cohorts help explain why: if users who invite a teammate in week one retain twice as well, that action is a candidate for your onboarding. It is only a candidate, though; the users who invite may simply be the most motivated ones, so test the change before you rely on it.
How to read a cohort table
A cohort table (also called a retention grid or cohort chart) has one row per cohort and one column per period since the start. Each cell is the share of that cohort still active, or still buying, in that period. Here is a subscription app with monthly sign-up cohorts, read in mid-June:
| Cohort | Users | Month 1 | Month 2 | Month 3 |
|---|---|---|---|---|
| January | 1,000 | 40% | 30% | 26% |
| February | 1,200 | 42% | 31% | 27% |
| March | 1,500 | 48% | 37% | (June, in progress) |
| April | 1,400 | 47% | (June, in progress) | — |
| Weighted average | — | 44.7% | 33.2% | 26.5% |
Read it three ways:
- Across a row: the life of one cohort. January drops from 40% to 30% to 26%. The drop gets smaller each month, so the curve is flattening: a core of users is staying. A curve that keeps falling at the same rate has no core yet.
- Down a column: cohorts at the same age. Month 1 jumps from 40–42% to 47–48% starting with March. Something changed for people who joined in March, such as new onboarding or a different traffic source. This is the comparison an overall average hides.
- Along a diagonal: the same calendar month. February's Month 3, March's Month 2 and April's Month 1 all happened in May. If those cells all dipped together, the cause would be something that happened in May, not the cohorts themselves.
The weighted average weights each cohort by its size: Month 1 is (400 + 504 + 720 + 658) ÷ 5,100 = 44.7%. A plain average of the four percentages gives about 44.3%, and the gap grows when cohort sizes differ a lot. Cells for periods that have not finished yet are left out; counting a half-finished June as a real Month 3 would make the newest cohort look worse than it is.
A worked example
An online store compares customers by the month of their first order and measures repeat purchase within 60 days:
| First-order cohort | Customers | Ordered again within 60 days |
|---|---|---|
| January | 800 | 22% |
| February | 950 | 21% |
| March | 900 | 29% |
In March the store started a post-purchase email series. The store-wide repeat rate barely moved that quarter, because customers from earlier years make up most of the orders. The cohort view shows the email series lifted repeat purchases for new customers by about eight points (from 21–22% to 29%). That is a finding you can act on, and it is invisible in the overall repeat purchase rate.
To check it was the emails and not a different mix of customers, split the March cohort by acquisition channel. If the lift appears in every channel, the emails are the likely cause; if it appears only in one channel, look at what changed in that channel's traffic.
How to do a cohort analysis
- Start with a question. "Are users who joined after the redesign retaining better?" is a question; "let's look at cohorts" is not.
- Choose the starting event. Sign-up, first visit, first purchase, or first use of a feature. It defines who is in each cohort.
- Choose the return event. Any activity, a key action, or a purchase. "Came back and looked around" and "came back and paid" are different questions.
- Pick the cohort size and period. Daily cohorts for a high-traffic app over a few weeks; weekly or monthly cohorts for most products. Each cohort needs enough users that a few points of difference is not noise; aim for a few hundred.
- Read rows, columns and diagonals, and use the weighted average for the headline.
- Split or filter to explain. Once you see a difference, narrow the cohorts by channel, platform, country or plan to find where it comes from.
Cohort analysis in TapCub
In TapCub, cohort analysis lives in Retention under All-platform analytics › Behavior › Behavior analysis. Each row is a cohort with its start date and size, and each column is a day, week or month since the start (up to 30 days, or 12 weeks or months).
- Starting and return events. Both are optional. Leave them empty for "any activity", or choose events to build behavioral cohorts, such as people whose first event was a purchase.
- First time only. By default a person joins the cohort only when their first start event in history falls in that period, so returning customers do not appear as new.
- Three ways to count. Returned in period N exactly (the classic grid); returned in period N or any later period, which gives a curve that never rises; or how many periods each person returned, as a distribution.
- Alignment. Periods count from each person's own first moment (rolling), or follow calendar weeks and months.
- Value per period. Add a numeric property, revenue by default, and each cell also shows the average accumulated value per person, which turns the grid into an LTV-by-cohort table.
- Weighted average row. The line under the grid is weighted by cohort size, as in the example above.
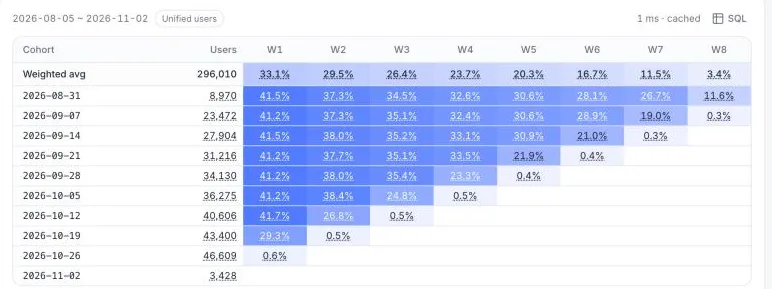
Filters and segments narrow every cohort the same way, so you can run the grid once for sign-ups from organic search and once for paid ads and compare the two at the same age. The configuration and definitions are in the docs under Retention. For the people who leave, see churn; for groups defined by a property rather than a start date, see segments.
Cohort vs segment
| Segment | Cohort | |
|---|---|---|
| Defined by | Any filter on users or sessions | A starting event and the period it happened in |
| Membership | Can change as people's properties change | Fixed once someone joins |
| Measured from | The calendar dates you pick | Each cohort's own start, so all cohorts are compared at the same age |
| Typical question | "How do mobile users from Germany behave?" | "Do people who joined in March stay longer than people who joined in January?" |
Every cohort is a kind of segment; not every segment is a cohort. In practice you often combine them: "March sign-ups who came from paid search".
Common mistakes
- Cohorts that are too small. A daily cohort of 40 people swings by several points from noise alone. Use weekly or monthly cohorts until each has a few hundred users.
- Reading unfinished periods. The newest cell in each row covers a period still in progress. It will always look low; ignore it until the period ends.
- Averaging percentages. A plain average of cohort rates gives a 50-person cohort the same weight as a 5,000-person one. Use the weighted average.
- Changing the starting event. If "sign-up" means something different after a redesign, cohorts before and after are not comparable.
- Reading correlation as cause. Users who invite a teammate retain better, but that does not mean forcing invites will. Test the change.
- Looking only at the first column. Week 1 retention can improve while the curve keeps falling. Check whether newer cohorts also flatten, and at what level.
Related guides: Retention Metrics, Lead Conversion Rate and Startup Metrics by Stage. See also how to do a cohort analysis.
See also: Behavioral cohort, Retention curve.
Was this explanation clear?
We use your answers to fix and expand this page.
Couldn’t send. Please try again in a minute.
Thanks for the feedback. We’ll use it to improve this page.You’ve already sent feedback on this page. Thanks.

Product Analyst
Focuses on event analysis, conversion funnels, and retention, using clear metric definitions and structured analysis to explain product performance.