Try it on your own data
Every report in this article is in the free plan. One snippet for web and apps, up to 10 sites.
Start freeThe right startup metrics depend on stage. This guide maps what to measure before product-market fit, in early traction and in growth to the question each stage asks, lists the few events to instrument first, and explains why a flattening retention curve matters more than any total.
What you will learn
- Choose three to five metrics for your current stage
- Before product-market fit, watch whether cohort retention flattens
- Instrument five events first: sign-up, activation, core action, payment, cancel
The right metrics depend on stage
Lists of startup metrics often run to 15 or 20 items, mostly financial definitions written for investors. A startup does not need all of them at once. Before product-market fit, revenue totals say little; after it, retention alone does not tell you whether growth is affordable. Pick the few metrics that answer the question your stage is asking, and change them as you move on.
Metrics by stage
The table maps four stages to the question each asks and the metrics that answer it. Two things hold across all of them: know your runway, and define every metric in writing so it means the same thing next quarter.
| Stage | Question | Metrics |
|---|---|---|
| Idea / pre-launch | Does anyone want this? | Interviews held, waitlist sign-ups, pilot commitments |
| Before product-market fit | Do people keep using it? | Activation rate, cohort retention at week 4 and 8, curve shape |
| Early traction | Is it growing on its own? | Weekly active users, weekly growth rate, retention by channel |
| Growth | Can we grow efficiently? | CAC, CAC payback, LTV, net revenue retention |
| Every stage | How long do we have? | Burn and runway |
Write each definition down so it means the same thing next quarter.
The retention curve
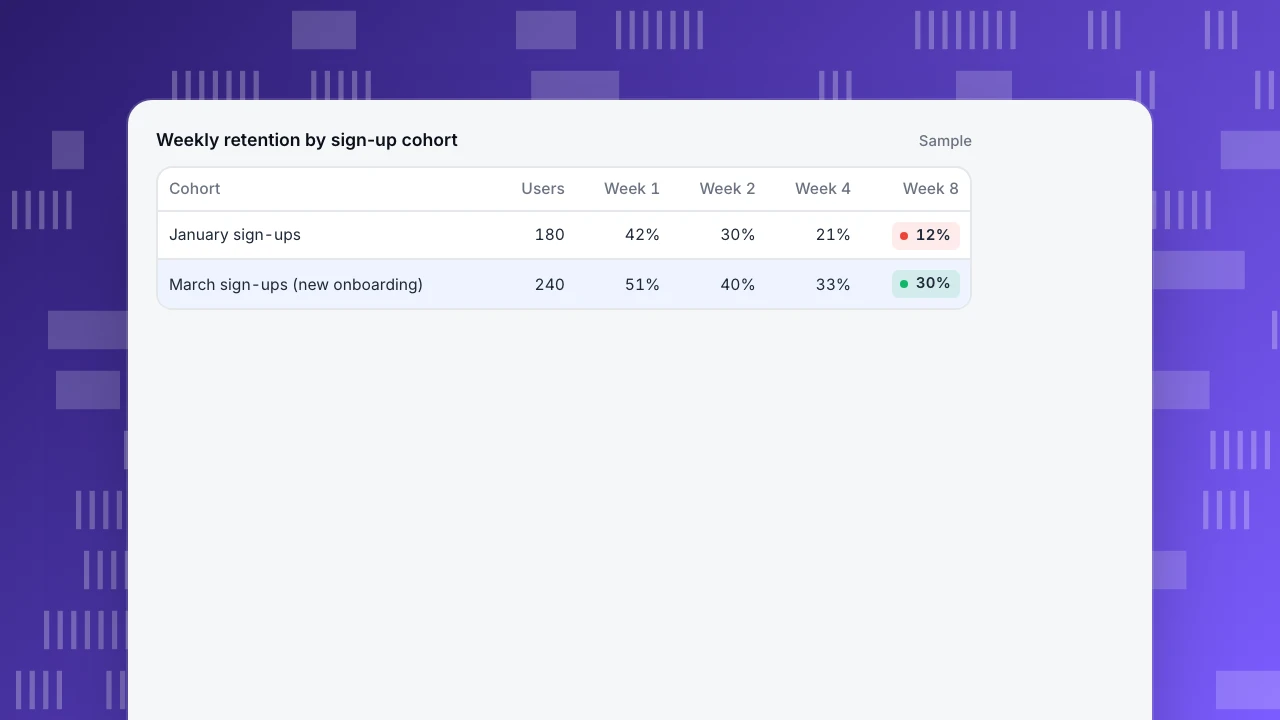
Before product-market fit, the most useful chart is retention by sign-up cohort. Plot the share of each cohort still active in week 1, 2, 4 and 8. If the curve keeps falling toward zero, people try the product and leave. If it bends and flattens, a group of users has found lasting value, and growth will compound on top of them.
In the example, January's cohort was still falling at week 8 (12%). After an onboarding change, March's cohort flattened around 30%. The week-1 gain is nice; the flattening between week 4 and week 8 is what matters. See cohort.
Weekly retention by sign-up cohort
Sample| Cohort | Users | Week 1 | Week 2 | Week 4 | Week 8 |
|---|---|---|---|---|---|
| January sign-ups | 180 | 42% | 30% | 21% | 12% |
| March sign-ups (new onboarding) | 240 | 51% | 40% | 33% | 30% |
What to instrument first
You can answer most early questions with five events:
- Sign-up (with source).
- Activation: the action that shows a user got value, defined for your product.
- Core action: the thing people come back to do.
- Payment (with amount and plan).
- Cancellation (with reason if you have one).
Identify users after login so their activity joins up across devices. Add more events only when a question needs them; see behavioral analytics.
Traps
- Cumulative totals. Total sign-ups always go up. Watch weekly new and weekly active.
- Blended averages. One large customer or one viral week can hide the trend. Segment by cohort and channel.
- Too many metrics. If a dashboard has 30 numbers, nobody knows which one to move.
- Changing definitions silently. Re-defining "active" mid-year breaks every comparison.
- Growth before retention. Paying to acquire users who leave makes CAC and LTV look worse every month.
Startup metrics in TapCub
Retention shows cohorts by day, week or month (up to 30 days, or 12 weeks or months), with three modes: returned in period N exactly, returned in N or any later period, or how many periods each person returned. Cohorts can be aligned to each person's own start or to calendar periods, and an optional numeric property such as revenue can be accumulated per period. Lifecycle shows how new, retained, resurrected and dormant users change over time (retention & lifecycle). The AARRR model maps your sign-up, activation, payment and referral events to stages; see AARRR and the first AARRR lever. For subscription businesses, see SaaS metrics and churn.
FAQ
What metrics should an early-stage startup track?
Activation rate, retention by cohort and weekly active users, plus runway. Add revenue and acquisition-cost metrics once retention holds.
What is the most important metric before product-market fit?
Retention by cohort, and whether its curve flattens.
How many metrics should a startup track?
A handful per stage, usually three to five, with one clearly named as the main one.
What is a good weekly growth rate?
It depends on stage and model. Compare your own weeks and make sure growth comes from retained users, not just new sign-ups.
When should a startup track CAC and LTV?
Once retention is stable enough to estimate how long customers stay. Before that, LTV is a guess.
See also: SEO for startups.
Was this article helpful?
We use your answers to fix and expand this page.
Couldn’t send. Please try again in a minute.
Thanks for the feedback. We’ll use it to improve this page.You’ve already sent feedback on this page. Thanks.

Data Engineer
Writes about event design, data quality, and collection workflows, with verifiable implementation methods for reliable analytics.