Try it on your own data
Every report in this article is in the free plan. One snippet for web and apps, up to 10 sites.
Start freeBehavioral analytics follows what people do on your site or product: the order of actions, where they stop, whether they return. This guide maps five common questions to five analyses, lists what each needs tracked, and gives a one-week plan to start.
What you will learn
- Pick the question first, then the analysis that answers it
- Paths show what happened; funnels measure fixed steps
- Track a few named events per question, not everything
What behavioral analytics means
Behavioral analytics studies what people do: which pages and actions come in what order, where they stop, whether they come back, and how often they repeat something. Traffic analytics counts arrivals; behavioral analytics follows the visit and the person.
The term has a second meaning in security, where "user and entity behavior analytics" looks for unusual account activity to detect threats. This article is about the product and marketing meaning.
Five questions, five analyses
Most behavioral questions fall into five kinds, each with its own analysis. The table maps them and lists what you need tracked; with only pageviews you can already run the first and the fourth on pages. Pick the question first, then the analysis, not the other way round.
| Question | Analysis | What you need tracked |
|---|---|---|
| What do people do after X? | Path (forward) | Pageviews; events optional |
| How many finish these steps, and where do they drop? | Funnel | An event or page per step |
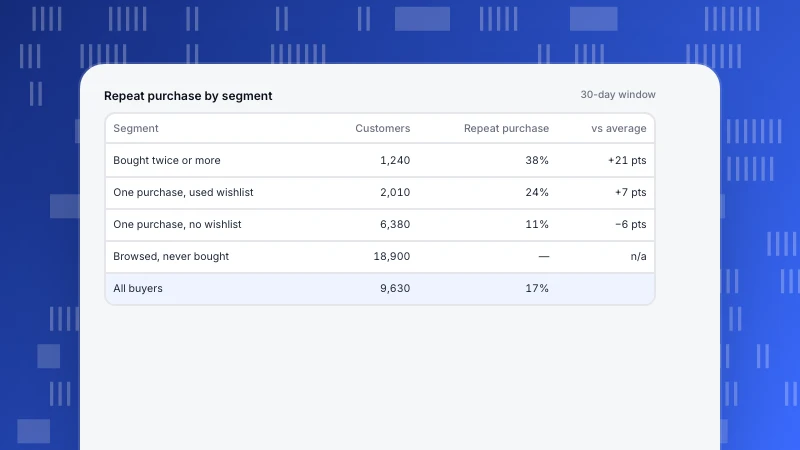
| Do people come back after their first action? | Retention | A start event, a return event, user ID after login |
| How often do people repeat an action? | Distribution / frequency | The action as a named event |
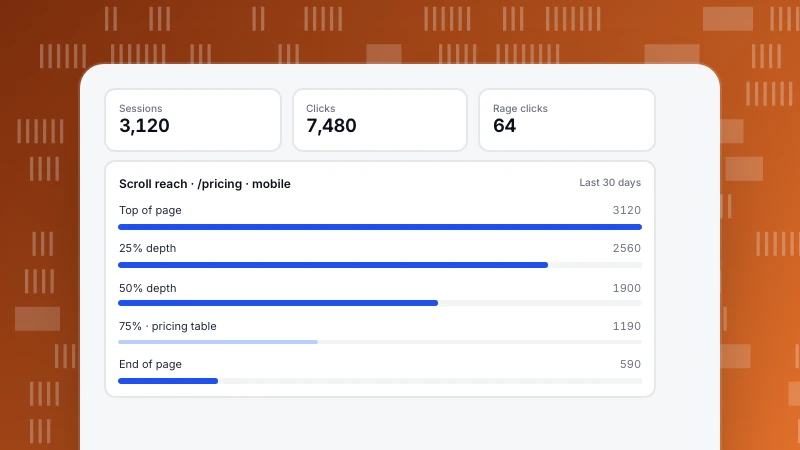
| What do people do on this page? | Heatmap / clicks and scroll | Autocapture on the page |
Pageviews alone cover paths and page-level questions.
Worked example: where do pricing visitors go?
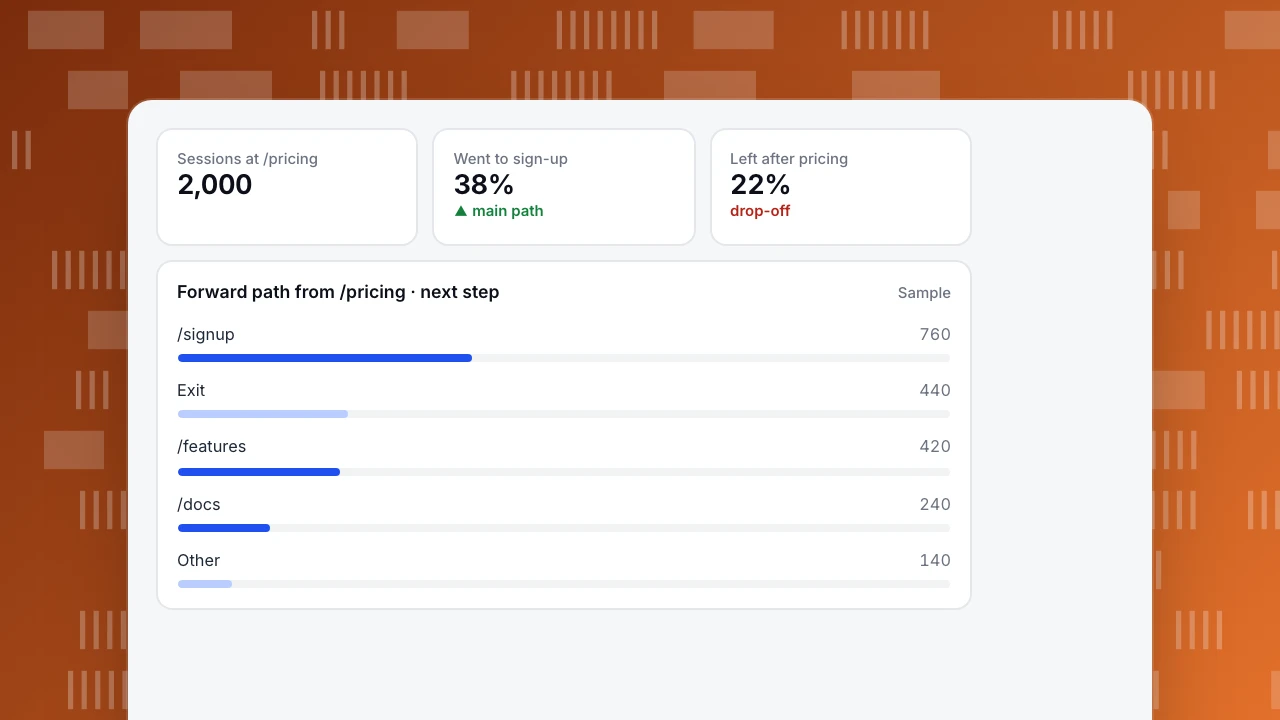
Question: after the pricing page, what do visitors do next? A forward path from /pricing answers it without defining any steps in advance.
In the example, 2,000 sessions reached pricing. 38% went on to sign-up, 21% to features, 12% to the docs, and 22% left. The 21% going back to features suggests the pricing page leaves a question about what is included. A next step would be a funnel from pricing to sign-up to activation, split by whether the visitor saw features first, and a look at the heatmap of the pricing page.
Sessions at /pricing
2,000
Went to sign-up
38%
▲ main path
Left after pricing
22%
drop-off
Forward path from /pricing · next step
SampleStart in a week
- Day 1: pick three questions. Write them down, each tied to a decision ("should we change the pricing page?").
- Day 2: list the events. For each question, the few events needed and their properties. That is your tracking plan.
- Day 3–4: implement and check. Send the events, then confirm in a live view that names and properties arrive as planned.
- Day 5: identify users if the questions are about people over time (retention, frequency): call identify after login so visits join to one person.
- Day 6–7: run the analyses and write one sentence per question: what you found and what you will change.
Common reading mistakes
- Reading paths as funnels. A path shows what happened; it does not say what should have happened. Use a funnel to measure completion of fixed steps.
- Mixing sessions and people. A path counted by sessions and a retention table counted by people answer different questions.
- Treating correlation as cause. People who use a feature may retain better because they were more engaged already. See customer segmentation analysis.
- Too little data. A node with 30 sessions moves a lot from week to week.
Behavioral analytics in TapCub
All five analyses sit under Behavior analysis. Paths go forward from a start or backward from an end, with 2 to 10 steps (default 5) and 3 to 15 nodes kept per step; forward paths show drop-off, counted by sessions or people (paths). Funnels measure ordered steps with a window up to 180 days (funnels). Retention shows returns by day, week or month, with a lifecycle view of new, retained, resurrected and dormant users (retention). Distribution shows how often people do something and the time between two actions. Heatmaps show clicks and scroll on a page and need autocapture (Pro plan and above). Segments can be applied to any of them. More in cohort and website visitor tracking.
FAQ
What is behavioral analytics?
Analysis of what people do on a site or product: sequences, drop-offs, returns and frequency, rather than only how many visited.
What is the difference between behavioral analytics and web analytics?
Web analytics often stops at traffic and pages. Behavioral analytics follows actions in order and the same person over time.
What data do I need for behavioral analytics?
Pageviews for paths and page-level questions; named events with properties for funnels and frequency; a user ID after login for retention across devices.
Is behavioral analytics the same as UEBA?
No. UEBA is a security practice for spotting unusual account activity. Product behavioral analytics is about how people use a site or product.
How do I start with behavioral analytics?
Pick three questions tied to decisions, track the few events they need, check the data, then run the matching analyses.
See also: User behavior tracking.
Was this article helpful?
We use your answers to fix and expand this page.
Couldn’t send. Please try again in a minute.
Thanks for the feedback. We’ll use it to improve this page.You’ve already sent feedback on this page. Thanks.

Product Analyst
Focuses on event analysis, conversion funnels, and retention, using clear metric definitions and structured analysis to explain product performance.