Try it on your own data
Every report in this article is in the free plan. One snippet for web and apps, up to 10 sites.
Start freeA heatmap turns numbers into colour, which makes it easy to read too much into one red spot. This guide covers the rules for reading any heatmap, then website heatmaps one by one (clicks, rage clicks, scroll reach, elements) and the checks to run before you change a page.
What you will learn
- Colour is relative: read the legend and the base before anything else
- Each website heatmap answers one question: clicks, frustration, attention or ranking
- Split by device, check the layout matches, then test the hypothesis with a funnel
Rules for reading any heatmap
A heatmap shows quantity as colour. Whether it is a correlation matrix or a click map of a web page, the same rules apply:
- Read the legend first. Colour is usually relative: red means "most in this chart", not a fixed number. Two heatmaps with the same colours can have very different totals.
- Find the base. How many visits, rows or people are behind it? A hot spot from 30 clicks is an anecdote.
- Look for patterns, not pixels. Clusters, gaps and gradients matter more than the single hottest point.
- Compare like with like. Same date range, same device, same segment.
For data charts, sorting and clustering rows makes patterns visible. For website heatmaps, the page layout is the axis, so the next section matters more.
Types of website heatmap
Website heatmaps answer different questions depending on the type:
- Click heatmap: where people click or tap. Look for clicks on things that are not links (people expect them to be), and important links that get none.
- Rage clicks: rapid repeated clicks in one spot. A strong sign of frustration: something looks clickable but is not, or responds too slowly.
- Scroll reach: the share of visits that reached each depth. Shows where attention drops off and whether key content sits below that point.
- Element ranking: the most clicked controls with their share and visitors. Easier to compare than colours.
The table lists what each type answers and its typical pitfall.
| Type | Question it answers | Typical pitfall |
|---|---|---|
| Clicks | Where do people click or tap? | Mixing devices; layout changed in the range |
| Rage clicks | Where are people frustrated? | Double-click habits on some controls |
| Scroll reach | How far down do visits get? | Sticky headers and short pages |
| Elements | Which controls get the most clicks? | Dynamic elements with changing selectors |
Always note the device and the number of sessions behind the map.
Read scroll reach
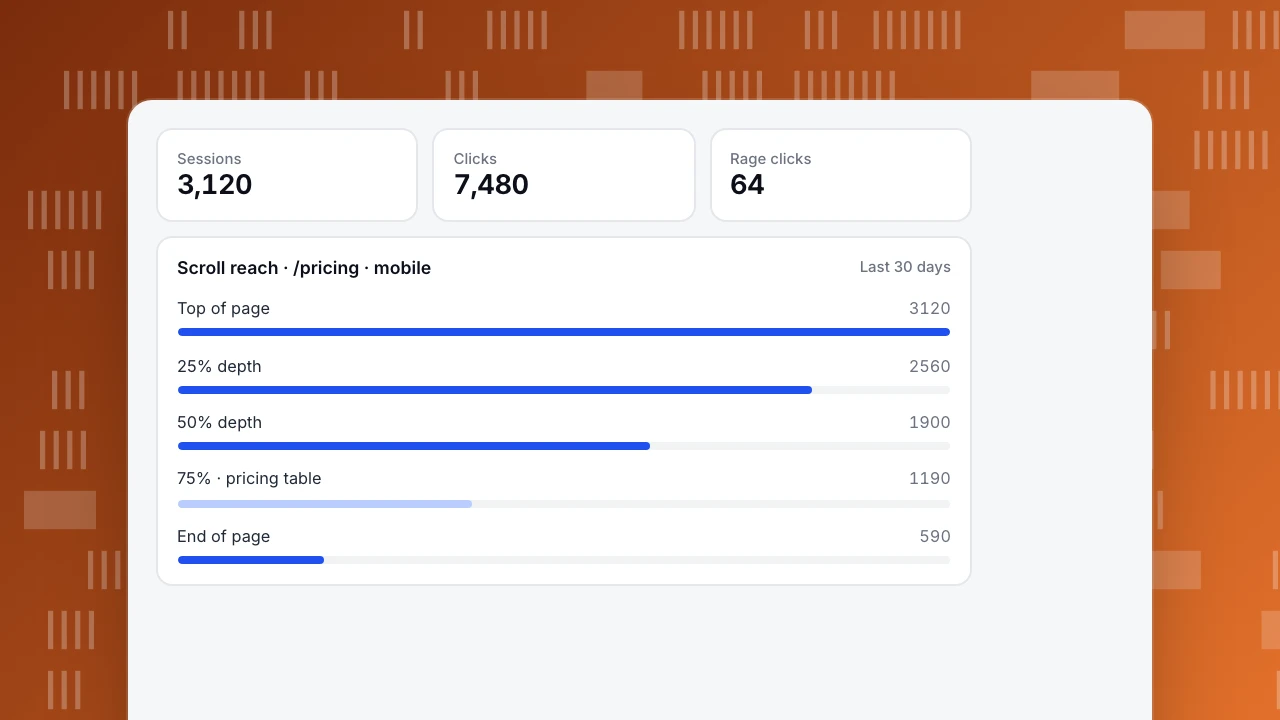
Scroll reach reads top to bottom: each row is the share of visits that got at least that far. In the example, 61% reach the middle of the page but only 38% reach the pricing table at three-quarters depth. A drop that steep right before key content suggests moving it up, or giving people a reason to keep scrolling.
There is no universal "good" curve. Long articles lose readers gradually; landing pages often lose a large share at the first screen. Compare the same page before and after a change, on the same device.
Sessions
3,120
Clicks
7,480
Rage clicks
64
Scroll reach · /pricing · mobile
Last 30 daysChecks before drawing conclusions
- Split by device. Desktop and mobile layouts differ; a mixed heatmap blends two pages into one.
- Check the layout matches. If the page changed during the date range, clicks land on positions that no longer match the overlay.
- Watch template merging. Heatmaps for
/product/*combine many pages; a hot spot may come from one product. - Check the base. Note the number of sessions and clicks behind the map.
- Look at dynamic elements. Menus, carousels and pop-ups move; clicks on them can appear in odd places.
From heatmap to change
A heatmap shows where; it rarely shows why. Turn each observation into a hypothesis and check it elsewhere: if a pricing link gets few clicks, a funnel from pricing to sign-up shows whether the people who do click go on to convert. If an article loses readers early, compare it with content performance metrics. Then change one thing and compare the heatmap for the same device and range length afterwards.
Heatmaps in TapCub
TapCub heatmaps are built from autocapture, which needs to be on (Pro plan or higher). Pages are merged by path template, and you can pick a device: all, desktop, mobile or tablet. The tabs are Clicks, Rage clicks, Scroll reach and Elements, over a date range of at most 92 days, with a viewport width filter and an optional overlay of the live page (heatmaps).
The page list shows clicks, rage clicks, sessions, average maximum scroll depth at leave, and the share of clicks with document coordinates. A rage click is the third click within 300 milliseconds and 50 pixels. Scroll reach stays empty until scroll depth is enabled in autocapture, and element text is off by default. Password fields, anything marked data-tc-ignore and the support widget are never captured. The heatmap stores no picture of the page, so the overlay needs a URL that still opens. More in heatmap and engagement metrics.
FAQ
How do you read a heatmap?
Check the legend and how much data is behind it, then look for clusters and gaps rather than single hot points, comparing like with like.
What do the colours on a website heatmap mean?
Relative density: warmer colours mean more clicks or more visits reaching that point, compared with the rest of the same map.
What is a rage click?
Several fast clicks in the same spot, a sign that something does not respond as expected. In TapCub, the third click within 300 ms and 50 px.
How many sessions does a heatmap need?
Enough that the pattern holds when you split by device or change the date range. A few hundred sessions per device is a sensible minimum for a page.
Should I look at desktop and mobile separately?
Yes. Layouts differ, so a combined heatmap mixes clicks from different positions.
See also: UX audit.
Was this article helpful?
We use your answers to fix and expand this page.
Couldn’t send. Please try again in a minute.
Thanks for the feedback. We’ll use it to improve this page.You’ve already sent feedback on this page. Thanks.

Product Adoption Consultant
Explores customer onboarding, live conversations, and self-service, turning common usage questions into practical guidance and improvements.