Quick answer
Funnel analysis measures how many people complete each step of a defined sequence, and the conversion and drop-off between consecutive steps, within a time window.
Formula: step conversion = people at step N ÷ people at step N−1 · overall conversion = people at step N ÷ people at step 1
What is funnel analysis?
What is funnel analysis? Funnel analysis (also called conversion funnel analysis) measures how many people complete each step of a sequence you define, such as product page → cart → checkout → payment, and how many drop out between one step and the next. The picture narrows like a funnel: everyone enters at the top, fewer reach each later step.
A funnel answers three questions about a process:
- How many get through? The overall conversion rate from the first step to the last.
- Where do they stop? The step with the largest drop-off, in people and in percentage.
- How long does it take? The time between steps and the time to complete the whole funnel.
It does not answer why people stop. That comes from looking at what they did instead, which is where path analysis, heatmaps, session replay and surveys come in.
Funnel conversion formulas
| Measure | Formula | Answers |
|---|---|---|
| Step conversion | People at step N ÷ people at step N−1 | How well does this step work on its own? |
| Overall conversion | People at step N ÷ people at step 1 | How many of the people who started got this far? |
| Drop-off | People at step N−1 − people at step N | How many people did this step lose? |
| Drop-off rate | 1 − step conversion | What share of the people who reached the previous step stopped here? |
| Time to convert | Time from step 1 to the last step, per person | How long the whole process takes (use the median) |
Overall conversion is the product of the step conversions. That is why small improvements at several steps add up: they multiply.
A worked example
A store looks at last week's checkout funnel:
| Step | People | Step conversion | Overall | Drop-off |
|---|---|---|---|---|
| Viewed a product | 10,000 | — | 100% | — |
| Added to cart | 2,400 | 24% | 24% | 7,600 |
| Started checkout | 1,200 | 50% | 12% | 1,200 |
| Paid | 840 | 70% | 8.4% | 360 |
Overall conversion = 840 ÷ 10,000 = 8.4% (24% × 50% × 70%). The largest absolute loss is between viewing and adding to cart, 7,600 people. That does not automatically make it the step to fix.
Because the steps multiply, a 10% relative improvement at any one step gives the same result:
| Improve by 10% (relative) | New step rate | Orders | Change |
|---|---|---|---|
| Product → cart | 24% → 26.4% | 924 | +84 |
| Cart → checkout | 50% → 55% | 924 | +84 |
| Checkout → paid | 70% → 77% | 924 | +84 |
So the choice comes down to which step is cheapest to move. Losing 30% of people who had already started checkout usually points to something concrete (a surprise shipping cost, a forced account, a failed payment), while lifting product-to-cart often means changing prices, photos or the product itself.
Types of funnels
| Funnel | Typical steps | Watch for |
|---|---|---|
| Acquisition / sign-up | Landing page → sign-up form → account created | Drop-off on the form; differences by traffic source |
| Onboarding / activation | Account created → setup done → first key action | Which setup step loses people before they reach value |
| Checkout / purchase | Product → cart → checkout → payment | Extra costs, forced sign-in, payment errors |
| Feature adoption | Opened feature → used it → used it again | Whether people who try a feature come back to it |
| Subscription / upgrade | Pricing page → plan selected → payment → active | Plan choice and payment failures |
Settings that change the numbers
The same events can give very different conversion rates depending on how the funnel is defined. Write these down next to the number.
- Conversion window. How long a person has, from the first step, to finish. A one-hour window and a 30-day window give very different rates for a considered purchase. Match it to how long the decision really takes.
- Step order. Ordered: steps must happen in sequence, other things can happen in between (the usual choice). Strict: no other funnel step in between. Any order: all steps within the window, in any sequence.
- Counting. Unique people (did this person ever get through?) or attempts (how many sessions tried?). Use people for most product questions and attempts for checkout usability.
- Same session. Whether all steps must happen in one visit. Useful for a checkout, wrong for a B2B trial that takes days.
- Exclusions. Drop conversions where something else happened in between, such as contacting support or viewing the refund policy.
- Holding a property constant. Require the same value at every step, for example the same product ID from product view to purchase, so viewing one item and buying another does not count.
How to run a funnel analysis
- Pick one outcome. A purchase, an activated account, a paid upgrade. One funnel, one goal.
- List the steps people must take, not every page they might see. Three to five steps is enough to find the problem.
- Set the window and the order to match the real process.
- Find the biggest drop, in people and in percentage, and estimate what fixing it is worth.
- Break it down by traffic source, device, country or new versus returning users. A funnel problem is often a problem in one segment, such as a payment method that fails on one platform.
- Look at the people who dropped. What did they do instead? Use path analysis, heatmaps or session replay on that step.
- Change one thing and compare the funnel before and after, or run an experiment.
Funnels in TapCub
In TapCub, funnels are in All-platform analytics › Behavior › Behavior analysis.
- Steps. 2 to 20 steps. A step is one or more event names (any of them counts) or page paths, and paths can use a wildcard, such as
/item/*for every product page. Each step can have its own filters. - Rules. Conversion window from minutes up to 180 days (default 7 days); ordered, strict or any order; unique people or attempts; same session; up to 5 exclusion events; and a hold property that must have the same value on every step.
- Breakdown and segments. Break a funnel down by one property (the 10 groups with the most entries are kept), or narrow it with filters and segments.
- Results. Each step shows people, rate versus step one, rate versus the previous step, drop-off and median time from the previous step. The summary shows entered, converted, overall rate and median time to complete. The largest drop is highlighted, and a trend shows the conversion rate by entry date.
- People behind the numbers. Click a step to see the people who reached it, or the people who dropped there, and save them as a segment for follow-up.
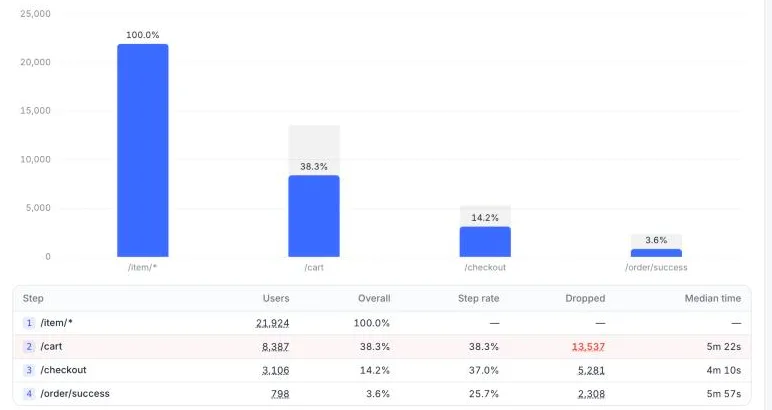
In the demo store, 38.3% of people who viewed a product went to the cart, 37.0% of those started checkout and 25.7% of those completed the order: 3.6% overall. The cart step loses the most people, but checkout → order success loses about three in four of the people who had already started checkout, and those are the closest to buying, so look there first.
Funnels follow the identity setting, so a person who starts on mobile and pays on desktop counts once when they are identified. Configuration and definitions are in the docs under Funnels.
Cart abandonment: a public benchmark
There is no universal "good" funnel conversion rate; it depends on the steps, the price and the traffic. The most cited public number is for one step of the checkout funnel. Baymard Institute averages 50 studies and puts online cart abandonment at 70.22% (2026 edition). In its survey of US shoppers, 42% had abandoned a cart because they were just browsing. Among the other reasons, the most common were:
| Reason (excluding "just browsing") | Share of shoppers |
|---|---|
| Extra costs too high (shipping, tax, fees) | 40% |
| Delivery was too slow | 20% |
| Didn't trust the site with card details | 19% |
| The site wanted me to create an account | 18% |
| Checkout too long or complicated | 17% |
Use a benchmark like this to sanity-check the order of magnitude, then compare your funnel with its own history and between segments, calculated the same way.
Funnel vs path analysis vs cohort analysis
| Method | Question | Starts from |
|---|---|---|
| Funnel analysis | How many people complete the steps I defined, and where do they stop? | A sequence you choose in advance |
| Path analysis | What do people actually do before or after a page or event? | One starting or ending point; the paths are discovered |
| Cohort analysis | Do people who started at different times behave differently over time? | A starting event and the period it happened in |
They work together: a funnel shows the drop, path analysis shows where the dropped people went, and cohorts show whether the fix kept working for later users.
Common mistakes
- Too many steps. Ten-step funnels hide the one step that matters. Start with three to five.
- A window shorter than the decision. B2B sign-ups and expensive purchases can take weeks.
- Comparing funnels with different settings. A 1-day and a 7-day window, or people versus attempts, are different metrics.
- Mixing platforms without identity. If people move from app to web anonymously, they drop out of the funnel at the switch.
- Optimizing the step with the biggest number. The largest absolute drop is not always the cheapest to fix. Estimate the gain per step first.
- Stopping at the number. A funnel shows where people drop. Use path analysis, heatmaps or session replay to see why. More pitfalls are in funnel analysis mistakes.
Related guides: Form Analytics, User Onboarding Metrics and Free Trial Conversion Rate. See also marketing funnel and conversion funnel optimization.
See also: Drop-off rate.
Was this explanation clear?
We use your answers to fix and expand this page.
Couldn’t send. Please try again in a minute.
Thanks for the feedback. We’ll use it to improve this page.You’ve already sent feedback on this page. Thanks.

Product Analyst
Focuses on event analysis, conversion funnels, and retention, using clear metric definitions and structured analysis to explain product performance.