Try it on your own data
Every report in this article is in the free plan. One snippet for web and apps, up to 10 sites.
Start freeA marketing funnel describes how people move from first hearing about you to buying. This guide covers the four stages and the metric for each, shows a sample funnel split by channel, and lists the mistakes that make funnel numbers misleading.
What you will learn
- Give every stage one weekly metric from one tool with fixed definitions
- Measure the funnel by channel; the site-wide average hides different shapes
- Fix the biggest stage-to-stage drop before buying more traffic
What a marketing funnel is
A marketing funnel is a model of how people go from not knowing you exist to becoming customers. It is drawn as a funnel because each stage has fewer people than the one before: many see an ad or an article, fewer look closely, fewer still sign up or ask for a quote, and a fraction buy.
The model is useful for two things. It reminds you that people at different stages need different content: someone who just learned the problem exists is not ready for a pricing page. And it gives you a place to look when growth stalls: if the top is full and the bottom is thin, the problem is in the middle.
The funnel is a simplification. Real people skip stages, loop back and buy on the third visit through a different channel. Treat it as a map for planning and measurement, not as a description of every journey.
The four stages
Most teams use some version of four stages. The names vary (awareness, interest, consideration, conversion; or top, middle and bottom of the funnel, TOFU, MOFU and BOFU), but the logic is the same. The table gives the question, typical content and the metric for each.
A fifth stage, retention and advocacy, is often added after the purchase. It belongs to the same plan, but you measure it with product and revenue data rather than website traffic.
| Stage | Question the visitor has | Typical content | Metric to track |
|---|---|---|---|
| Awareness (top) | What is this problem? Who can help? | Articles, social posts, videos, ads | New visitors and reach by channel |
| Interest | Is this relevant to me? | Guides, comparisons, newsletters | Engaged visits, micro-conversions |
| Consideration (middle) | Is this the right option? | Case studies, pricing, demos, trials | Leads, trial starts, pricing-page visitors |
| Conversion (bottom) | Is it worth it now? | Pricing, onboarding help, sales calls | Customers, revenue, lead-to-customer rate |
Retention and advocacy follow conversion and are measured with product and revenue data.
How to measure each stage
Each stage needs one number you can pull every week, from the same tool, with the same definitions:
- Awareness: new visitors and reach by channel. In web analytics, new visitors by traffic source. For channels you do not own (social, podcasts), the platform's reach numbers.
- Interest: engaged visits. Pick one definition (two or more pages, or 30 seconds or more, or a key page such as pricing) and keep it. Micro-conversions such as a guide download or a pricing-page view work well here.
- Consideration and conversion: leads and customers. A goal for the lead form or trial start, and the purchase or closed deal from your CRM or billing. See lead tracking.
- Stage-to-stage rates: each stage divided by the one before. These are the numbers that tell you where to work.
Measure by channel from the start. A single funnel for the whole site hides the fact that each channel has its own shape.
A sample funnel, split by channel
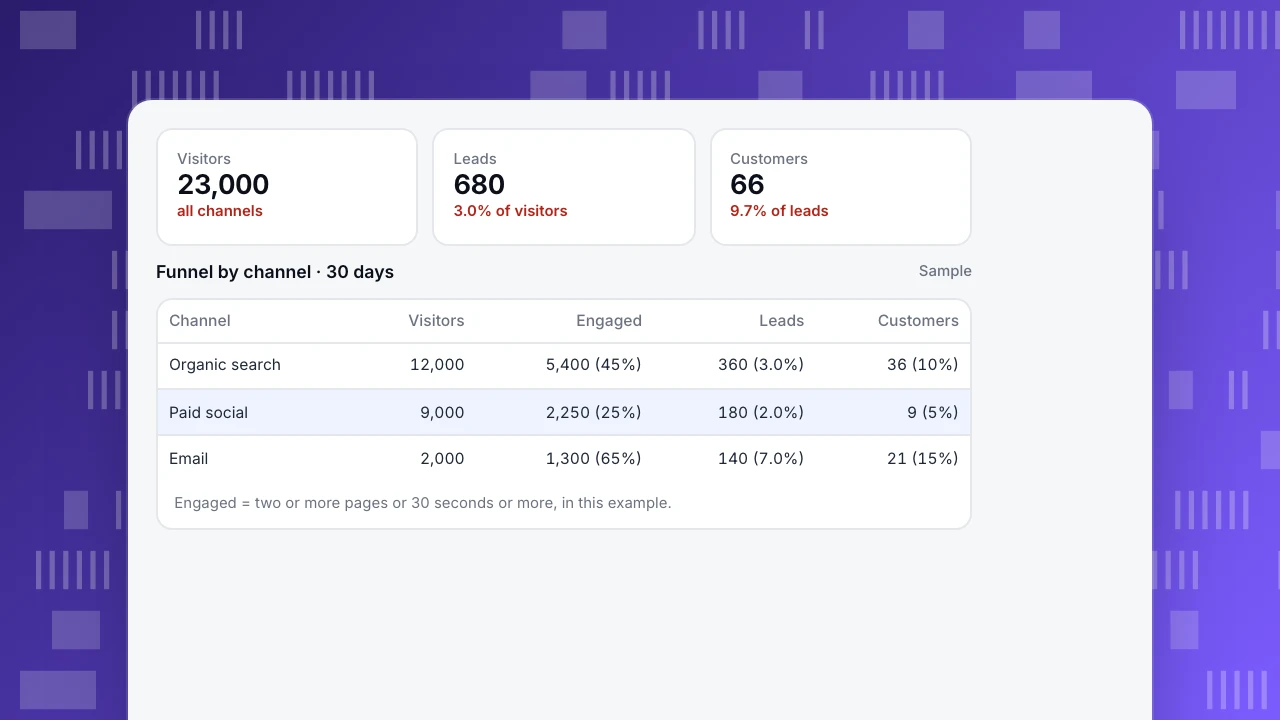
The sample shows 30 days for a B2B site with three channels. Overall, 23,000 visitors became 680 leads and 66 customers. That average hides three different funnels:
- Organic search brings the most visitors and converts steadily: 45% engaged, 3.0% became leads, 10% of leads bought.
- Paid social fills the top but leaks at every stage: 25% engaged, 2.0% leads, 5% of leads bought. Its cost per customer is the number to check.
- Email is small but strong at the bottom: 65% engaged, 7.0% leads, 15% of leads bought. It reaches people who are already in the middle of the funnel.
The decisions differ too: paid social needs better targeting or a landing page that matches the ad, organic needs more middle-of-funnel content to turn readers into leads, and email needs a bigger list, which means turning more organic readers into subscribers.
Visitors
23,000
all channels
Leads
680
3.0% of visitors
Customers
66
9.7% of leads
Funnel by channel · 30 days
Sample| Channel | Visitors | Engaged | Leads | Customers |
|---|---|---|---|---|
| Organic search | 12,000 | 5,400 (45%) | 360 (3.0%) | 36 (10%) |
| Paid social | 9,000 | 2,250 (25%) | 180 (2.0%) | 9 (5%) |
| 2,000 | 1,300 (65%) | 140 (7.0%) | 21 (15%) |
Engaged = two or more pages or 30 seconds or more, in this example.
Common mistakes
- Counting stages in different tools. Visitors from analytics, leads from a form tool, customers from the CRM, all with different date logic. Agree which tool owns each number.
- Comparing stages across different time windows. A lead in March may buy in May. Use a funnel with a conversion window that fits your sales cycle (TapCub allows up to 180 days), or compare cohorts by the month they arrived.
- Optimising the top only. More traffic into a leaking middle just produces more leaks. Fix the biggest stage-to-stage drop first.
- Treating every visitor as top of funnel. Someone arriving from a branded search or a sales email is already near the bottom. Split by source before you judge content.
FAQ
What are the stages of a marketing funnel?
Usually awareness, interest, consideration and conversion, sometimes grouped as top, middle and bottom of the funnel. Many teams add retention and advocacy after the purchase.
What is the difference between a marketing funnel and a sales funnel?
The marketing funnel covers the stages marketing owns, up to a qualified lead or a self-serve purchase. The sales funnel continues from the qualified lead through calls, proposals and close. In self-serve products the two are often the same funnel.
What is a good marketing funnel conversion rate?
It depends on the channel, price and sales cycle, so compare your own funnel by channel and over time first. For lead generation sites, low single-digit visitor-to-lead rates are common; see what is a good conversion rate.
Is the marketing funnel still relevant?
As a planning and measurement tool, yes. As a literal description of how people buy, no: journeys loop and cross channels. Use it to decide what each stage needs and where you lose people.
Was this article helpful?
We use your answers to fix and expand this page.
Couldn’t send. Please try again in a minute.
Thanks for the feedback. We’ll use it to improve this page.You’ve already sent feedback on this page. Thanks.

Growth Strategist
Explores acquisition channels, activation, and conversion experiments, turning data insights into actionable growth hypotheses and evaluation methods.