Try it on your own data
Every report in this article is in the free plan. One snippet for web and apps, up to 10 sites.
Start freeMarketing ROI looks like simple arithmetic, but the same campaign can show 320% or 76% depending on what you count. This guide gives the formula in three versions, works through one campaign with each, and explains how ROI differs from ROAS.
What you will learn
- ROI = (return − cost) ÷ cost, but "return" should be gross profit, not revenue
- Subtract conversions that would have happened anyway for the incremental ROI budget decisions need
- ROAS is revenue per ad dollar; it ignores margin and can hide a losing campaign
What is marketing ROI?
Marketing ROI (return on investment) measures how much a campaign or channel earned compared with what it cost. An ROI of 150% means every dollar spent came back with $1.50 on top.
It is the number finance asks for, and the one most often calculated in a way that flatters the campaign.
The formula, in three versions
Marketing ROI = (return − marketing cost) ÷ marketing costWhat you count as "return" changes everything. The table below compares the three common versions.
| Version | Return counted | Formula | Use it for |
|---|---|---|---|
| Revenue ROI | All attributed revenue | (revenue − cost) ÷ cost | Quick comparisons only |
| Gross-profit ROI | Revenue × gross margin | (gross profit − cost) ÷ cost | Most budget decisions |
| Incremental ROI | Profit from sales that would not have happened otherwise | (incremental profit − cost) ÷ cost | Scaling or cutting a channel |
Say which version you report. The same campaign can differ by a factor of four.
A worked example
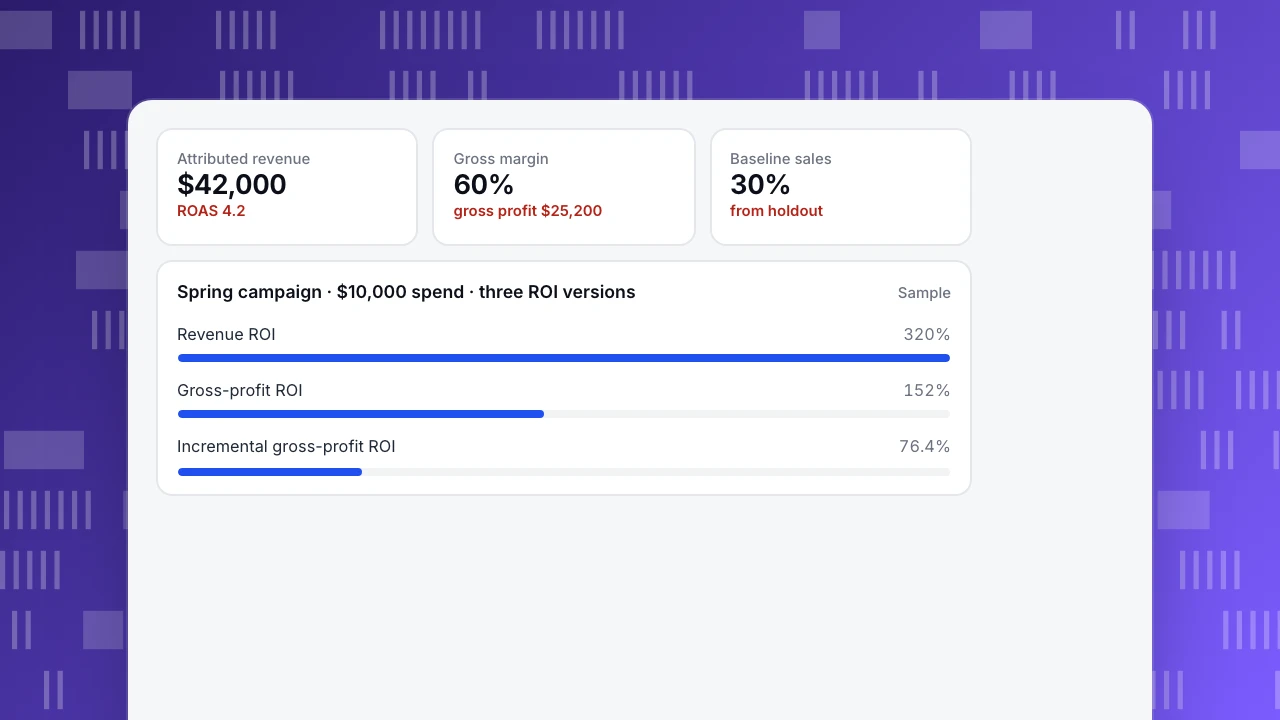
A spring campaign costs $10,000 in ads, creative and tools. Orders attributed to it bring $42,000 in revenue. The products have a 60% gross margin (sample numbers).
- Revenue ROI: (42,000 − 10,000) ÷ 10,000 = 320%. Easy to compute, but it pretends the products cost nothing to make and ship.
- Gross-profit ROI: gross profit is 42,000 × 0.6 = 25,200, so (25,200 − 10,000) ÷ 10,000 = 152%.
- Incremental ROI: a holdout group that did not see the ads still bought at 70% of the exposed group's rate, so 30% of the revenue would have come anyway. Incremental revenue is 29,400; gross profit 17,640; ROI = (17,640 − 10,000) ÷ 10,000 = 76.4%.
Still profitable, but a quarter of what the first number claimed. Budget decisions should use the third version where you can measure it, and the second where you cannot. See incrementality.
Attributed revenue
$42,000
ROAS 4.2
Gross margin
60%
gross profit $25,200
Baseline sales
30%
from holdout
Spring campaign · $10,000 spend · three ROI versions
SampleROI vs ROAS
ROAS (return on ad spend) is revenue ÷ ad spend: $42,000 ÷ $10,000 = 4.2 in the example. It is quick and used inside ad platforms, but it ignores margin and other costs. A ROAS of 2 can lose money on a product with a 40% margin. ROI tells you whether you made money; ROAS tells you how much revenue each ad dollar was credited with. See ROI and ROAS.
What counts as cost
- Media spend: ads, sponsorships, paid placements.
- Production: creative, video, landing pages, agency fees.
- Tools used only for the campaign.
- People: a share of salaries if you are comparing channels that need very different effort, such as SEO content vs paid search.
Leaving out everything but media spend makes labour-heavy channels look free.
What is a good marketing ROI?
There is no universal benchmark; it depends on margin, payback period and whether customers come back. Two more useful checks:
- Is gross-profit ROI positive within your target payback period? See CAC payback period.
- For repeat-purchase businesses, does ROI improve when you include second and third orders from the same customers?
Common mistakes
- Using revenue instead of profit.
- Counting conversions that would have happened anyway, especially on branded search and retargeting.
- Mixing attribution models between campaigns. Compare on the same rule and window.
- Short windows for long cycles. B2B deals may close months after the campaign.
Getting the numbers from TapCub
Open All-platform analytics › Business › Channel ROI. On the Costs tab, add spend one row at a time or import a CSV with day, channel, source, campaign, cost, currency, clicks and impressions. The ROI tab then shows spend, purchases, revenue, CPC (spend ÷ sessions), CPA (spend ÷ purchases) and ROAS per channel, with revenue taken from your order data. Gross margin and holdout results live outside TapCub, so apply versions 2 and 3 in a spreadsheet. To compare campaigns on a sign-up goal instead, see marketing dashboard.
Was this article helpful?
We use your answers to fix and expand this page.
Couldn’t send. Please try again in a minute.
Thanks for the feedback. We’ll use it to improve this page.You’ve already sent feedback on this page. Thanks.

Growth Strategist
Explores acquisition channels, activation, and conversion experiments, turning data insights into actionable growth hypotheses and evaluation methods.